ISpectrum
- Yardımcı programlar
-
Sergei Ivanov
 Time convertation into profit
 - Sürüm: 1.16
- Etkinleştirmeler: 5
Non-trading MT5 tool: draws published projection lines for a limited list of instruments. Recommended M30.
---
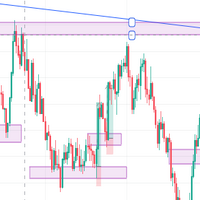
iSpectrum is a non-trading analytical tool for MetaTrader 5. It draws projection lines and background shading on the chart of the current symbol. The lines are calculated by the author with specialised timing-analysis software and are loaded from the author's data server over a secure encrypted connection.
The program does not open, close or modify orders and does not manage positions. It does not use DLL files. It is an Expert Advisor only because loading data requires the WebRequest function, which indicators cannot use.
What it shows
The dashboard has four tabs:
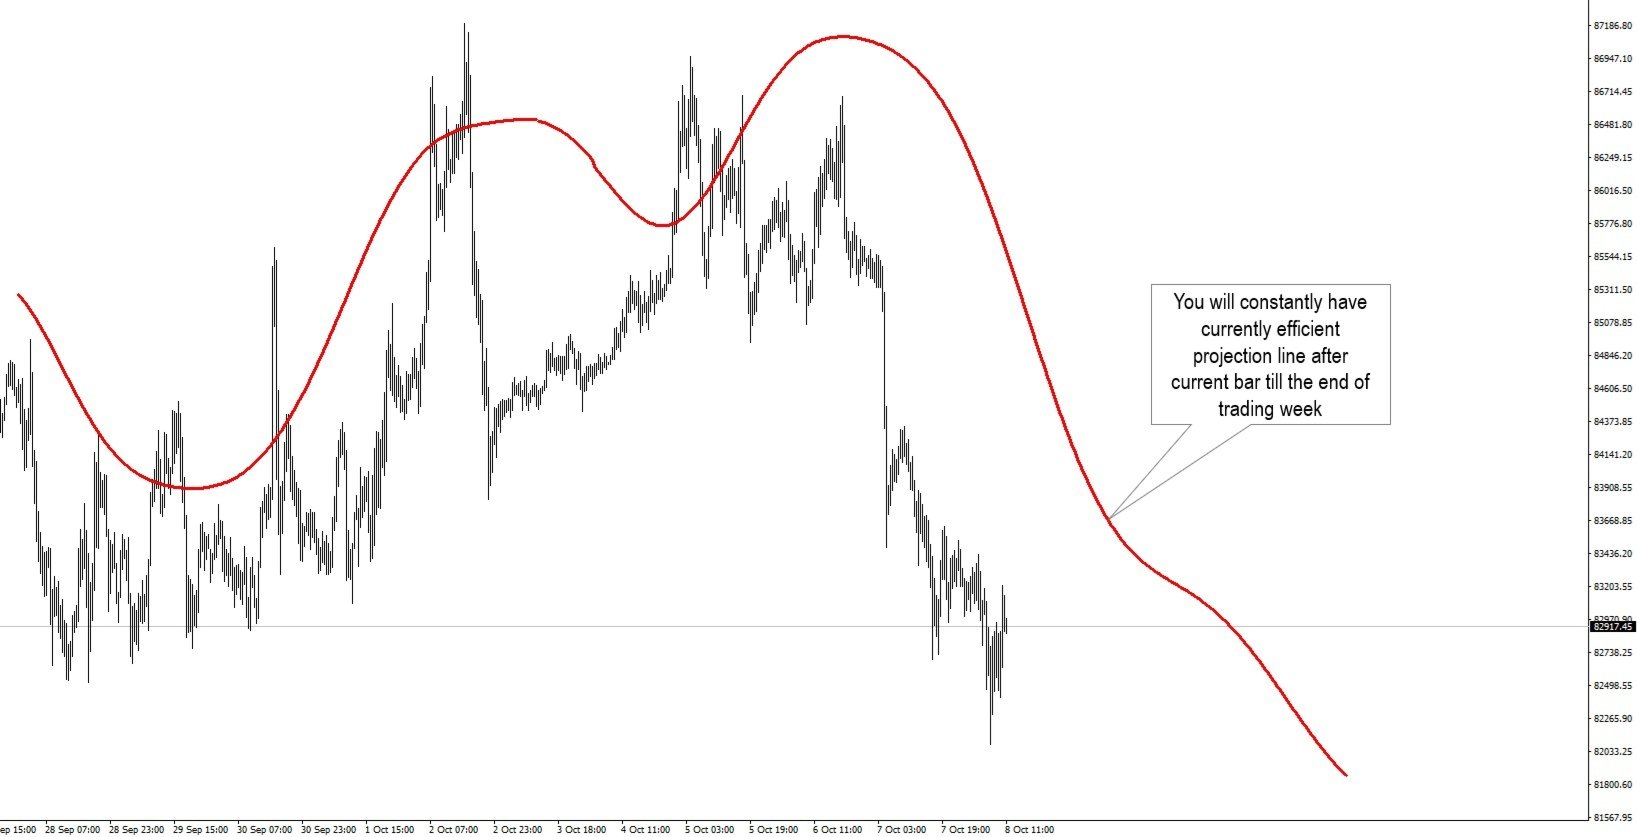
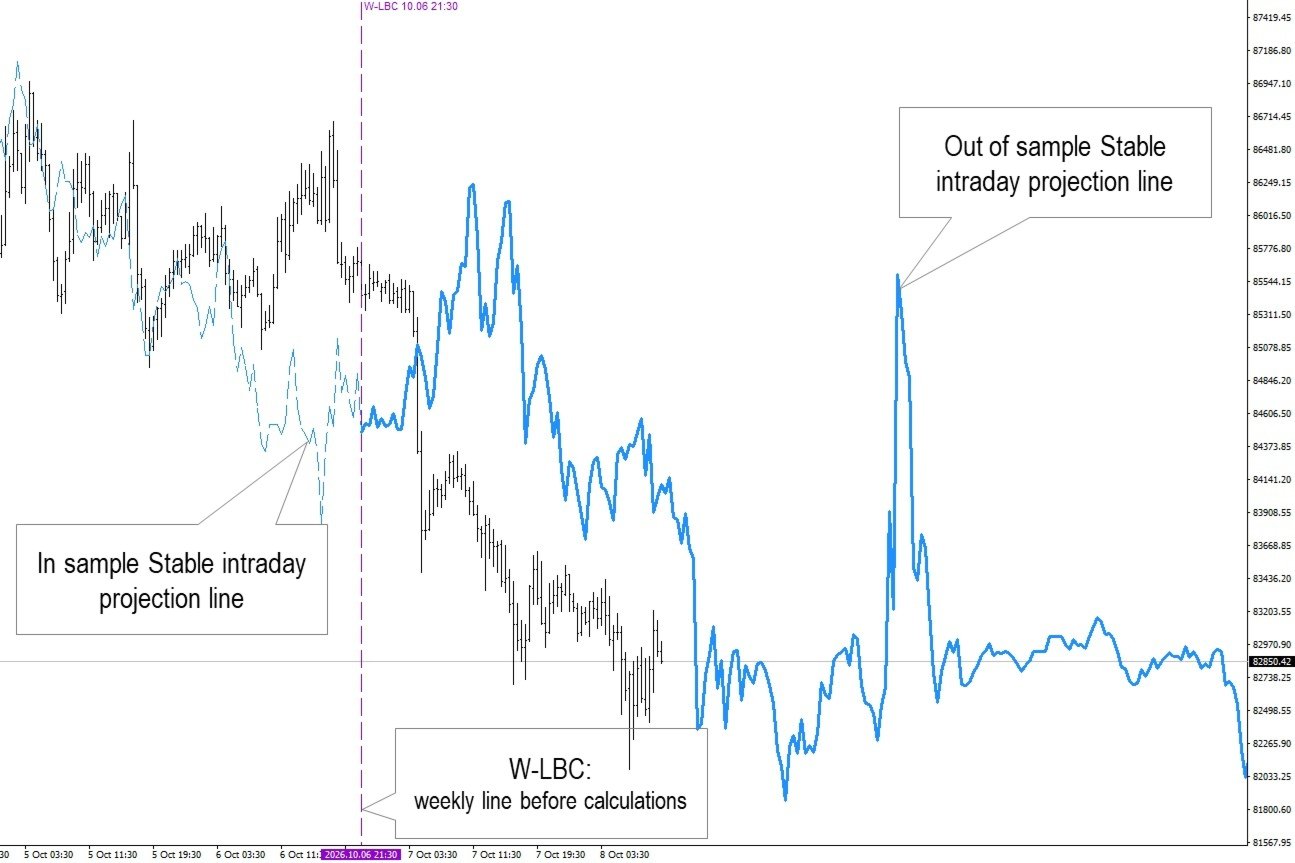
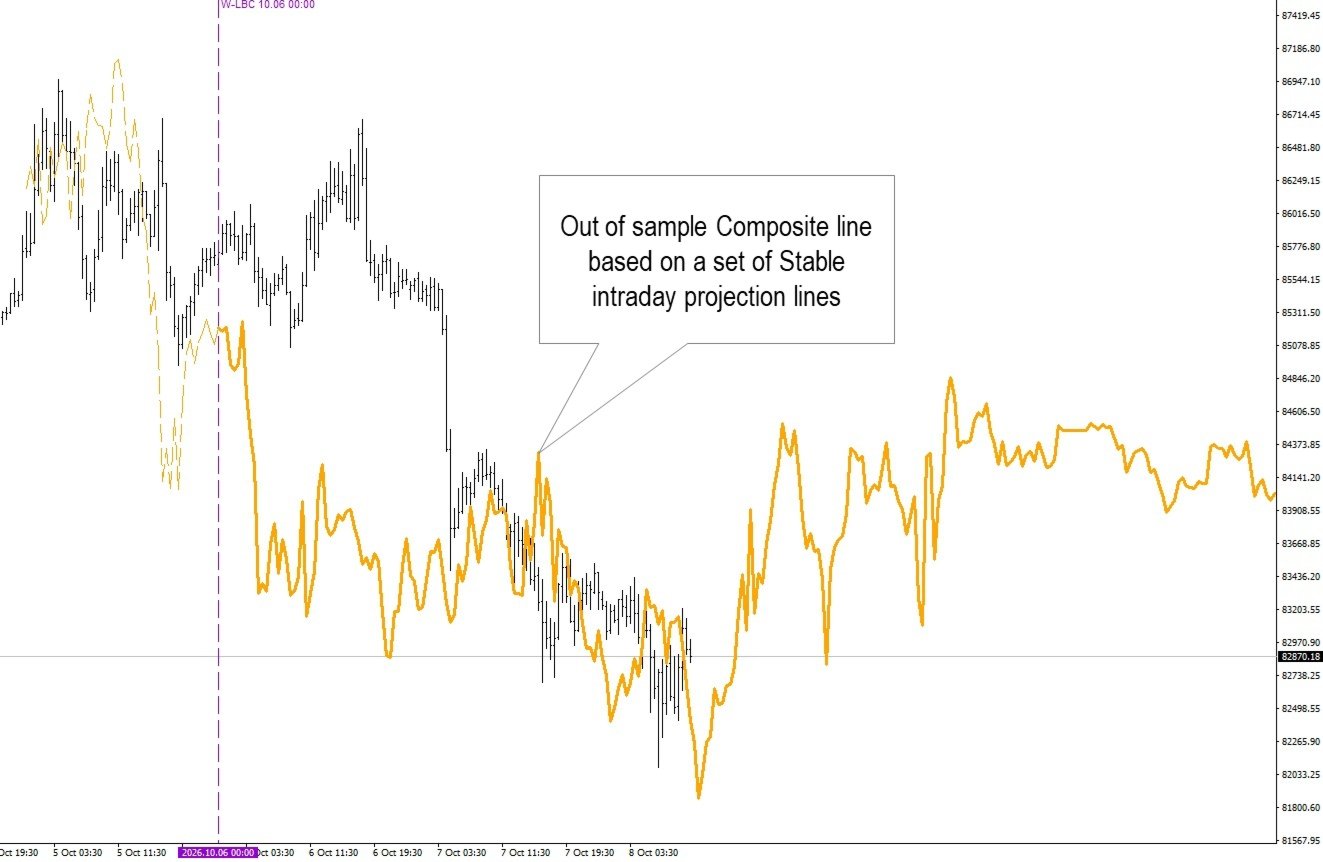
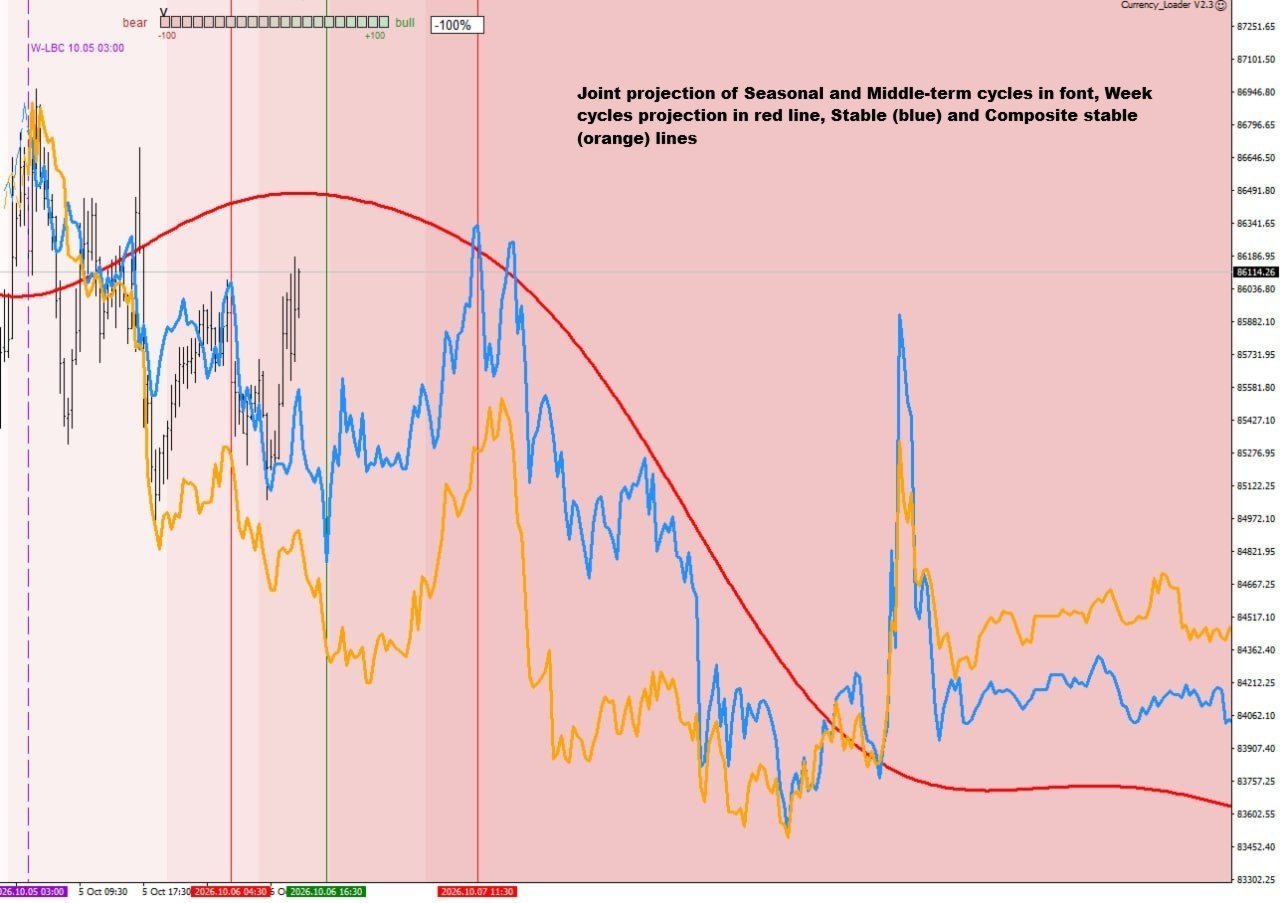
- Week: the weekly projection line, with Stable and Comp (composite) lines that can be switched on or off.
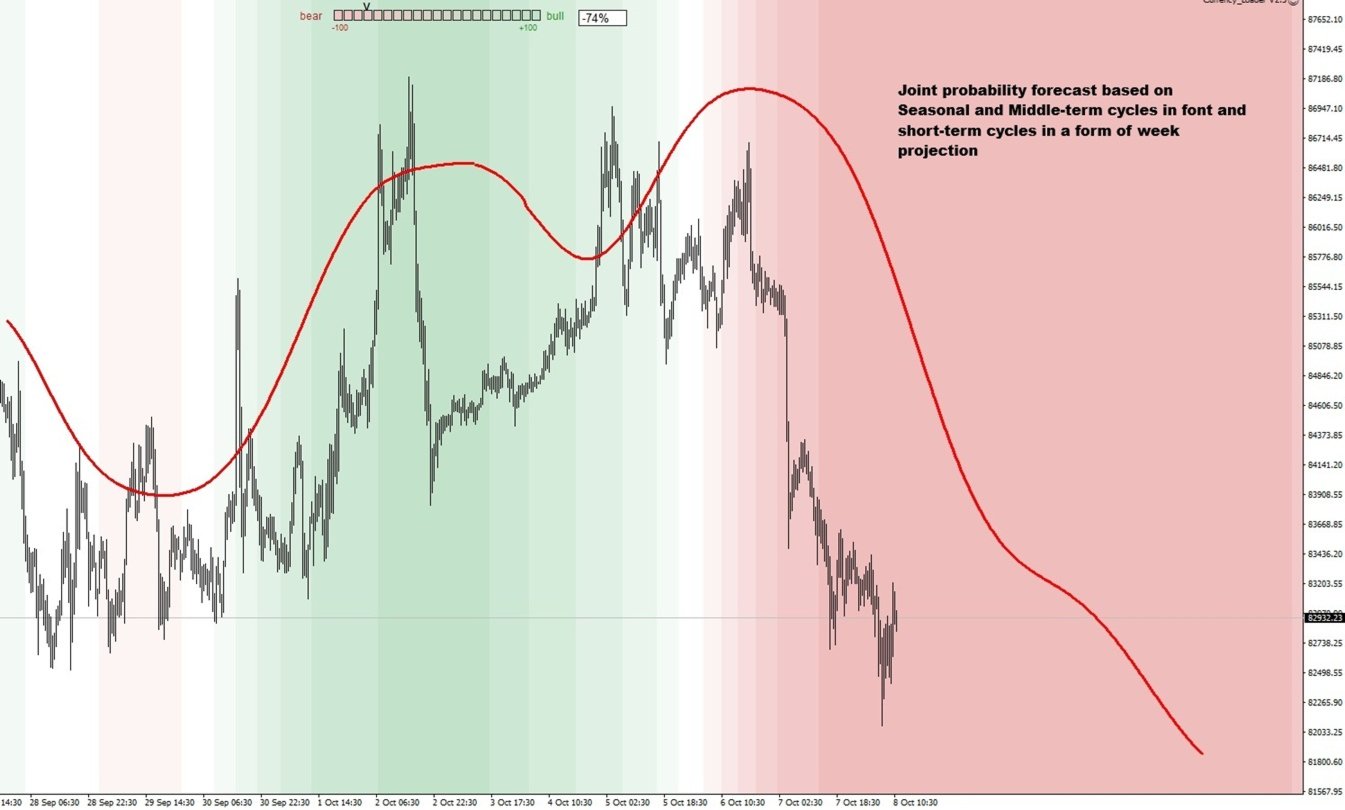
- Middle: medium-term projection with background shading that can be switched on or off.
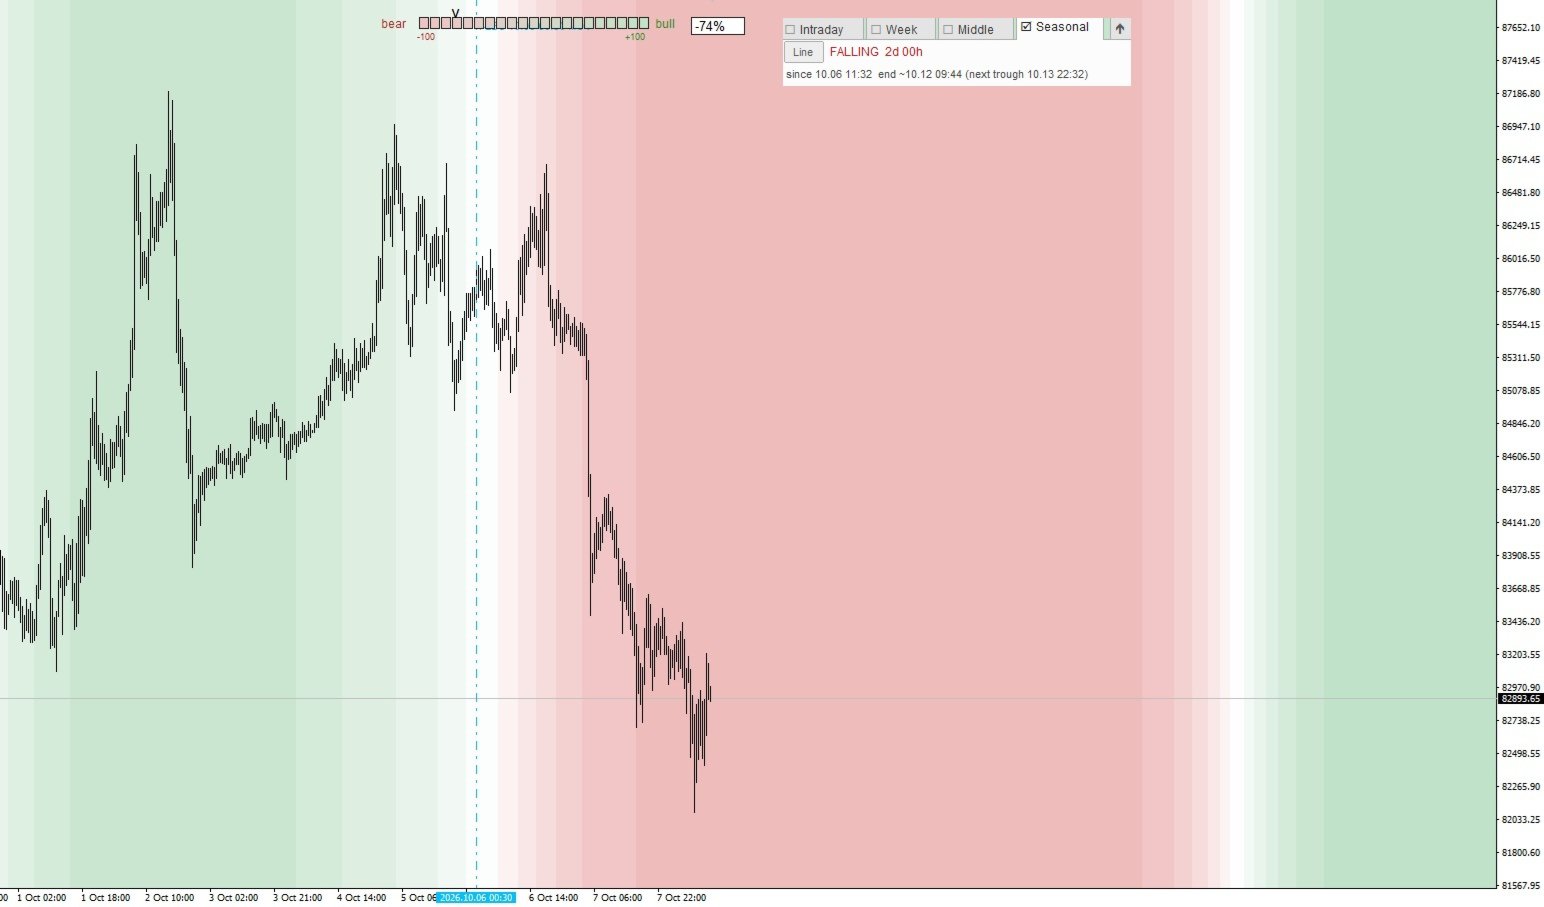
- Seasonal: seasonal projection with background shading that can be switched on or off.
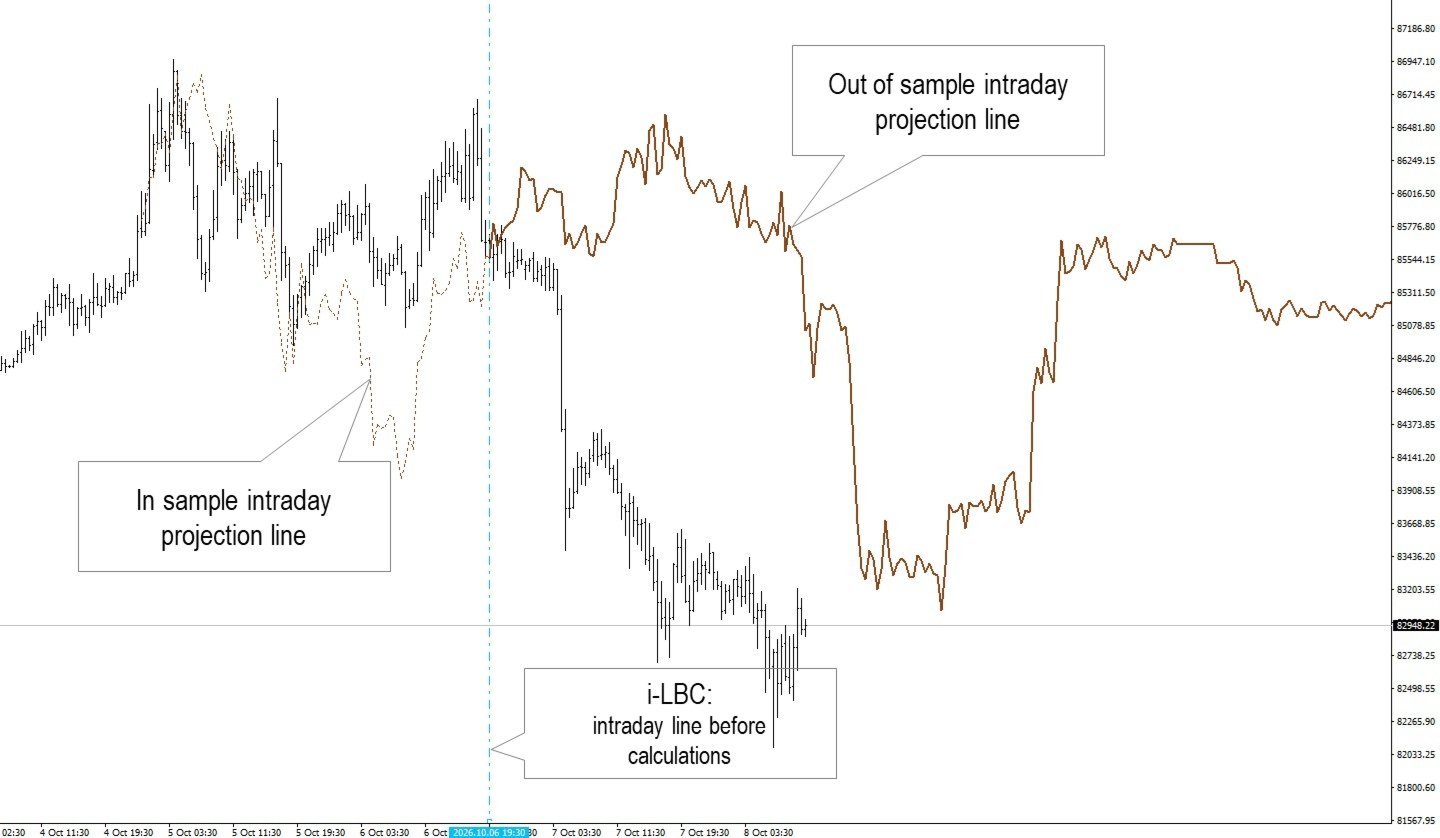
- Intraday: the published intraday projection line.
Middle and Seasonal run to the last point of the published series. A heat background can be shown behind the lines. Each line and its background can be shown or hidden on the panel. A one-row legend under the panel names the lines that are on the chart. The calculation settings are fixed by the author and cannot be changed by the user.
Supported instruments
Lines are published only for a limited list of instruments: EURUSD, GBPUSD, XAUUSD (Gold), BTCUSD (Bitcoin), WTI crude oil, S&P 500 index (US500, SPX500), Nasdaq 100 (NAS100, US100, USTEC) and Hang Seng (HK50). The chart symbol is matched automatically, including common broker names and suffixes. On other symbols the panel shows "No published lines for this symbol" and no lines are drawn.
Recommended timeframe: M30.
Setup
An internet connection is required. Allow the data server in the terminal before the first start:
1. Open Tools > Options and select the Expert Advisors tab.
2. Enable "Allow WebRequest for listed URL".
3. Add https://tosszbmacumhmmdyegol.supabase.co and click OK.
4. Open an M30 chart of a supported instrument and attach iSpectrum. If you added the address after attaching, remove the advisor and attach it again.
Until the address is allowed, the chart shows a built-in sample and the panel tells you where to add the address.
Only the chart symbol is sent to the server, over a secure encrypted connection. No account number, login, terminal identifier or other personal data is sent. New data is requested every 10 minutes by default (minimum 5 minutes).
Input parameters
- Poll interval, seconds: data update interval. Default 600, minimum 300.
- Show Week, Show Middle, Show Seasonal, Show Intraday, Show Stable: show or hide the line at start.
- Background boxes on at start: switch on the background shading at start.
- Use offline sample when the server is unreachable: show the built-in sample if no data can be loaded.
- Widen chart shift once so the series end can show: the chart shift is widened once; after that, scrolling and Chart Shift stay as you set them.
Strategy Tester
WebRequest does not work in the Strategy Tester. In the tester the program draws a built-in sample (XAUUSD data) to show how the lines and the panel look. Current lines are available only on a live chart.
Risk note
The lines are analytical scenarios, not trading signals. They do not guarantee any future price movement or trading result. All trading decisions and their risks remain with the user.