KD SMC Mini Charts
- Göstergeler
-
Dien Du Khanh Duong
 KD Trading System: Trade with context. Read structure. Confirm across timeframes. Plan the risk.
==================================================================================== - Sürüm: 1.2
- Güncellendi: 5 Ekim 2026
- Etkinleştirmeler: 10
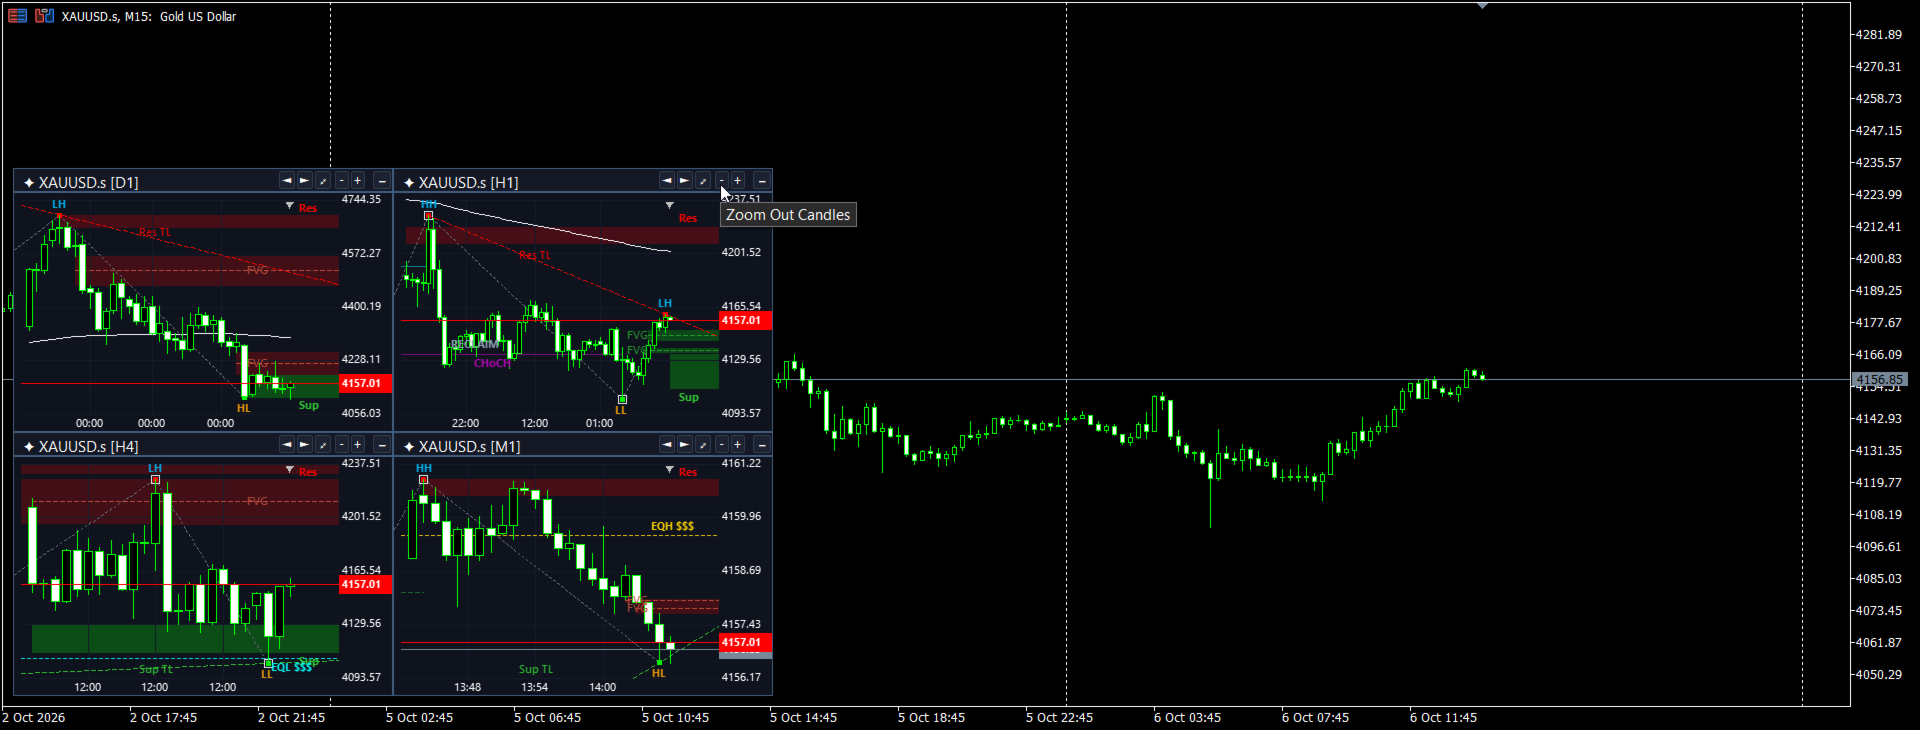
KD SMC MiniCharts is a multi-timeframe analysis tool for MetaTrader 5 that displays up to four synchronized mini charts directly inside your main chart.
Each mini chart can use its own timeframe and display SMC and Price Action information independently. This allows you to monitor lower- and higher-timeframe structure without repeatedly switching the timeframe of your main chart or opening multiple chart windows.
Key Capabilities
1. Up to 4 Multi-Timeframe Mini Charts
Display up to four mini charts inside the active MT5 chart.
For example, you can keep the main chart on M5 while displaying M15, H1, H4, and D1 views alongside it.
Each mini chart slot can be configured independently:
- Timeframe
- Window height
- Chart scale
- Trade history display
Shared layout controls allow you to adjust the screen corner, container width, spacing, and X/Y position of the mini-chart area.
2. SMC and Price Action Analysis
Each mini chart processes its selected timeframe independently and can display:
- Market Structure: ZigZag swings, HH / HL / LH / LL labels, Break of Structure (BOS), and Change of Character (CHoCH).
- Supply & Demand: Order Blocks (OB) and Support / Resistance zones.
- Fair Value Gaps: FVG areas with optional 50% equilibrium levels.
- Dynamic Trendlines: Structure-based trendlines calculated from the mini chart timeframe.
- Liquidity: Liquidity Sweeps with Reclaim detection and Equal Highs / Equal Lows (EQH / EQL).
- Trend Filter: Configurable slow Exponential Moving Average (EMA), with EMA 200 as the default setting.
This keeps the analysis specific to each mini chart rather than simply copying objects from the main chart.
3. Trade Levels and KD AutoSLTP Synchronization
KD SMC MiniCharts can display trading information across the additional timeframe views.
Supported information includes:
- Position Entry
- Stop Loss
- Take Profit
- Buy / Sell trade markers
- Bid / Ask lines
- Trade history
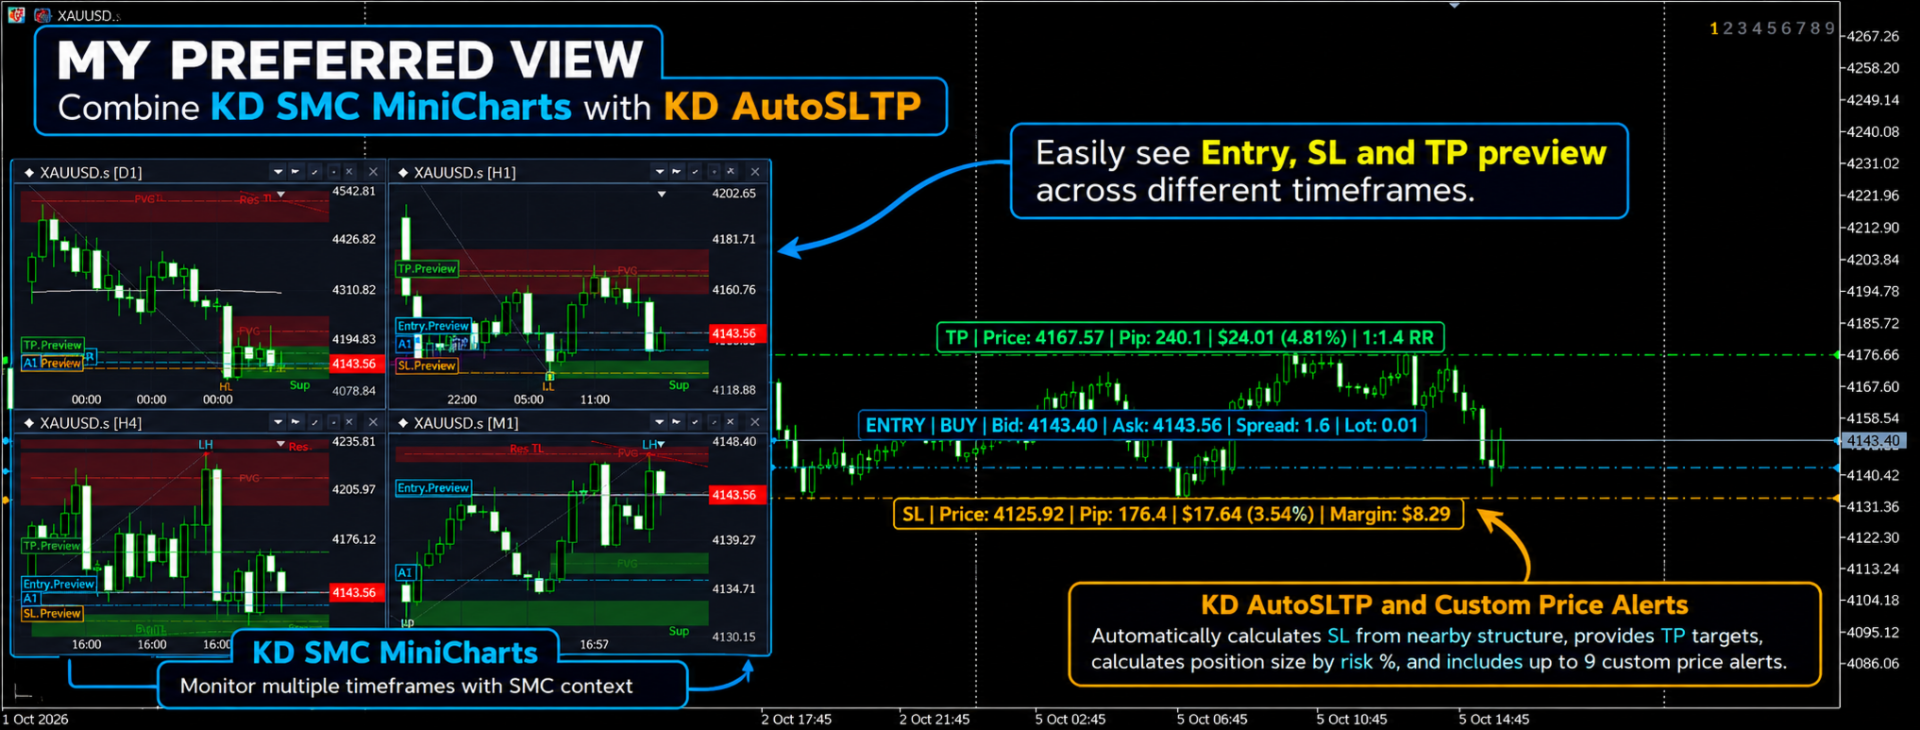
When used together with KD AutoSLTP, Entry, SL, and TP preview levels can also be synchronized with the mini charts.
This makes it possible to adjust the planned levels on the main chart while viewing their location relative to structure on other timeframes.
Practical Multi-Timeframe Workflows
Workflow 1: Comparing Execution and Higher-Timeframe Structure
Keep the main chart on an execution timeframe such as M5 or M15 while using the mini charts for broader context.
For example:
- Main Chart — M1: Execution view for observing detailed price action and managing entries.
- Mini Chart 1 — M15: Local structure view for monitoring nearby swings, BOS / CHoCH, FVGs, and short-term Support / Resistance.
- Mini Chart 2 — H1: Intraday context for comparing the M1 setup with broader market structure, liquidity areas, and directional movement.
- Mini Chart 3 — H4: Higher-timeframe structure for monitoring major swings, Order Blocks, FVGs, and Support / Resistance areas.
- Mini Chart 4 — D1: Broad market context for viewing larger price structure and significant higher-timeframe areas.
The lower-timeframe chart remains available for detailed price observation while the mini charts show how the same market is developing across broader timeframes.
This can be useful for comparing local price movement with higher-timeframe swings, structure, Order Blocks, FVGs, and Support / Resistance areas.
Workflow 2: Monitoring Liquidity and Structure Across Timeframes
Use one mini chart to monitor a higher-timeframe area and another to observe lower-timeframe price behavior.
For example, when price approaches an H4 or H1 FVG, Order Block, or structural area, an M15 or M5 mini chart can provide a closer view of:
- BOS / CHoCH
- Liquidity Sweeps
- Reclaim behavior
- Swing structure
- Dynamic trendlines
This provides multiple levels of market structure on the same workspace without repeatedly changing the timeframe of the main chart.
Workflow 3: Reviewing SL / TP Levels Across Multiple Timeframes
When used with KD AutoSLTP, planned Entry, Stop Loss, and Take Profit levels can be displayed across the mini charts.
For example, an Entry / SL / TP preview created on the main chart can also be viewed against H1 or H4 structure.
This provides additional visual context for comparing planned trade levels with nearby Support / Resistance, Order Blocks, FVGs, liquidity areas, or other visible market structure before an order is placed.
Works with the KD Trading Suite
KD SMC MiniCharts can be used independently or alongside other KD Trading Suite tools:
- KD Ultimate SMC: SMC structure, liquidity mapping, imbalance areas, and multi-timeframe analytical context.
- KD AutoSLTP: Risk-based lot sizing and visual Entry / SL / TP planning, with preview synchronization to the mini charts.
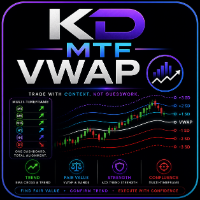
- KD MTF VWAP: Multi-timeframe VWAP levels and standard-deviation bands.
- KD MTF Candle Timer: Candle-close countdowns across multiple timeframes.
- KD HTF Candles: Higher-timeframe candles displayed on lower-timeframe charts.
- KD MTF Dashboard: Multi-symbol and multi-timeframe market monitoring.
Each tool focuses on a different part of the analysis and trade-planning workflow, so they can be combined according to the user's preferred setup.
Input Parameters
Mini Chart Slots 1–4
- Target Timeframe: Select the timeframe for each mini chart.
- Window Height: Set the vertical size of each chart.
- Chart Scale: Configure the chart zoom level.
- Show Trade History: Show or hide historical trade markers.
Window and Display Configuration
- Window Corner & Offsets: Select the screen anchor corner and adjust X/Y offsets.
- Window Width: Adjust the mini-chart container width.
- Price & Date Scales: Show or hide price and time scales.
- Chart Shift & Auto Scroll: Configure the right-side chart margin and scrolling behavior.
SMC Modules
- ZigZag & Swing Labels: Display structural swings and HH / HL / LH / LL labels.
- BOS / CHoCH: Display market structure break information.
- Order Blocks & S/R Zones: Show Order Blocks and Support / Resistance areas.
- Fair Value Gaps & Trendlines: Display FVG areas and dynamic trendlines.
- EQH / EQL: Detect Equal Highs and Equal Lows using the configured threshold.
- Slow EMA: Enable the EMA trend filter and configure its period.
Open Orders and Trade Levels
- Show Trade Levels: Display Entry, Stop Loss, and Take Profit levels.
- Show Bid / Ask Lines: Display current Bid and Ask prices.
- Trade Colors: Configure colors for Buy, Sell, Stop Loss, and Take Profit information.
Support
For configuration questions or technical support, please use the MQL5 product comments or the MQL5 messaging system.