RSI Pro Ar Brain
- Göstergeler
-
Bahtiyar Arniyazov
 Проработал в строительстве гражданских и промышленных объектов более33 лет на разных должностях.
 - Sürüm: 1.0
- Etkinleştirmeler: 5
RSI Pro Ar Brain — classic RSI with a brain
A standard RSI gives the same signals on every timeframe and every asset — and that is exactly why it often fails. On volatile crypto it always “screams” overbought; on calm gold it “falls asleep” in the neutral zone.
RSI Pro Ar Brain rethinks the classic oscillator: the indicator automatically adjusts to the current timeframe and the real volatility of the instrument, filters out the noise and only gives signals where they actually make sense.
Key features
1. Adaptive settings (the highlight)
- Auto TF — the RSI period is selected automatically for the timeframe (M1 to MN1).
- Auto Asset — the indicator measures instrument volatility via ATR and shifts the RSI period and zone levels accordingly. Manual settings are always available.
- Overbought/oversold and extreme levels also adapt to volatility — a dynamic scale instead of “blind” 70/30.
2. Signal line and momentum
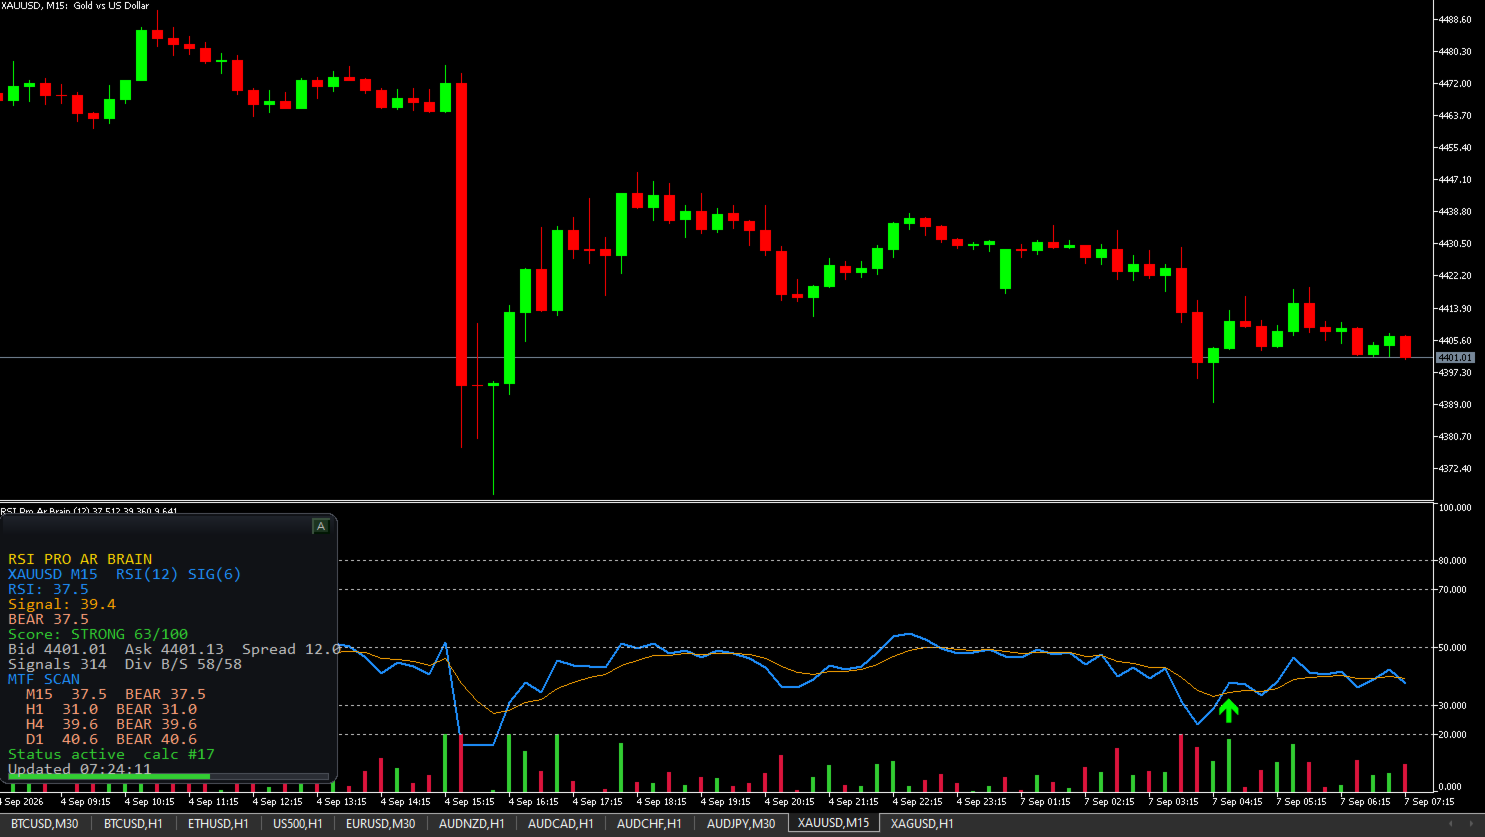
- Smoothed signal line (an EMA-like line of the RSI) — crossover points.
- Colored Momentum histogram: direction and strength of the RSI momentum.
3. Universal signal strength score (0–100)
Every market point gets a score from 0 to 100 based on four factors:
- RSI zone (regular/extreme);
- distance between RSI and signal line;
- line crossovers;
- directional movement relative to the 50 level.
Grades: Exceptional (80+) → Strong (60+) → Moderate (40+) → Weak (20+) → None.
4. Ready-made Buy/Sell signals with arrows
Four signal types from oversold/overbought conditions:
- “hook” (reversal) from the zones;
- exit from a zone;
- RSI/signal line crossover (with a minimum gap filter);
- candle confirmation (on/off).
Arrows on closed bars are finalized; on the current bar a “live” arrow with a muted color is shown (no misleading repainting).
5. Automatic divergence detection
Fractal extremes of price and RSI: classic bullish and bearish divergences are drawn right on the RSI chart, counted by a counter and can be accompanied by an alert.
6. Multi-timeframe scanner (MTF)
Simultaneous monitoring of up to 10 timeframes (default M15, H1, H4, D1) showing the current RSI zone for each — the whole picture of higher timeframes on one screen.
7. Live dashboard
A modern dark canvas panel: RSI, Signal, current zone, Score, Bid/Ask/Spread, signal and divergence counters, MTF scan, status and a Mute button. Position, size, font and colors are configurable.
8. Alerts
Alert + Push notifications for buy, sell and divergences — each can be enabled separately.
Settings overview
| Group | What it configures |
|---|---|
| RSI | period, applied price (Open/High/Low/Median/Typical/Weighted) |
| Adaptive | auto period by TF and volatility |
| Signal | signal line period |
| Zones | OB/OS and extreme levels |
| Filters | minimum Score, candle confirmation, gaps |
| Divergence | divergence scan, lookback, threshold |
| MTF Scanner | list of timeframes |
| Visual / Panel / Alerts | colors, panel, notifications |
Compatibility
- Platform: MetaTrader 5, separate indicator window (0–100).
- Instruments: Forex, metals, indices, crypto and CFD.
- For symbols with a small history, download the history in the terminal before use.
Important
The indicator is an analytical tool, not a trading system and not financial advice. It gives no profit guarantees: any signal requires verification on a demo account, risk management (Stop Loss) and market context. Past performance does not guarantee future results.