
MT5 Volume Profiles
- Göstergeler
-
Anh Hung Ngo
 Request a MQL5 Tools, visit quantumine.net
 - Sürüm: 1.1
- Güncellendi: 18 Ağustos 2026
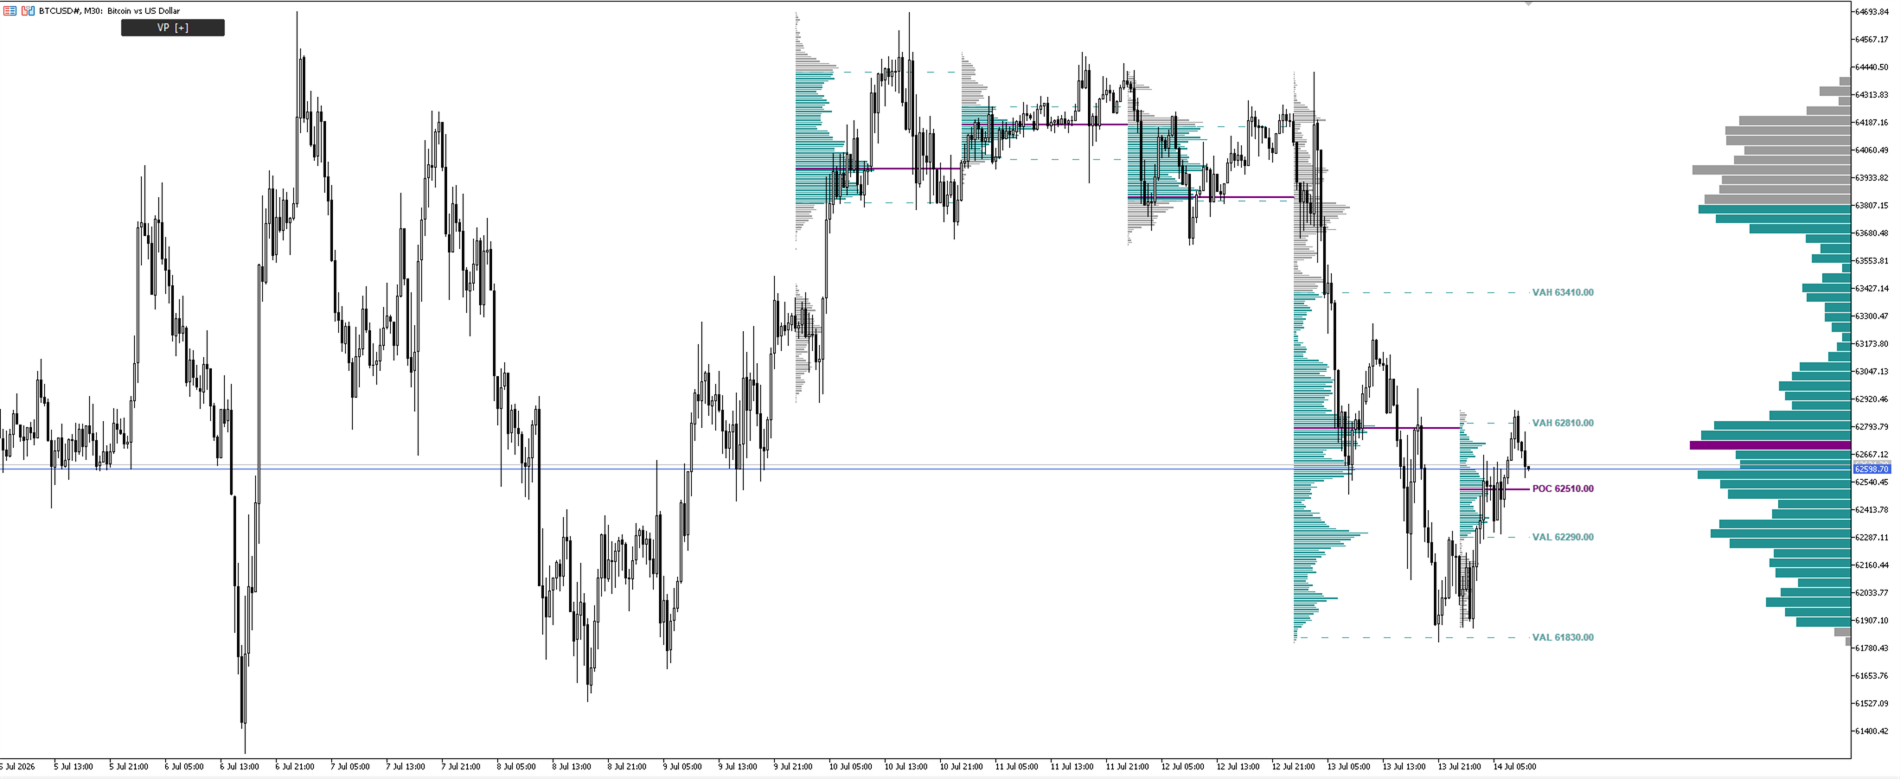
Volume Profile displays a per-price volume histogram for each trading session, built from real tick history — every tick lands on its exact price level, so you see where trading activity actually concentrated. POC and Value Area are calculated from volume. Designed to work standalone or side by side with the TPO Market Profile indicator.
Key Features:
- Real tick-data volume — exchange symbols (futures/stocks) use actual traded volume; forex/CFD symbols count one per quote tick at its exact price
- Automatic M1 fallback for sessions whose tick history is not downloaded yet, upgraded automatically once ticks arrive (Refresh forces it immediately)
- Mixed-feed protection — detects sparse trade ticks on quote-driven symbols and picks the denser tick stream, avoiding garbage profiles
- Daily, Weekly & Monthly profiles with up to 50 historical sessions (12 for Monthly)
- POC and Value Area (VAH/VAL) calculated from volume using the standard 70% rule
- Naked Levels — unvisited POC/VAH/VAL automatically extended to current price with price labels
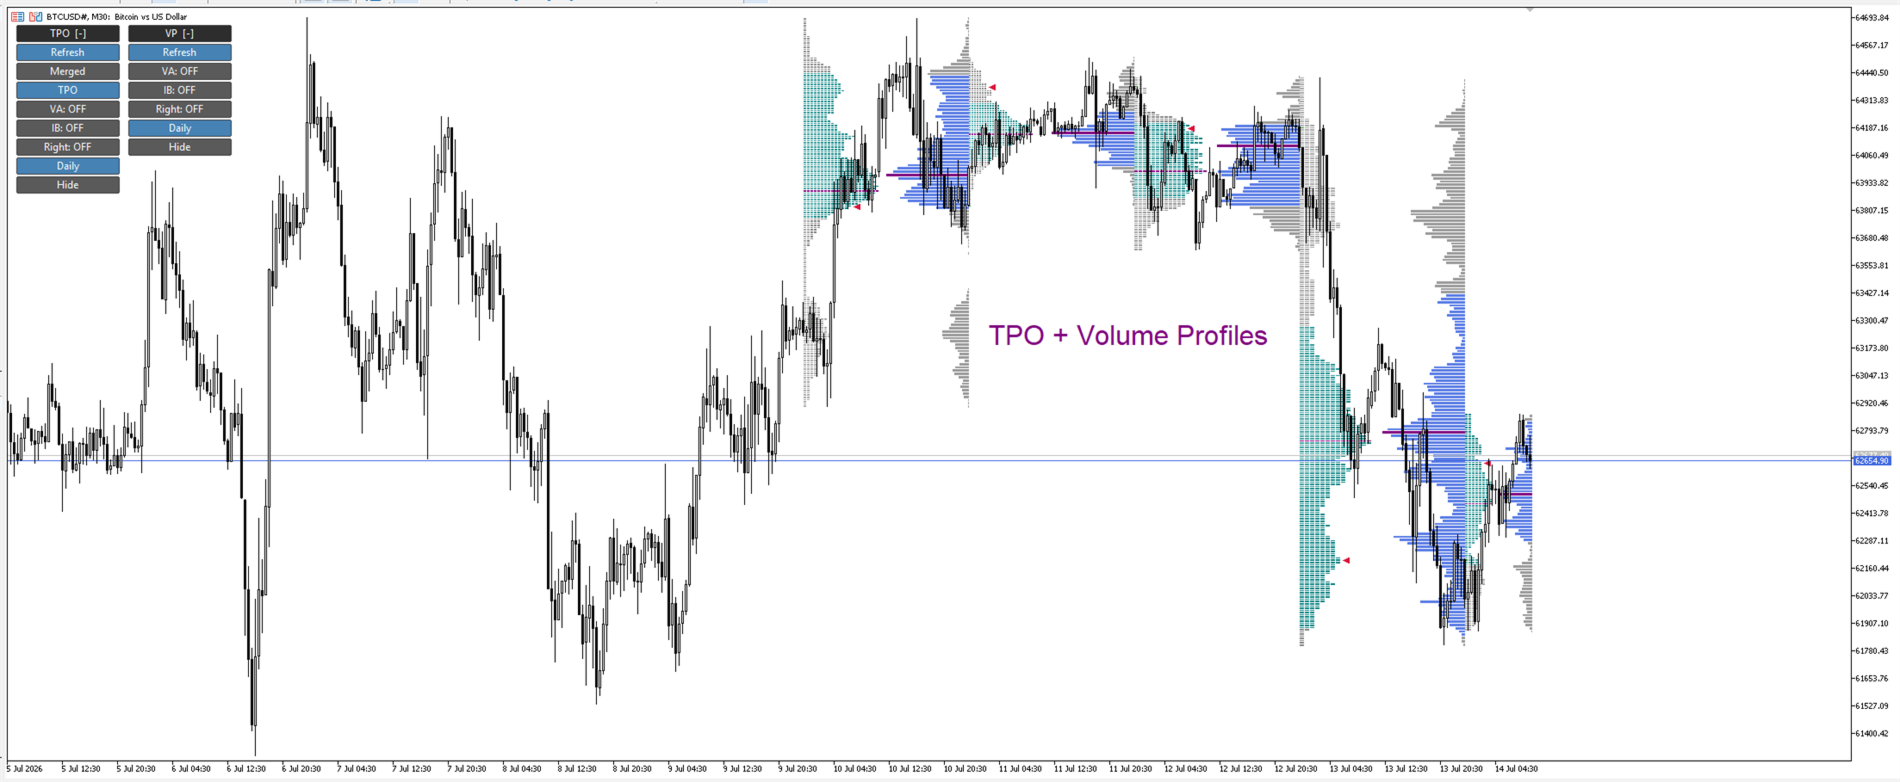
- Anchor Session Right — bars grow leftward from each session's right edge, made to pair with a left-anchored TPO profile on the same chart
- Right Profile mode — anchors current session histogram to the right edge of the chart
- The developing session scales with elapsed time — the histogram never draws into the future
- On-chart control panel — toggle everything with one click, including hiding the whole indicator
- Auto row sizing — optimal tick-per-row calculated from session range
Requirements: Broker tick history (usually kept for weeks to months; first access downloads in the background) — complete M1 history is used as fallback. Recommended timeframe: M15–H1. Enable Chart Shift when using Right Profile.
How to Use
- Attach the indicator to any chart (M15–H1 recommended) and keep Use Real Tick History enabled
- On first run some sessions may use the M1 approximation while tick history downloads — they upgrade automatically; press Refresh to force it
- Classic combo layout: attach TPO Market Profile with defaults (Width Percent 50), then attach Volume Profile with Anchor Bars to Session Right Edge = true and Width Percent 30–40. Keep the two Width Percent values at 100 or less combined so the profiles never overlap. Use Merged view for this layout — Split spans the full session and would run under the histogram
- Set History Count = 3–5 for intraday trading, 10–20 for swing trading
- Use Right Profile + Chart Shift to monitor only the current session
- With Weekly/Monthly period + tick data the current session rescans the whole period every M1 bar — switch to Daily or disable tick data if the chart feels heavy. Monthly history is capped at 12 sessions for the same reason
Control Panel
A compact button panel sits at the top of the chart (default X = 140, clear of the TPO panel at X = 10). Green = enabled, gray = disabled, blue = mode selector. To move it, set the Panel X / Panel Y inputs (pixels from the top-left corner).
| Button | Action |
|---|---|
| VP [-] / [+] | Collapse / expand the panel |
| Refresh | Force a full recalculation — also upgrades M1-fallback sessions to tick data immediately |
| VA: ON/OFF | Toggle VAH/VAL lines |
| IB: ON/OFF | Toggle Initial Balance lines |
| Right: ON/OFF | Toggle Right Profile mode |
| Daily / Weekly / Monthly | Cycle session period Daily → Weekly → Monthly (rebuilds profiles) |
| Hide / Show | Hide the entire indicator. Data keeps updating in the background, so Show restores it instantly |
Input Parameters
Profile Settings
| Parameter | Default | Description |
|---|---|---|
| Profile Period | Daily | Session period: Daily, Weekly or Monthly |
| History Count | 5 | Number of historical sessions to display (0–50). 0 = current session only |
| Width Percent | 50 | Histogram width as % of session space on chart (5–100) |
| Ticks Per Row | 0 (Auto) | Ticks per row. 0 = auto-calculated from Target Rows |
| Target Rows | 60 | Target row count in Auto mode (20–200) |
| Use Real Tick History | true | Build volume from real tick history; sessions without ticks fall back to M1 approximation |
| Right-Anchored Profile | false | Anchor current session histogram to chart right edge. Requires Chart Shift |
| Anchor Bars to Session Right Edge | false | Bars grow leftward from each session's right edge — pair with a left-anchored TPO. Ignored while Right-Anchored Profile is ON |
Lines
| Parameter | Default | Description |
|---|---|---|
| Show POC Line | false | Display the POC line |
| Show VA Lines | false | Display VAH and VAL lines |
| Show IB Range Lines | false | Display Initial Balance IBH/IBL lines (first 60 min on Daily, first trading day on Weekly/Monthly) |
| Extend Naked Lines | false | Extend unvisited POC/VAH/VAL to current time |
| Show Price Labels | false | Price labels at the end of extended lines (requires Extend Naked Lines) |
Colors
| Parameter | Default | Description |
|---|---|---|
| POC Color | Purple | Color for POC bars and line |
| Value Area Color | Teal | Color for bars inside Value Area |
| Outside VA Color | Gray | Color for bars outside Value Area |
| VAH Line Color | Teal | Value Area High line color |
| VAL Line Color | Teal | Value Area Low line color |
| IB Line Color | Green | Initial Balance line color |
Line Width & Style
| Parameter | Default | Description |
|---|---|---|
| POC Line Width | 2 | POC line thickness (1–5 pixels) |
| VA Line Width | 1 | VA line thickness (1–5 pixels) |
| IB Line Width | 1 | IB line thickness (1–5 pixels) |
| POC Line Style | Solid | POC line style (Solid / Dash / Dot) |
| VA Line Style | Dash | VA line style (Solid / Dash / Dot) |
| IB Line Style | Dash | IB line style (Solid / Dash / Dot) |
Control Panel
| Parameter | Default | Description |
|---|---|---|
| Show Control Panel | true | Show / hide the on-chart button panel |
| Panel X | 140 | Panel distance from the left edge (pixels) — default clears the TPO panel at X = 10 |
| Panel Y | 20 | Panel distance from the top edge (pixels) |










































Kullanıcı değerlendirmeye herhangi bir yorum bırakmadı