Gann Murphy
- Göstergeler
-
issam rahhal sabour
 Technical
analysis
Chartist
MT4 MT5 Programmer - Sürüm: 2.1
- Etkinleştirmeler: 5
Unlock the hidden geometric structure of the market.
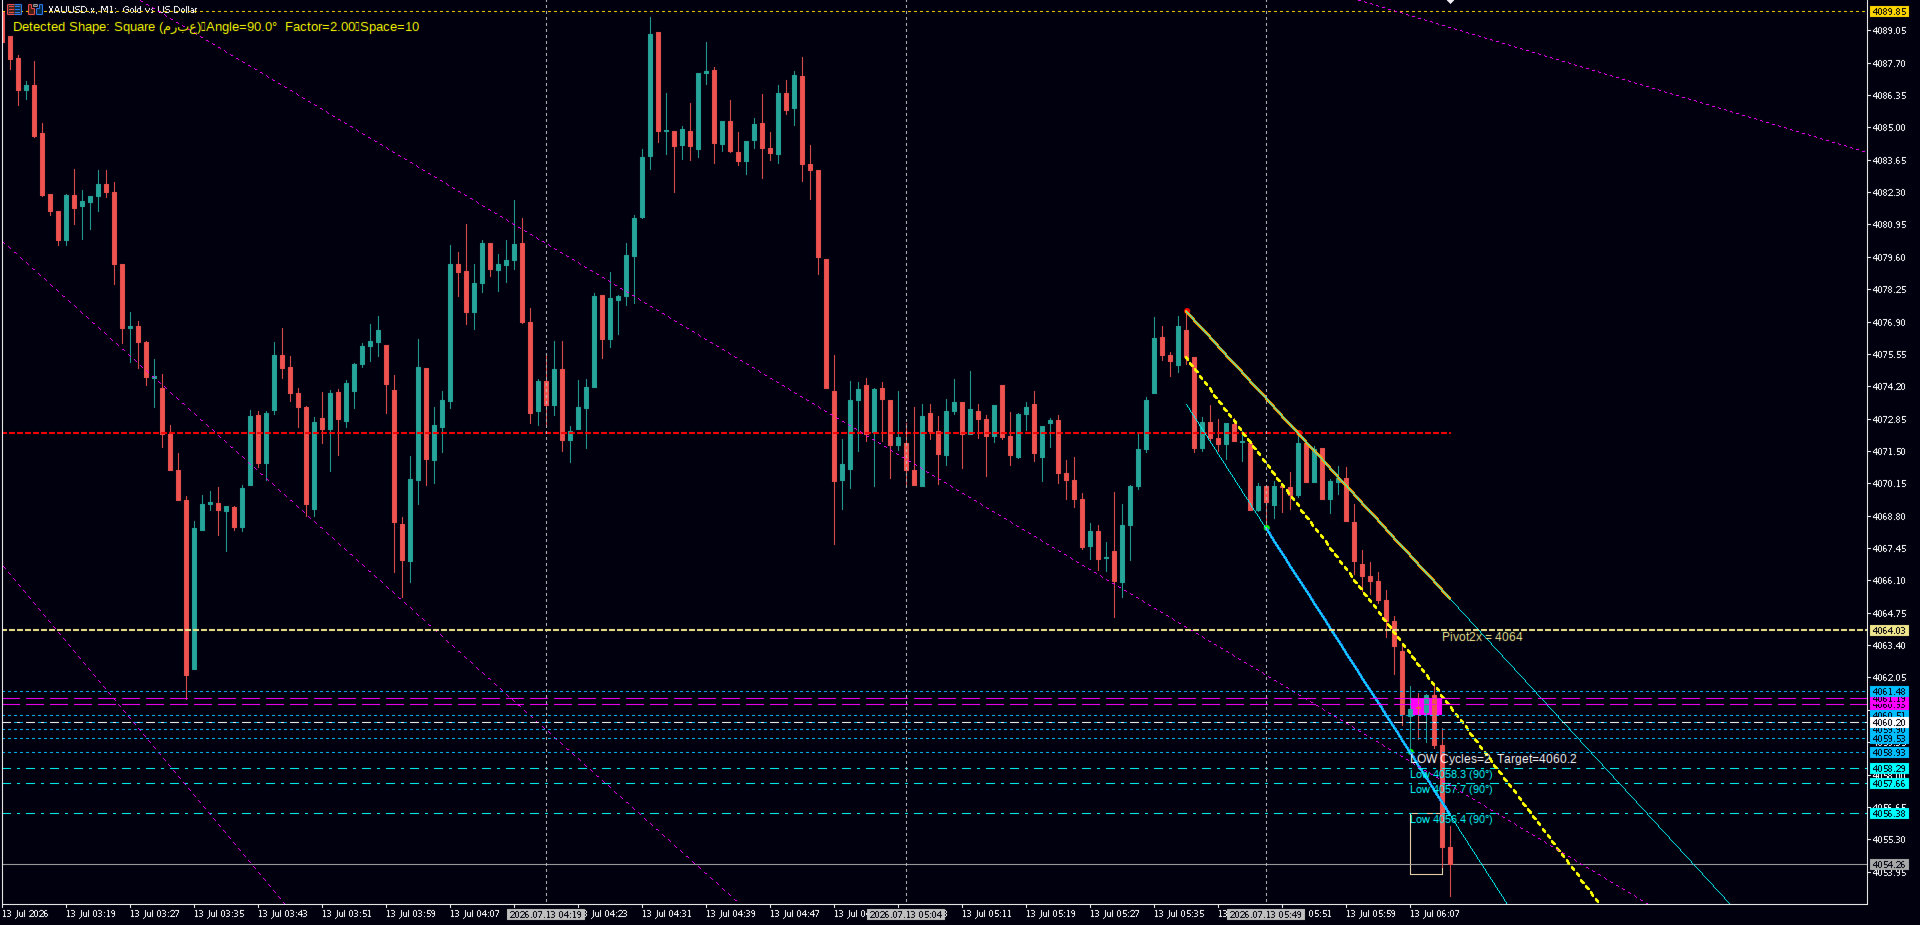
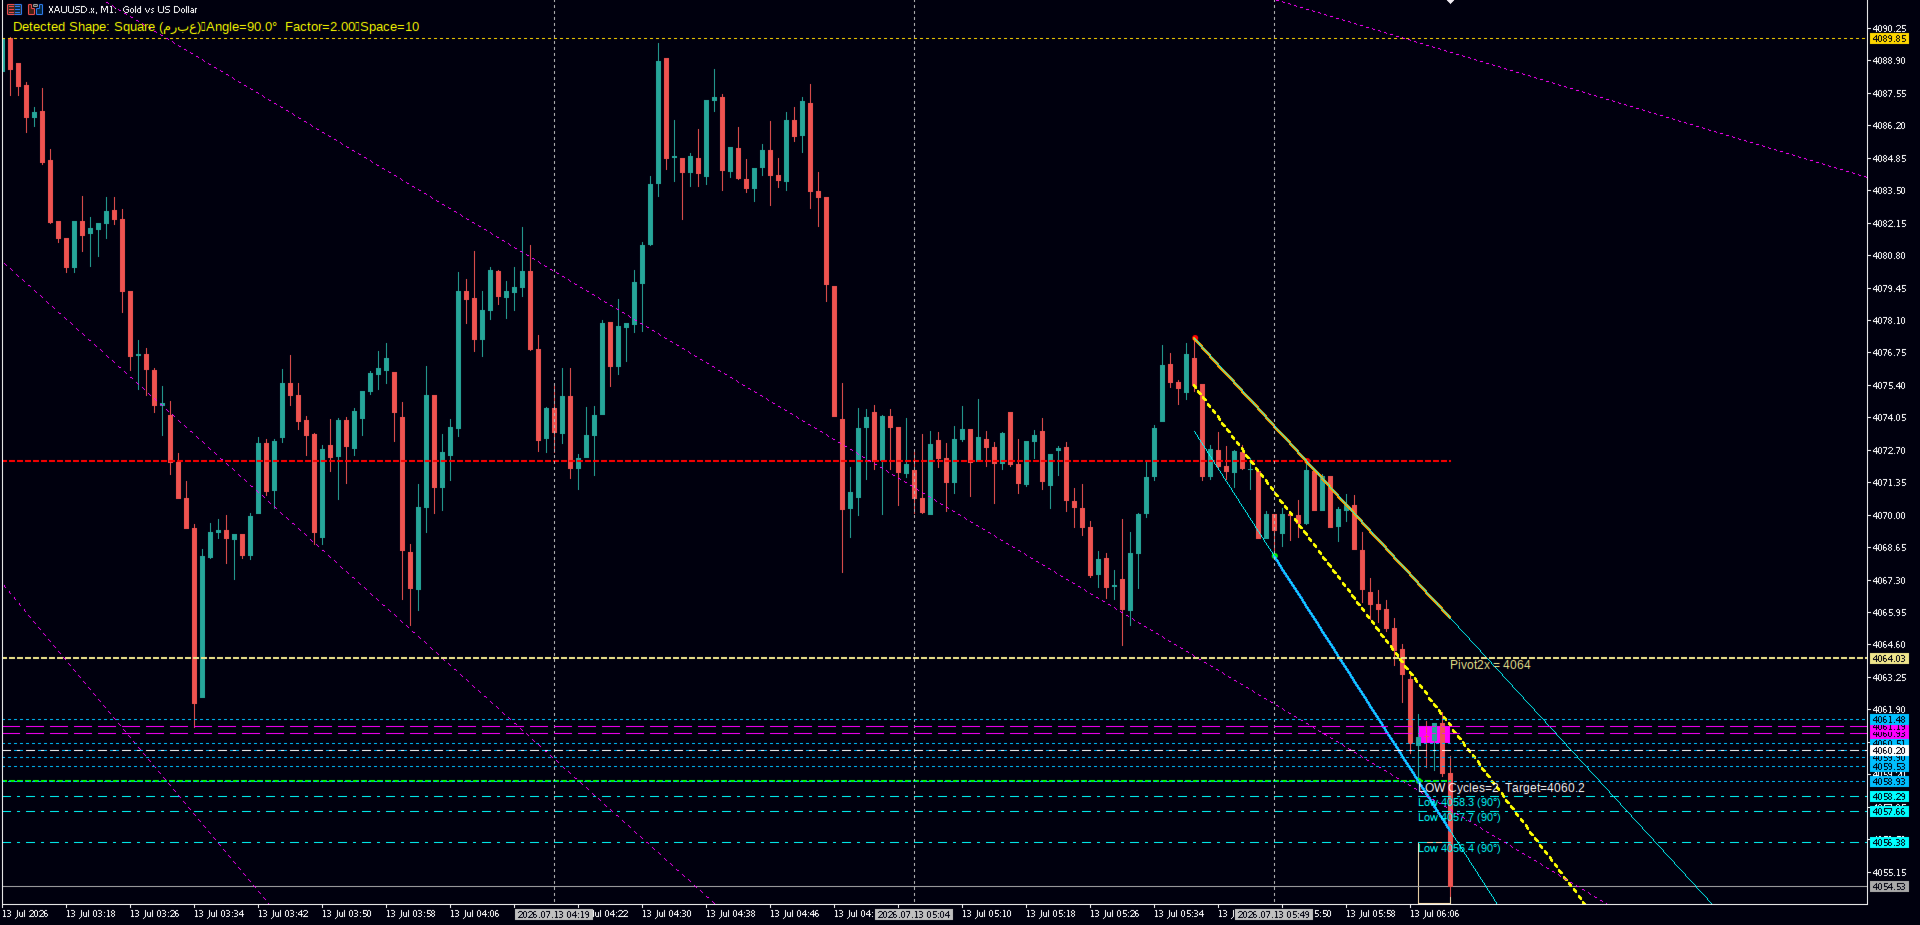
Murphy_Gann v2.01 is not just another Support/Resistance indicator. It is a comprehensive analytical engine that merges John Murphy’s classic pivot-based market structure with W.D. Gann’s advanced "Price-Time Angle" theory, Square of 9 mathematics, and sacred geometry.
Designed for traders who seek precision, this tool automatically detects market shapes (Squares, Triangles, Hexagons), calculates dynamic Gann angles from major pivots, and projects future price/time targets using the Square of 9 formula.
🚀 Key Features
1. Advanced Support & Resistance Engine
- Dynamic S/R Levels: Automatically identifies key support and resistance zones based on recent pivot clusters.
- Trend Lines: Draws automated trend lines connecting major highs and lows to visualize the immediate market direction.
- Pivot Points: Clearly marks Swing Highs and Lows with customizable arrows.
2. W.D. Gann Square of 9 Integration
- Geometric Price Angles: Calculates future price levels using the Square of 9 formula.
- Auto-Detect Shapes: The indicator scans price action to determine if the market is respecting a Square (90°), Triangle (120°), Hexagon (60°), or other geometric angles.
- Multi-Cycle Projections: Projects 1st, 2nd, and 3rd cycle targets based on your chosen angle.
3. Sacred Geometry & Visual Tools
- Hexagram (Star of David): Draws the interlocking triangle pattern between major highs and lows to identify equilibrium zones and potential reversal points.
- Gann Fan / Movement Triangles: Projects dynamic fan lines (1x1, 1x2, 2x1, etc.) from major pivots to map out acceleration and deceleration zones.
- Price Channels: Automatically draws 3-line channels (Upper, Middle, Lower) based on pivot extremes.
4. Time Cycle Analysis
- Vertical Time Lines: Projects future time targets based on the relationship between Price Angles and Time (Half, Quarter, Equal, or Double modes).
- Cross Squares: Highlights specific time/price boxes where reversals are statistically more likely.
- Digit Sum Cycle Count: Uses numerology-based digit sums to predict cycle endpoints (1, 2, 3, 4, 6, or 8 cycles).
5. Fibonacci & Harmonic Targets
- Angle-Based Fibs: Draws Fibonacci retracements from the Gann Angle level back to zero.
- Harmonic Levels: Highlights critical 0.786 and 0.886 harmonic levels often used in sophisticated reversal trading.
- Pivoting Target (2x): Calculates the "Pivoting Target" where price is expected to move twice the distance of the initial angle move.
⚙️ How It Works
The indicator operates in three phases:
- Structure Detection: It scans the last InpLookback bars to find significant Pivot Highs and Lows.
- Geometry Calculation: It converts prices to integers (removing decimals based on timeframe) and applies the Square of 9 formula to find geometric resonance levels.
- Visual Projection: It draws lines, shapes, and text labels directly on your chart to guide your entry and exit decisions.
📊 Input Parameters Explained
| Section | Parameter | Description |
|---|---|---|
| General | InpLookback | Number of bars to scan for Support/Resistance levels. |
| Gann Angles | InpGannAngle | Default angle (90=Square, 120=Triangle, 60=Hexagon). Set to 0 for Auto-Detect. |
| Gann Angles | InpAutoDetectShape | If true, the indicator finds which geometric shape the market is currently respecting. |
| Hexagram | InpShowHexagram | Draws the Star of David pattern between major highs and lows. |
| Time Cycles | InpTimeCycleMode | Defines how time relates to price angles (Half, Quarter, Equal, Double). |
| Misc | InpAutoSpace | Automatically adjusts the "Space" value based on the current timeframe (M1, H1, D1, etc.) for accurate Gann calculations. |
💡 Trading Strategies
1. The Geometric Reversal
Wait for price to touch a Gann Angle Line (e.g., the 90° Square line) that coincides with a Support/Resistance level. Look for confirmation via the Hexagram center line or a Cross Square zone.
2. Time & Price Convergence
When a vertical Time Cycle Line intersects with a horizontal Gann Price Level, a significant reversal or breakout is highly probable. This is the core of Gann's "Square of Price and Time."
3. Trend Channel Breakout
Use the Price Channels to identify the trend. Enter long when price bounces off the lower channel line and the Movement Triangle supports upward momentum.
🛡️ License & Protection
This product includes a robust licensing system to protect your investment:
- Trial Mode: 14-day free trial to test all features on your live account.
- Hardware Lock: Licenses are locked to your terminal's hardware ID for security.
- Rental & Permanent Options: Choose between 1 Month, 3 Months, 6 Months, 1 Year, or Permanent licenses.
- Multi-Account Support: Licenses can be activated on up to 5 accounts (depending on license type).
Note: To activate a purchased license, simply enter the provided Key into the InpLicenseKey input field.
❓ FAQ
Q: Does this work on all timeframes?
A: Yes! The InpAutoSpace feature automatically adjusts the calculation scale for M1 through MN1 charts.
Q: What is the "Space" parameter?
A: In Gann theory, "Space" is the relationship between price units and time units. This indicator calculates it automatically based on WD Gann's original tables for each timeframe.
Ready to see the market through the eyes of W.D. Gann and John Murphy?
Download Murphy_Gann today and transform your chart analysis.
Disclaimer: Trading involves risk. This indicator is a technical analysis tool and does not guarantee profits. Always use proper risk management.
```