YKL Multiple Regression
- Göstergeler
-
Ygor Keller Luccas
 YKL Robots é uma empresa de automação de estratégias de trading para MT5.
 - Sürüm: 1.0
Indicador Multiple Regression
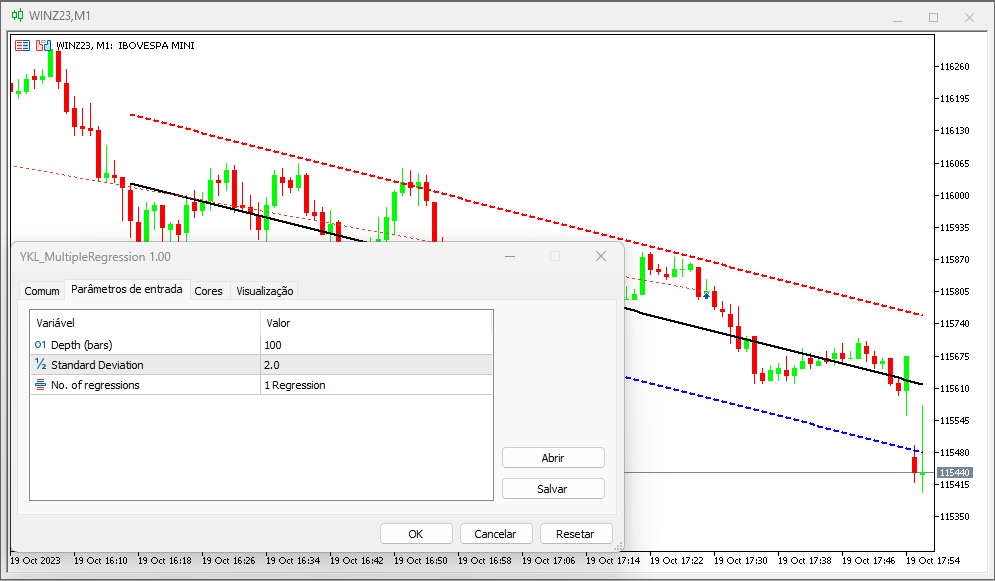
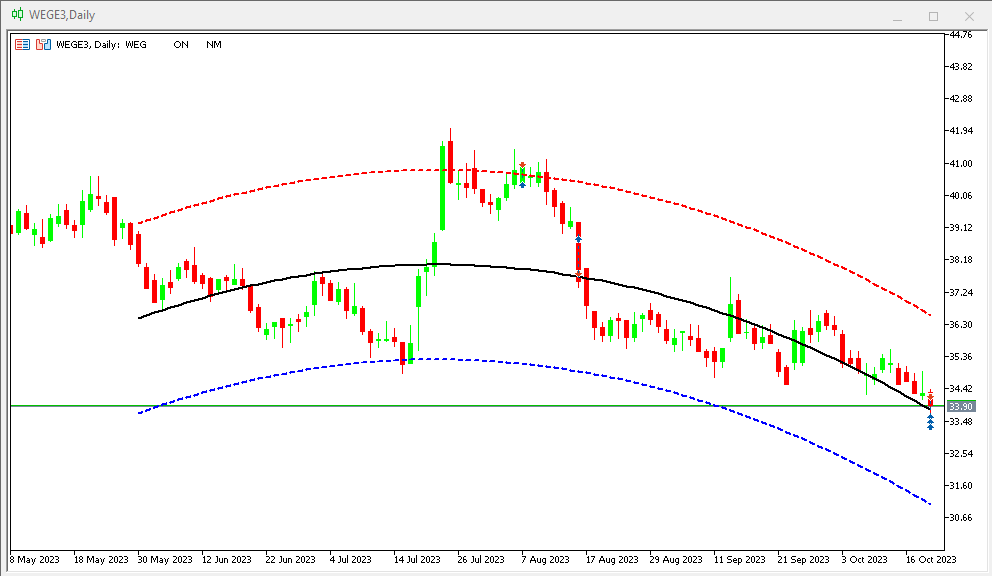
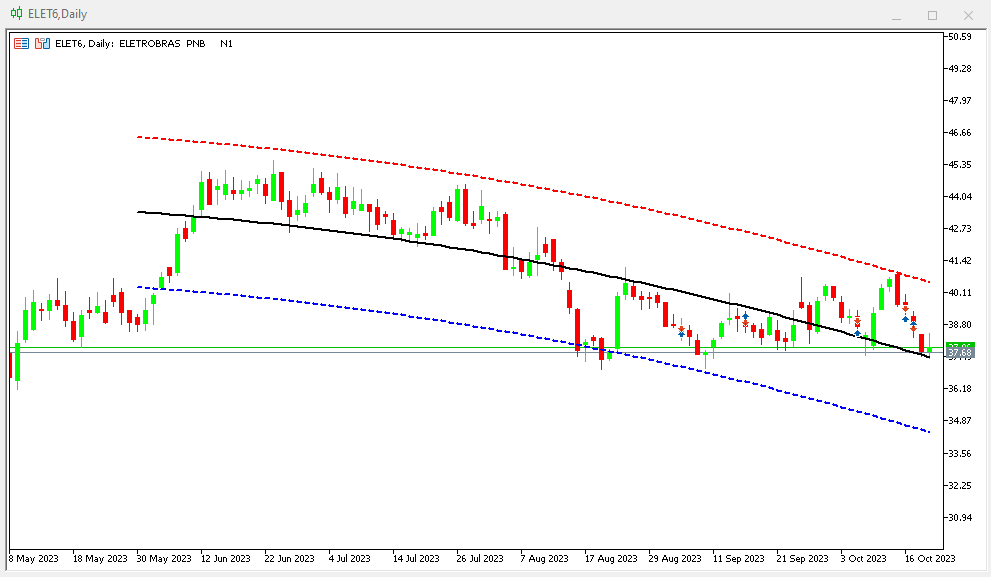
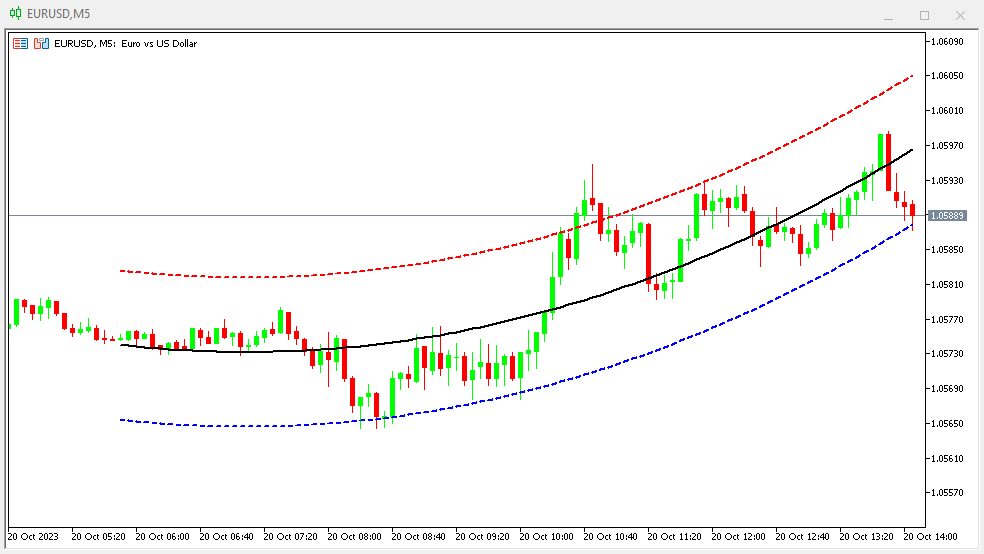
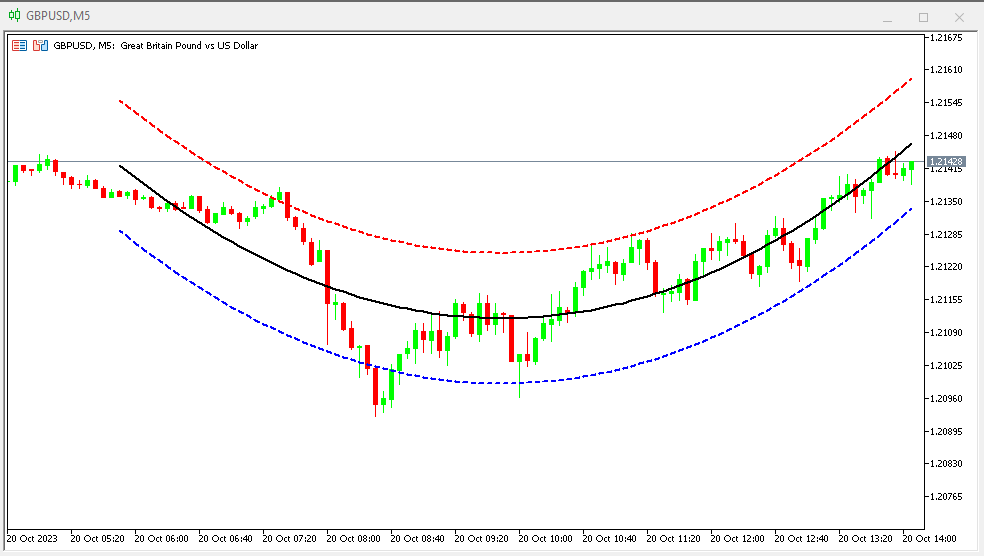
Indicador faz o plot da Curva de Retorno e dos canais superior e inferior de uma regressão para os preços de fechamento do ativo do gráfico. A Curva de Retorno é a linha central do indicador e representa a região de equilíbrio do preço entre vendedores e compradores. Nesse indicador o usuário escolhe o tipo da regressão podendo ser de 3 tipos: primeiro grau, segundo grau ou terceiro grau.
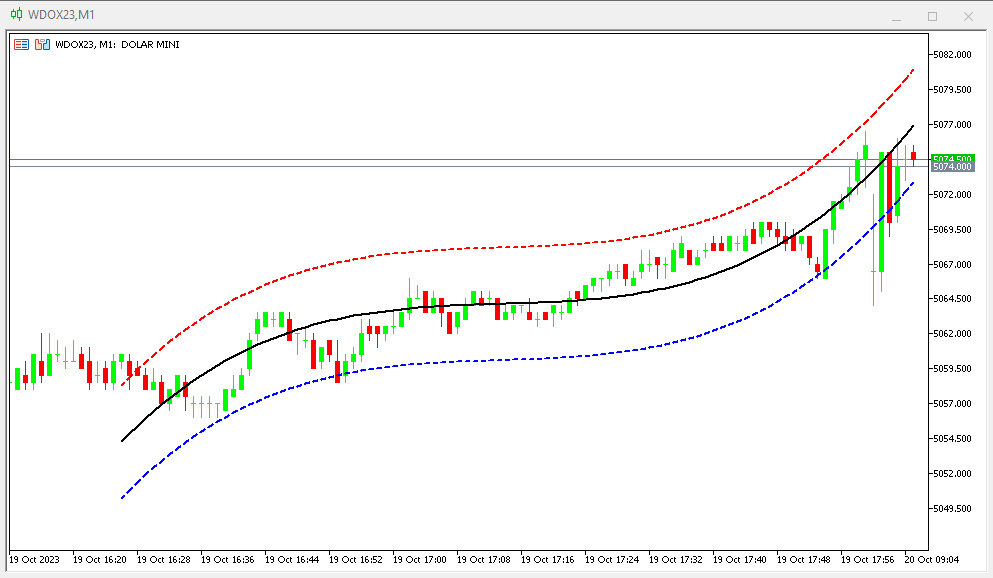
Os plots do indicador são:
- Linha central – cor padrão preta;
- Linha superior – cor padrão vermelha;
- Linha inferior – cor padrão azul.
Inputs do indicador:
- Barras de regressão: número de barras para que seja feita a regressão.
- Desvio padrão: é o desvio considerado nos cálculos da regressão.
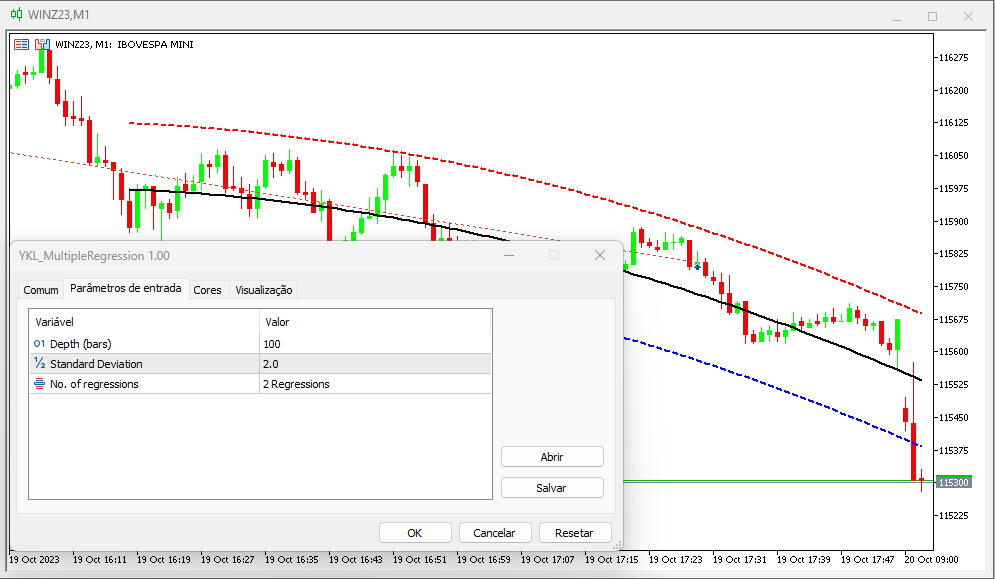
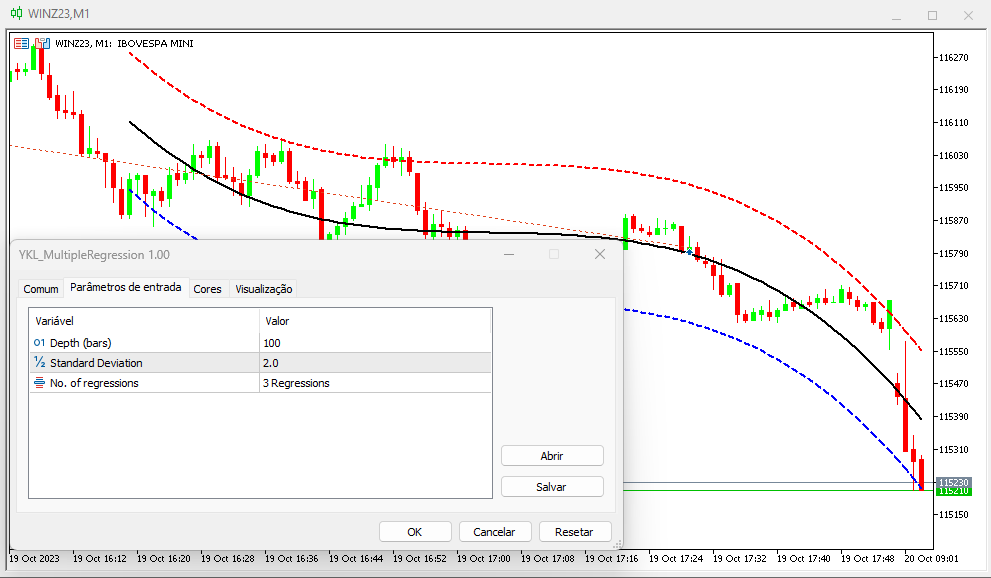
- Tipo da regressão: usuário pode escolher plotar uma regressão de primeiro grau (“1 Regression”), segundo grau (“2 Regressions”) ou terceiro grau (“3 Regressions”).
Resumo dos buffers do indicador:
- Buffer 0 - Linha Central
- Buffer 1 - Linha Superior
- Buffer 2 – Linha Inferior
Indicador é compatível com qualquer ativo da Bolsa Brasileira B3, BMF e Forex.

good