Balance Graph Dashboard

Brief Description
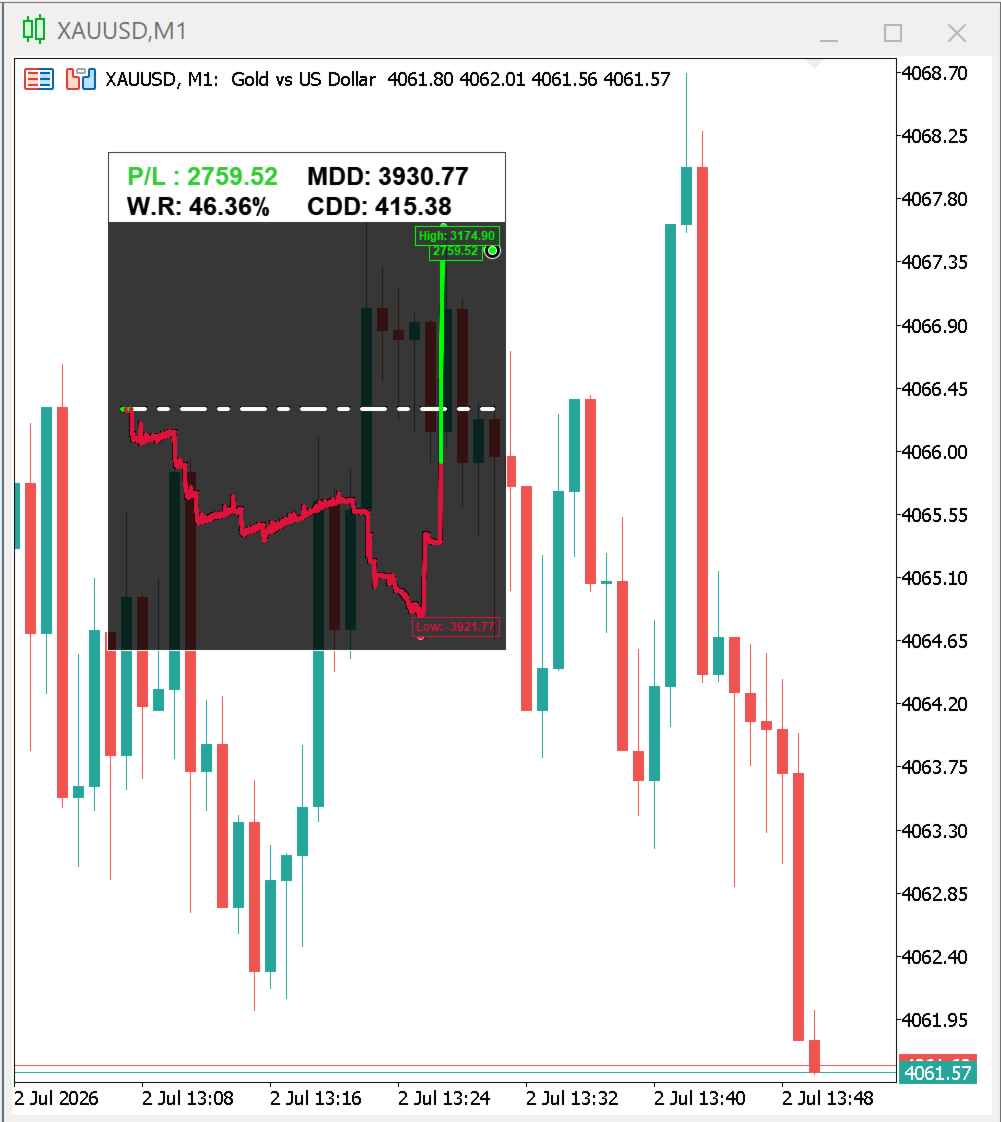
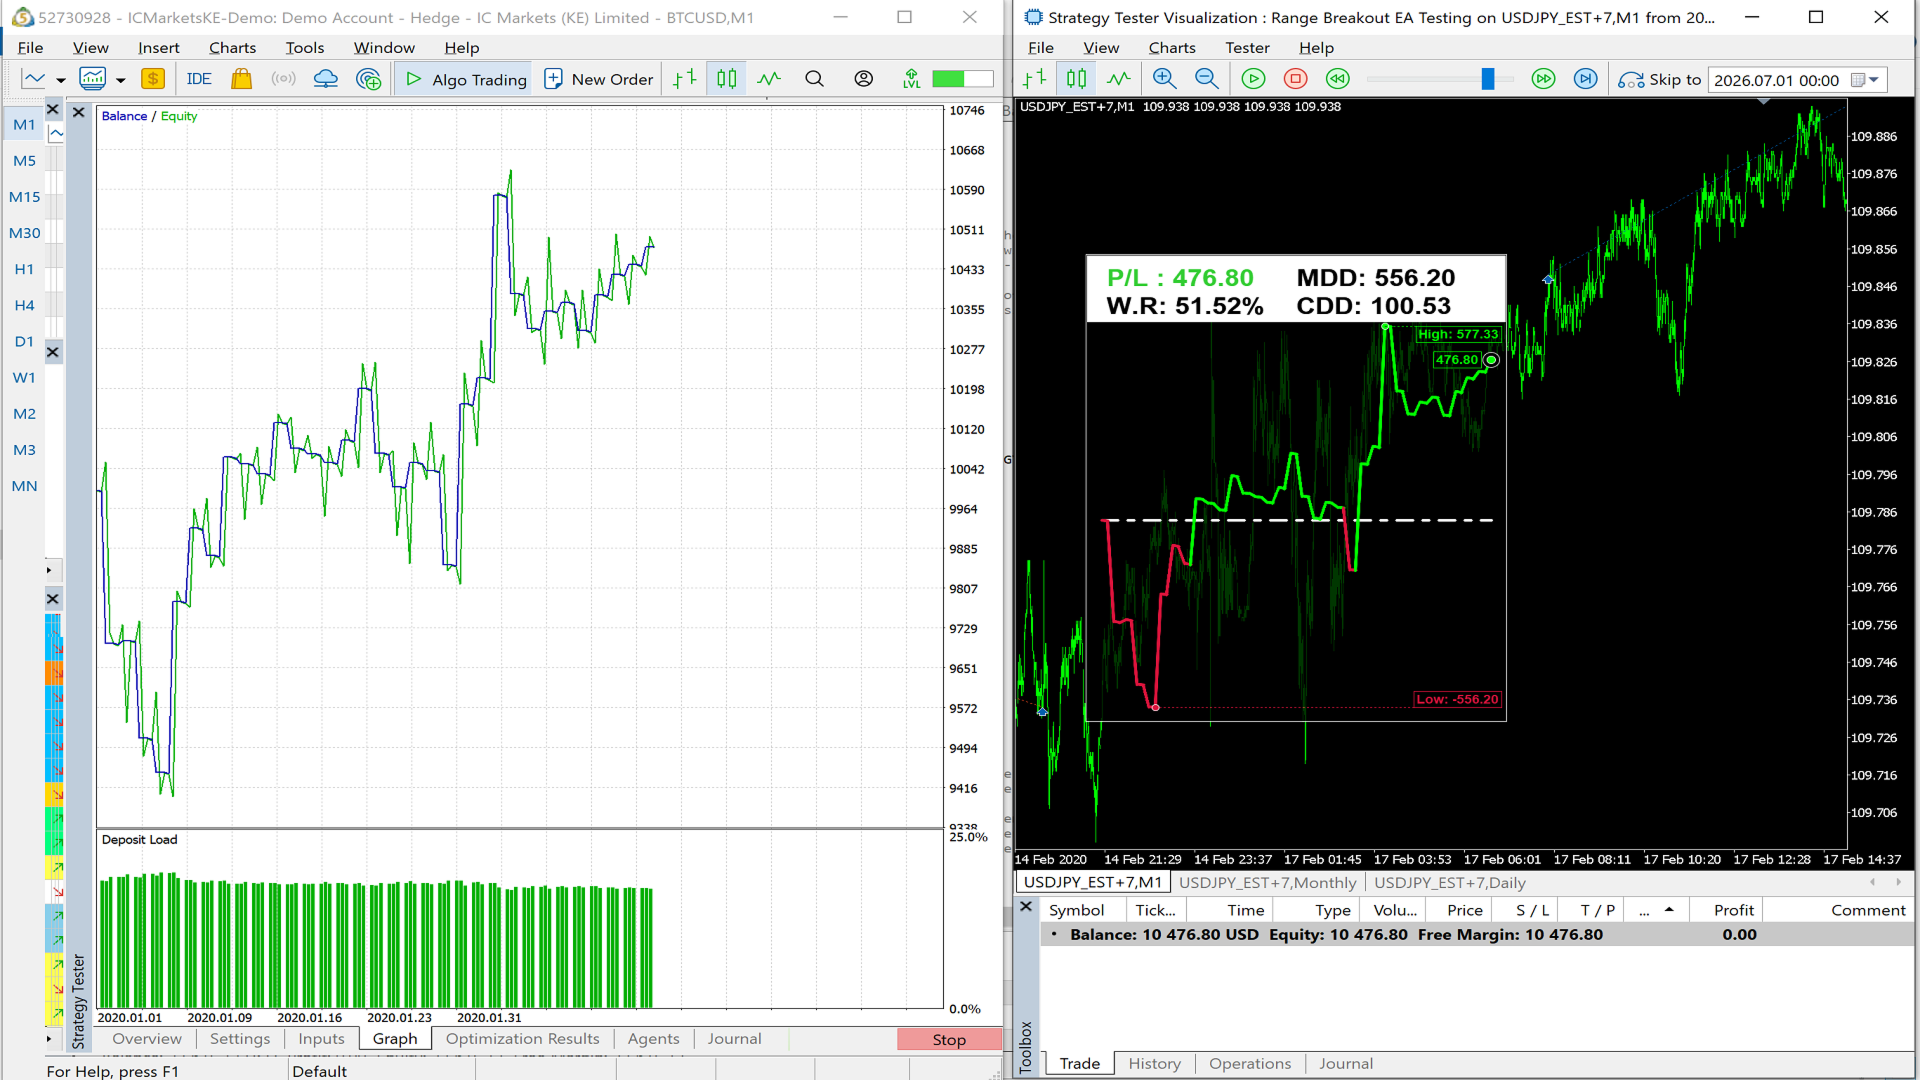
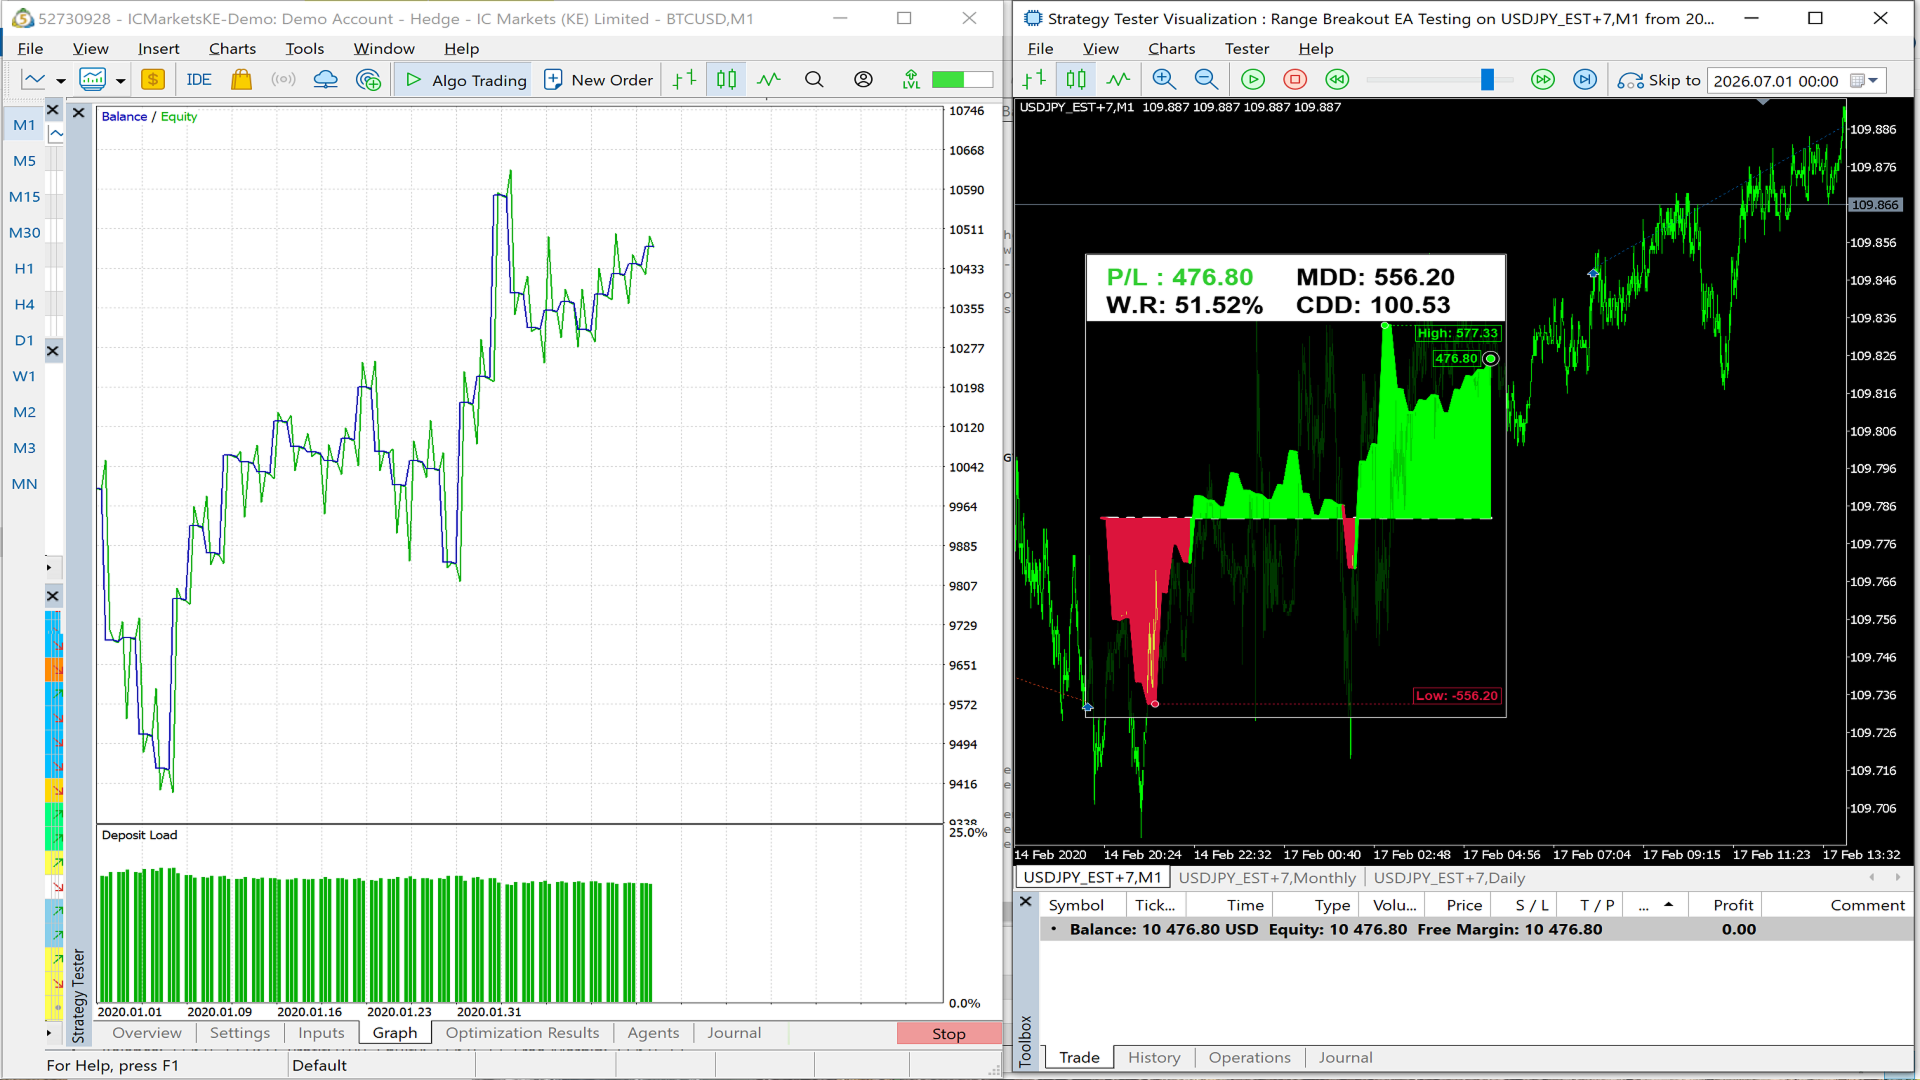
The Balance Curve Dashboard is a sophisticated visual tool that transforms your trading history into an interactive, high-performance equity curve display directly on your MT5 chart. Unlike traditional balance lines that draw on the chart as standard objects, this indicator uses a custom Canvas-based rendering engine to create a crisp, anti-aliased, and fully customizable visual representation of your portfolio's performance.

Key Features:📊 Interactive Visual Dashboard

· Full-color equity curve with profit/loss· Real-time P/L, Win Rate, Max Drawdown, and Current Drawdown metrics· High/Low markers with labeled value boxes
· Current balance marker with floating value display· Gradient fill option for enhanced visual appeal


🎯 Flexible Filtering
· Portfolio View: Track all trades across all symbols
· Symbol Only: Focus on a specific trading symbol
· Strategy Only: Filter by Magic Number

· Symbol + Strategy: Combine both filters for granular analysis


🎨 Fully Customizable

· Adjustable canvas size via Canvas Factor (1x to 2x)
· Customizable colors for profit/loss lines, background, text, borders
· Opacity control for semi-transparent overlays

· Font size controls for labels and metrics


🖱️Interactive

· Drag-and-drop positioning anywhere on the chart

· Chart remains fully functional (mouse scroll enabled while not dragging)


Who Is This For?
· Manual Traders: Visualize your account performance evolution over any period (daily, weekly, monthly, or entire history)
· EA Developers: Use this as a visual front-end for strategy analysis and performance monitoring
· Quant Traders: Quickly assess strategy rates at a glance


INPUTS:

Here is every input explained in full detail:

CanvasFactor — controls the physical pixel size of the entire canvas window. It's a multiplier applied to the base dimensions of 400×500 pixels. At 1 (default) the canvas is exactly 400px wide by 500px tall. At 2 it doubles to 800×1000px — every element inside scales with it: padding, font sizes, marker radii, line

thickness. Values between 1 and 2 (like 1.5) produce intermediate sizes. Going below 1 makes the canvas smaller than the base size, and going above 2makes it very large. Everything throughout, so nothing gets cut off or misaligned when you change this — it all resizes proportionally.


CurveType — this is the most important input. It controls which deals from your account history are included in the balance curve, P/L, win rate, drawdown, and all other metrics. Four options:

PORTFOLIO — includes every single deal from every symbol and every EA/strategy in your account history, regardless of what symbol the chart is on or what magic number any EA used.

If you have trades on EURUSD, GBPUSD, gold, and indices all mixed together, they all count. This shows your overall account performance as a whole.

SYMBOL_ONLY — filters to only deals where DEAL_SYMBOL matches the symbol the indicator is currently attached to (_Symbol). So if you attach the indicator to a EURUSD chart, only everything else is ignored entirely. The magic number of the EA that placed the trade is irrelevant here; any EA's EURUSD trades count. Useful for evaluating how a particular instrument has performed across all strategies trading it.

STRATEGY_ONLY — filters to only deals where DEAL_MAGIC matches strtMagic_No, regardless

of which symbol those trades were on. So if your EA uses magic number 101 and trades both EURUSD and GBPUSD, both show up. Trades from other EAs with different magic numbers are excluded even if they're on the same symbol. Useful for seeing the isolated performance of one specific EA across all the pairs it trades.

SYMBOL_SPECIFIC_STRATEGY — the most restrictive filter: a deal only counts if BOTH DEAL_SYMBOL == _Symbol AND DEAL_MAGIC == strtMagic_No. So it shows only trades placed by a specific EA (identified by magic number) on Everything else — same EA on a different symbol, different EA on the same symbol — is

excluded. Useful when one EA trades multiple pairs and you want to isolate its performance on just one of them.


strtMagic_No — the magic number used as the filter value for STRATEGY_ONLY and SYMBOL_SPECIFIC_STRATEGY curve types. Has no effect at all when CurveType is PORTFOLIO or SYMBOL_ONLY. Set this to match the magic number your EA assigns to its orders via trade.SetExpertMagicNumber() or OrderSend(). Default is 101. If your EA uses a different magic number and you leave this at 101, those two filtered curve types will show an empty curve since no deals will match.


BalanceCurvePeriod — works together with BalanceCurveFactor to define the history window start time. It's a timeframe selector (M1,H1, D1, W1, MN1, etc.) that defines the "unit of for stepping backward through history. At the default PERIOD_MN1 (monthly), one unit of BalanceCurveFactor represents one calendar
month. Changing this to PERIOD_W1 makes one unit equal one week, PERIOD_D1 makes it one
day, and so on. Has no effect when BalanceCurveFactor is negative (entire history

mode).


BalanceCurveFactor — controls how far back in time the history window starts. The exact formula in the code is: start = iTime(_Symbol, BalanceCurvePeriod, 0) - PeriodSeconds(BalanceCurvePeriod) * BalanceCurveFactor. Breaking that down: iTime(_Symbol, BalanceCurvePeriod, 0) is the open time of the current period's bar (e.g. the start of this month if BalanceCurvePeriod = PERIOD_MN1). PeriodSeconds(BalanceCurvePeriod) * BalanceCurveFactor subtracts that many period- Any negative value (default -1) — bypasses this formula entirely and calls HistorySelect(0, TimeCurrent()) instead, which means the entire available account history from the very beginning. This is the "show everything" mode. 0 — start is the open of the current period with no subtraction, so only deals from the current period onward are shown (e.g. this month only if on MN1). 1 — goes back one period before the current one (e.g. last month + this month). 3 on PERIOD_MN1 — shows the last 3 months. On PERIOD_W1 — last 3 weeks. On PERIOD_D1 — last 3 days. So BalanceCurvePeriod is the unit and BalanceCurveFactor is how many of those units to go back.

CanvasOpacity — controls the transparency of the canvas background and certain overlay elements. It's the alpha value passed to label box backgrounds on the High/Low markers, and the current-balance label box. Range is 0 (fully transparent, canvas invisible) to 255 (fully opaque, solid). Default is 200, which is slightly transparent — at this level you can faintly see the chart price bars behind the canvas if they're close to the canvas edge. Going lower makes the background more see-through; going to 255 makes it a solid opaque block.


LineFontSize — despite the name, this is actually the line thickness in pixels for the balance curve

line itself, passed directly as the width parameter to ExtCanvas.LineThick(). Nothing to do with fonts. Default is 5px. Higher values make the curve line thicker and more prominent; lower values make it thinner. At 1 it's a single- pixel line. Also applies to the start-balance dashed horizontal line.


TextFontSize — controls the font size of the four metric labels in the header band (P/L, Win Rate, so it stays proportional when you resize the canvas. Default is 30, which at CanvasFactor=1 renders as 30pt. The marker labels (current balance tag, High/Low tags) use their own hardcoded sizes scaled independently and are not affected by this input.


InpEnableGradient — toggles the shaded area fill between the balance curve and the zero baseline on or off. When true (default), a semi- transparent colored fill is drawn beneath the curve above the baseline (green-tinted when profitable, red-tinted when in loss) by calling DrawVerticalGradientFill() column by column. When false, only the line itself is drawn with no fill underneath — cleaner look, and slightly faster

to render since the entire gradient fill loop is skipped entirely.


InpLineProfitColor — the color of the balance curve line and its gradient fill for any segment where the cumulative P/L is zero or above (i.e. dot, line, and label box border when the curve is in profit. Default is clrLime (bright green).


InpLineLossColor — the color of the balance curve line and gradient fill for any segment where the cumulative P/L is negative (below the zero start line). Also colors the current-balance marker, and the Low marker dot, line, and label box border when in drawdown. Default is clrCrimson (dark red). The curve can switch between these two colors mid-chart wherever the running P/L crosses zero in either direction.


InpBgColor — the fill color of the canvas background, applied via ExtCanvas.Erase() at the start of every redraw. Also used as the fill color inside the High/Low marker label boxes and the current-balance label box — this is what creates the "background behind the text" effect that makes the labels readable over the curve. Default is clrBlack.


InpTxtColor — the color used for the Win Rate drawdown (Max DD, Current DD) text labels in the header. The P/L text uses its own color logic (green or red based on whether P/L is positive or negative) so InpTxtColor doesn't apply to it.


InpBordLineColor — used in three places: the rectangular border drawn around the entire canvas perimeter, the filled header rectangle at the top of the canvas, and the anti-aliased outline rings on the current-balance marker circles (CircleAA() calls). Default is clrWhite. Changing this changes both the outer canvas frame and the marker ring outline simultaneously.
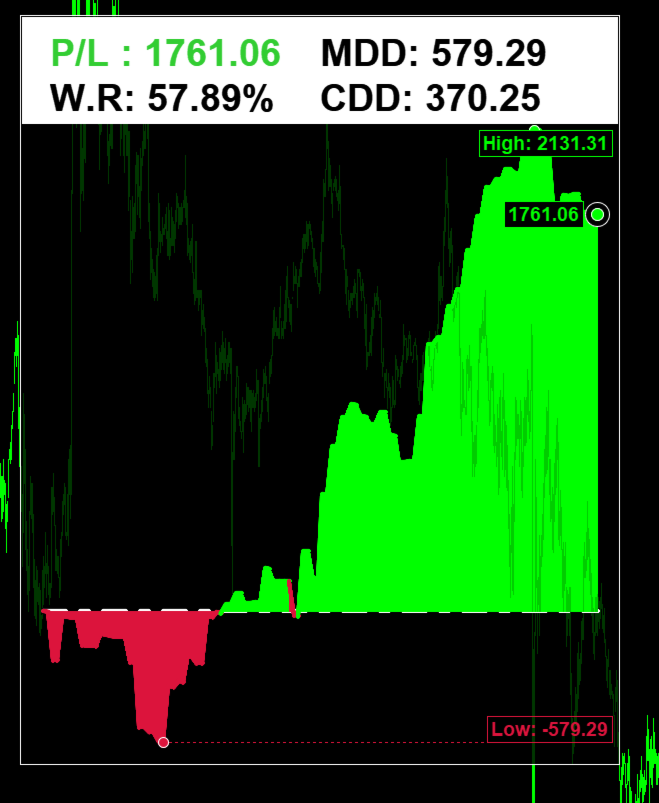
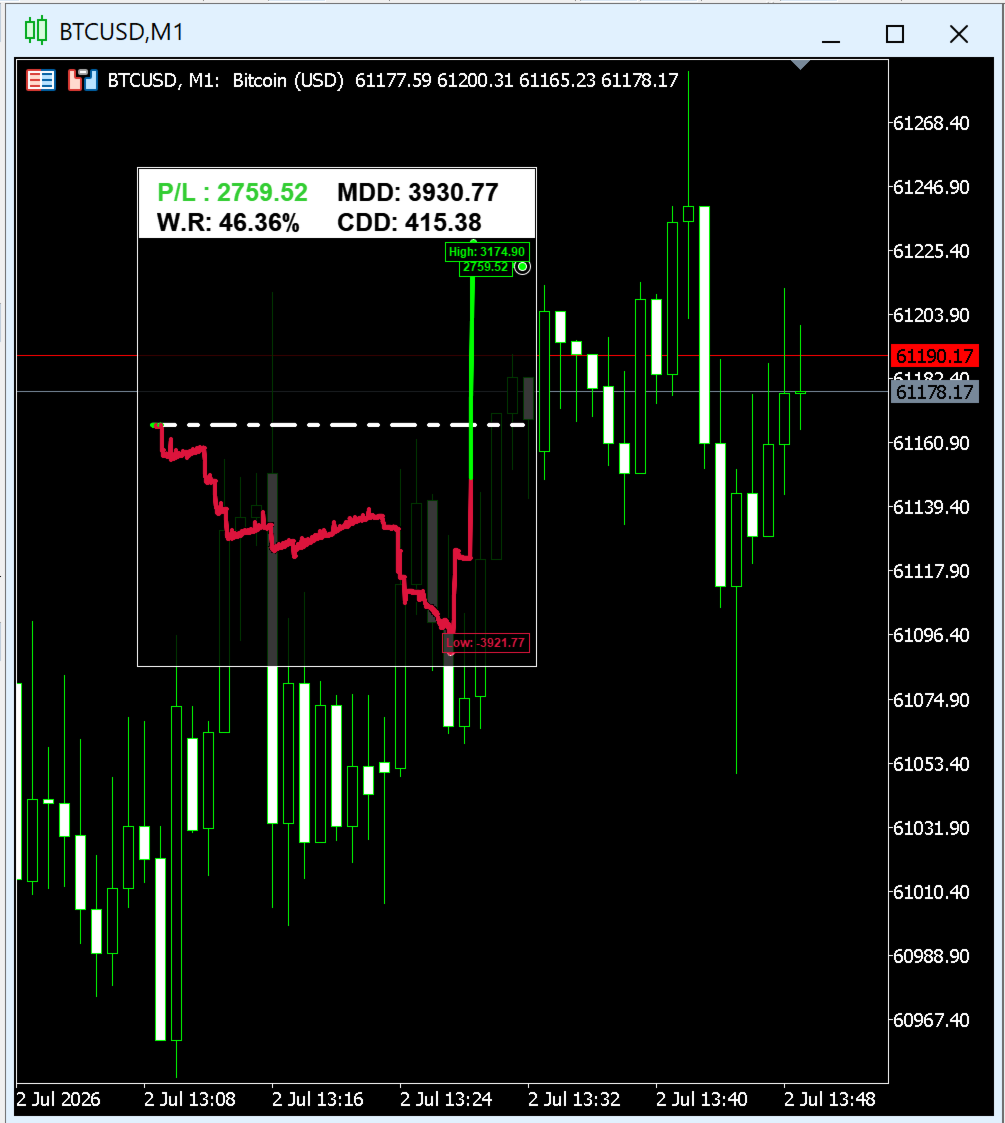
InpStrtLineColor — the color of the dashed horizontal line drawn across the canvas at the zero P/L level (the starting balance baseline). This line is what visually separates profit so it's a dash-dot pattern rather than solid. Default is clrWhite. This is completely independent of InpBordLineColor — you can make the border one color and the baseline another.
추천 제품
표시기는 현재 시세를 작성하여 과거 시세와 비교할 수 있으며 이를 바탕으로 가격 변동을 예측합니다. 표시기에는 원하는 날짜로 빠르게 이동할 수 있는 텍스트 필드가 있습니다. 옵션: 기호 - 표시기가 표시할 기호 선택. SymbolPeriod - 지표가 데이터를 가져올 기간 선택. IndicatorColor - 표시기 색상. HorisontalShift - 지시자가 그린 따옴표를 지정된 막대 수만큼 이동합니다. Inverse - true는 인용 부호를 반대로, false - 원래 보기를 반전합니다. ChartVerticalShiftStep - 차트를 수직으로 이동합니다(키보드의 위/아래 화살표). 다음은 날짜를 입력할 수 있는 텍스트 필드의 설정으로, '엔터'를 누르면 즉시 이동할 수 있습니다.
Atlantis Pro
Mohammed Jebbar
Atlantis Pro Indicator — 틱 단위 실시간 분석과 포트폴리오 운용의 결합 Atlantis Pro Indicator는 실시간 틱 데이터를 기반으로 핵심 가격대와 고확률 반전 구간을 높은 정밀도로 식별할 수 있는 고급 다기능 인디케이터입니다. 시장의 모든 틱 변화를 연속으로 분석하여 매수·매도 압력이 집중되는 순간을 즉시 포착하고, 차트에 선명한 Buy/Sell 화살표를 바로 표시합니다 — 기본값으로 항상 표시되어 즉시 대응 가능합니다. Atlantis Pro는 모든 자산과 모든 시간대 에서 완벽하게 작동하며, 외환, 주식, 상품, 지수, 암호화폐 등 다양한 시장에서 활용할 수 있습니다. 특히 여러 종목을 동시에 모니터링 할 수 있어 최고의 진입·청산 신호를 동시에 포착하고, 분산된 포트폴리오 전략 으로 리스크를 낮추고 수익의 안정성을 높일 수 있습니다. Atlantis Pro와 함께라면 하나의 차트나 단일 종목에 얽매일 필요가 없습니다. 연관성 있는 시장과 무관한 시
BoxChart MT5
Evgeny Shevtsov
5 (7)
The market is unfair if only because 10% of participants manage 90% of funds. An ordinary trader has slim changes to stand against these "vultures". This problem can be solved. You just need to be among these 10%, learn to predict their intentions and move with them. Volume is the only preemptive factor that faultlessly works on any timeframe and symbol. First, the volume appears and is accumulated, and only then the price moves. The price moves from one volume to another. Areas of volume accumu
Blahtech Supply Demand MT5
Blahtech Limited
4.54 (13)
Was: $299  Now: $99  Supply Demand uses previous price action to identify potential imbalances between buyers and sellers. The key is to identify the better odds zones, not just the untouched ones. Blahtech Supply Demand indicator delivers functionality previously unavailable on any trading platform. This 4-in-1 indicator not only highlights the higher probability zones using a multi-criteria strength engine, but also combines it with multi-timeframe trend analysis, previously confirmed swings a
Wedge Pattern MT5
Sathit Sukhirun
Korean 이 보조지표는 차트 패턴 거래를 즐기는 트레이더를 위한 고급 차트 분석 비서 역할을 합니다. 시각적 분석의 부담을 줄이고 수익 창출의 정확성을 높이도록 설계되었습니다. 실제 사용 관점에서 본 이 보조지표의 주요 장점과 특징입니다: 1. 자동 패턴 감지 (Automated Pattern Detection) 시간 절약 및 편향(Bias) 감소: 수동으로 추세선을 그릴 필요가 없습니다. 인디케이터가 가격 스윙(Pivot High/Low)을 검색하고 가격 구조가 조건에 부합할 때 라이징 웨지(Rising Wedge, 상승 쐐기형) 및 폴링 웨지(Falling Wedge, 하락 쐐기형) 구조를 자동으로 그립니다. 모든 상황 포괄: 패턴이 형성되는 중, 브레이크아웃(돌파), 심지어 실패한 패턴까지 감지할 수 있어 시장의 전반적인 흐름을 명확하게 파악할 수 있습니다. 2. 내장된 목표가 및 피보나치 익절 (Built-in Targets & Fibonacci TP) 자동 목표가 계산:
VOLUME PROFILE SAF-XII MT5용 전문가급 마켓 프로파일 분석 도구 (그리드 스타일 트레이더를 위한 드림 인디케이터) 볼륨 프로파일(Volume Profile)이란? 볼륨 프로파일은 단순히 '시간'에 따른 거래량을 보여주는 일반 지표와 달리, 특정 '가격 수준'에서의 거래 활동을 표시하는 전문 기관용 도구입니다. 설정한 기간 내에 거래가 '어디서' 발생했는지를 시각화하여 다음을 식별할 수 있도록 돕습니다. 가치 영역 (VAH/VAL) – 전체 거래의 대부분이 발생한 가격대. 제어 지점 (POC) – 거래량이 가장 많이 집중된 단일 가격 수준. 유동성 불균형 – 각 가격대에서의 매수(Bull) vs 매도(Bear) 지배력. 지지/저항 – 실제 거래 활동에 기반한 자연적인 가격 지지 및 저항선. 3가지 작동 모드 – "설정 후 방치(Set and Forget)" 가능 VP_MANUAL (스윙 트레이딩 및 주요 레벨 분석) 사용자가 수직선을 드래그하여 분석 범위를 직접
VibeFox Volume Profile — MetaTrader 5용 Volume Profile VibeFox Volume Profile는 MetaTrader 5를 위한 완전한 Volume Profile 도구 모음입니다. 거래된 거래량을 가격에 따라 수평으로 분포시켜 그려내므로, 시장이 가장 많은 활동을 보인 곳, 거래가 얇았던 곳, 그리고 어떤 가격 수준이 자석이나 장벽처럼 작용할 가능성이 높은지를 즉시 확인할 수 있습니다. 모든 프로파일은 차트 위에 직접 그려지며, 현대적이고 마우스로 조작하는 패널에서 제어됩니다 — 뒤져야 할 메뉴도, 첨부할 스크립트도 없습니다. 캔들만으로 지지와 저항을 추측하는 대신, 거래량의 실제 발자취로 작업합니다. 가격을 끌어당기는 고거래량 노드, 가격이 흔히 빠르게 통과하는 저거래량 간극, 그리고 대부분의 거래가 이루어진 공정 가치 구역입니다. 필요한 방식 그대로의 Volume Profile Volume Profile는 하나의 고정된 프로파일이 아닙니다
only 12 free copies left VOLURIS — Volume Profile 엔진 당신은 이미 트레이딩 방법을 알고 있습니다. 단지 봐야 할 것을 보지 못하고 있을 뿐입니다. 이런 느낌을 이미 겪어본 적이 있을 것입니다. 진입합니다. 가격은 즉시 반대로 움직입니다. 손절이 나갑니다. 그리고 바로 그 직후, 가격은 반전해서 당신이 예상했던 방향으로 정확히 움직입니다. 당신의 판단은 맞았습니다. 단지 너무 빨랐거나, 너무 늦었거나, 둘 다였을 뿐입니다. 다시 차트를 보면 이제 보입니다. 당신의 진입가 바로 위에 Naked POC가 있었습니다. 이전 세션의 Value Area가 가격이 멈춘 바로 그 위치에 있었습니다. VWAP는 저항으로 작용하고 있었지만, 당신의 차트에는 표시조차 되어 있지 않았습니다. 시장의 컨텍스트는 모든 것을 말해주고 있었습니다. 당신에게는 그것을 읽을 도구가 없었을 뿐입니다. 이것은 트레이딩 문제가 아닙니다. 정보 문제입니다. VOLURIS
FREE
Here   our more valuable tools SMC Trend Trading   ,  Easy SMC Trading  ,  Institutional SMC Architect Volume Analysis Tools  ,  Volume flow Profile  ,  Market volume profile  , FVG with Volume  , Liquidity Heatmap Profile  ,  Volume Spread Analysis The    Liquidity Heatmap   is a sophisticated institutional trading tool designed to reveal where over-leveraged traders are trapped. By calculating estimated liquidation levels based on volume spikes and leverage, this indicator draws a dynamic "h
Gioteen Volatility Index (GVI) - your ultimate solution to overcoming market unpredictability and maximizing trading opportunities. This revolutionary indicator helps you in lowering your losing trades due to choppy market movements. The GVI is designed to measure market volatility, providing you with valuable insights to identify the most favorable trading prospects. Its intuitive interface consists of a dynamic red line representing the volatility index, accompanied by blue line that indicate
AW Candle Patterns
AW Trading Software Limited
AW 양초 패턴 표시기는 강력한 양초 패턴 스캐너와 결합된 고급 추세 표시기의 조합입니다. 가장 신뢰할 수 있는 30개의 촛대 패턴을 인식하고 강조 표시하는 데 유용한 도구입니다. 또한 색상 막대를 기반으로 하는 현재 추세 분석기입니다.       크기를 조정하고 위치를 지정할 수 있는 플러그인 다중 시간 프레임 추세 패널. 트렌드 필터링에 따라 패턴 표시를 조정하는 고유한 기능. 장점: 캔들 패턴을 쉽게 식별 결과를 다시 그리지 않습니다 내장된 다중 시간 추세 패널 비활성화된 패턴 유형(1, 2, 3 촛불) 패턴 표시 시 트렌드 필터링 조정 MT4 version -> HERE  / Instructions and description  -> HERE 표시된 패턴 목록: 망치 패턴 핀 업 / 핀 다운 약세 하라미 / 강세 하라미 Bearish Harami Cross / Bullish Harami Cross 피벗 포인트 반전 업 / 피벗 포인트 반전 다운 더 높은 종가와 함께 낮은 더블
ICT Fair Value Gap Indicator
David Muriithi
4.64 (11)
An ICT fair value gap is a trading concept that identifies market imbalances based on a three-candle sequence. The middle candle has a large body while the adjacent candles have upper and lower wicks that do not overlap with the middle candle. This formation suggests that there is an imbalance where buying and selling powers are not equal. Settings Minimum size of FVG (pips) -> FVGs less than the indicated pips will be not be drawn Show touched FVGs Normal FVG color -> color of FVG that hasn't
FREE
This indicator allows you to enjoy the two most popular products for analyzing request volumes and market deals at a favorable price: Actual Depth of Market Chart Actual Tick Footprint Volume Chart This product combines the power of both indicators and is provided as a single file. The functionality of Actual COMBO Depth of Market AND Tick Volume Chart is fully identical to the original indicators. You will enjoy the power of these two products combined into the single super-indicator! Below is
Blahtech Market Profile MT5
Blahtech Limited
5 (10)
Was: $249  Now: $99   Market Profile defines a number of day types that can help the trader to determine market behaviour. A key feature is the Value Area, representing the range of price action where 70% of trading took place. Understanding the Value Area can give traders valuable insight into market direction and establish the higher odds trade. It is an excellent addition to any system you may be using. Inspired by Jim Dalton’s book “Mind Over Markets”, this indicator is designed to suit the
Volume Profile Canvas
Mauro Italo Gaspari
Volume Profile Canvas - Professional Volume Profile Indicator for MetaTrader 5 DESCRIPTION Volume Profile Canvas is a professional volume profile indicator for MetaTrader 5 that renders directly on the chart using a high-performance Canvas engine. It calculates and displays the volume distribution across price levels, identifying the Point of Control (POC), Value Area High (VAH) and Value Area Low (VAL) in real time. This is a pure analysis tool. It does not trade. It gives you an instant vi
PivotWave
Jeffrey Quiatchon
Introducing PivotWave – your ultimate trading companion that redefines precision and market analysis. Designed with traders in mind, PivotWave is more than just an indicator; it’s a powerful tool that captures the pulse of the market, identifying key turning points and trends with pinpoint accuracy. PivotWave leverages advanced algorithms to provide clear visual signals for optimal entry and exit points, making it easier for traders to navigate volatile market conditions. Whether you are a begin

Volume flow Profile
Israr Hussain Shah
Master Edition은 거래량과 자금 흐름의 관점을 통해 시장 구조를 시각화하도록 설계된 전문가급 분석 도구입니다. 표준 거래량 지표와 달리, 이 도구는 차트에 일일 거래량 프로필을 직접 표시하여 가격 발견이 발생한 위치와 "스마트 머니"가 위치한 곳을 정확하게 볼 수 있게 합니다. 이 Master Edition은 명확성과 속도를 위해 설계되었으며, 로드 시 차트 레이아웃을 즉시 아름답게 만드는 독특한 자동 테마 동기화 시스템을 특징으로 합니다. 주요 기능: 진정한 자금 흐름 계산: 표준 틱 거래량을 넘어섭니다. "Use Money Flow"를 활성화하면 거래량이 가격에 따라 가중치가 부여되어 특정 가격 수준에서의 실제 자본 투입을 드러냅니다. 가치 영역(VA) 시각화: 가치 영역(기본값: 거래량의 70%)을 자동으로 계산합니다. VA Fill: 통제 구역을 즉시 식별하기 위해 가치 영역 배경을 음영 처리합니다. 주요 수준: 통제점(POC), 가치 영역 고점(VAH), 가치 영
Sessions and Bar Time
Tran Vinh Vu
4 (1)
The Sessions and Bar Time indicator is a professional utility tool designed to enhance your trading awareness and timing precision on any chart. It combines two key features every trader needs — market session visualization and real-time bar countdown — in one clean, efficient display. Key Features: Candle Countdown Timer – Shows the remaining time before the current candle closes, helping you anticipate new bar formations. Market Session Display – Automatically highlights the four main trading
FREE
This Volume Delta Profile is an advanced MetaTrader 5 indicator that visualizes   volume delta (order flow imbalance)   using a volume profile-style histogram. It shows the difference between buying and selling pressure at specific price levels, helping traders identify supply and demand zones. This indicator provides a unique perspective on market dynamics by visualizing the imbalance between buying and selling pressure, offering insights beyond traditional volume analysis. Core Concept Positiv
LevelsHunter Pro
Dmitrii Kovalevskii
LevelsHunter Pro – 전문가용 거래량 프로필 및 과거 분석 무엇인가요? LevelsHunter Pro는 현재 POC, VAH, VAL 레벨을 표시할 뿐만 아니라   과거로 돌아가   과거 거래 순간에 이 레벨들이 어디에 있었는지 볼 수 있는 거래량 프로필 지표입니다. 차트에서 추측하는 도구가 아닙니다. 이미 일어난 일을   냉정하게 분석 하기 위한 도구입니다. 트레이더에게 필요한 이유 문제점:   대부분의 지표는 '지금 여기'만 보여줍니다. 거래를 마감하고 실수를 분석하려고 하면 이미 레벨이 이동해 있습니다. POC가 진입가 위에 있었는지 아래에 있었는지 알 수 없습니다. 가격이 왜 반등했는지 또는 레벨을 돌파했는지 알 수 없습니다. 해결책:   LevelsHunter Pro는 모든 봉의 레벨을 기록합니다. 과거의 어떤 캔들이든 클릭하면 그 순간의 거래량 프로필을 정확히 볼 수 있습니다. 거래에서 어떻게 사용하나요? 1. 실시간 진입 개선 매수 신호가 보입니다. 가격이
Here   our more valuable tools SMC Trend Trading   ,  Easy SMC Trading  ,  Institutional SMC Architect Volume Analysis Tools  ,  Volume flow Profile  ,  Market volume profile  , FVG with Volume  , Liquidity Heatmap Profile  ,  Volume Spread Analysis 2. Key Features Dynamic Filtering : The core feature. As soon as the current price crosses a historical liquidity level, that level disappears. This reduces chart clutter and prevents you from trading off "dead" support/resistance. Liquidity Heatma
THE PRICE WILL BE SUCH ONLY FOR THE FIRST 100 ORDERS, AFTER THAT, FOR EVERY 100 ORDERS, THE PRICE WILL INCREASE BY 20% COMPARED TO THE PREVIOUS ONE!!! What is NEXUS? NEXUS is a professional indicator for MetaTrader 5, designed to show the real volume flow and the balance between buyers and sellers in the market. The indicator analyzes price and volume movements to detect the moments when the market changes direction and large participants begin to accumulate or unload positions. Key Features
Honest Breakeven
Konstantin Gruzdev
Indicator gives an honest picture of changes in breakeven levels for transactions throughout the account history, and not just for open positions (screenshot 1). Accurate calculation of levels, taking into account accrued commissions, fees and swaps, allows you to evaluate trading results both visually and in Expert Advisors (screenshot 2). For Expert Advisors, the indicator in its standard form provides not only the break-even level, but also the number of positions, volume, and all additional
Premium level Pro
Dmitriy Kashevich
Premium level is a unique indicator with more than 80% accuracy of correct predictions! This indicator has been tested for more than two months by the best Trading Specialists! The author's indicator you will not find anywhere else! From the screenshots you can see for yourself the accuracy of this tool! 1 is great for trading binary options with an expiration time of 1 candle. 2 works on all currency pairs, stocks, commodities, cryptocurrencies Instructions: As soon as the red arrow app
Spike Blast Pro
Israr Hussain Shah
Here   our more valuable tools SMC Trend Trading   ,  Easy SMC Trading  ,  Institutional SMC Architect Volume Analysis Tools  ,  Volume flow Profile  ,  Market volume profile  , FVG with Volume  , Liquidity Heatmap Profile  ,  Volume Spread Analysis Spike Blaster Pro is a next-generation MT5 indicator designed specifically for synthetic markets. It works seamlessly on Boom Index and Weltrade Index , providing traders with sharp, reliable spike detection signals. What makes Spike Blaster Pro po
ALIEN Dashboard
Youssef Esseghaiar
ALIEN DASHBOARD FULL EDITION – Professional ICT & Precision Trading Dashboard for MT5 ( HYBRID ENGINE ) Overview The   Alien Dashboard Full Edition   is a comprehensive, all‑in‑one technical indicator for MetaTrader 5 that merges the most powerful concepts from Inner Circle Trader (ICT) methodology with advanced precision‑entry logic, multi‑timeframe analysis, and an intuitive on‑chart dashboard. Designed for serious traders who want to visualise institutional order flow, identify high‑probabili
The MarketProfileTPO indicator for MetaTrader 5 is a powerful tool designed to bring the Market Profile concept, based on Time Price Opportunity (TPO) analysis , directly onto your main chart window. This indicator calculates and displays the price distribution over a specified period, highlighting key areas of market activity and concentration. It is particularly optimized for high-volatility instruments like NAS100, US30, and XAUUSD when used on the M1 (1-minute) timeframe, offering a detailed
Introducing "X Marks the Spot" – Your Ultimate MetaTrader 5 Indicator for Perfect Trades! Are you tired of the guesswork in trading? Ready to take your MetaTrader 5 experience to a whole new level? Look no further – "X Marks the Spot" is here to revolutionize your trading strategy! What is "X Marks the Spot"? "X Marks the Spot" is not just another indicator – it's your personal trading compass that works seamlessly on all timeframes . Whether you're a beginner or an experienced trader,
MR Volume Profile 5
Sergey Khramchenkov
The "MR Volume Profile 5" indicator is a charting tool that displays trading volume at different price levels rather than time intervals. A key concept in volume profile is the point of control (POC)—the price level with the highest volume traded during the session or time range. While tools like VWAP or OBV provide volume trends, the "MR Volume Profile 5" indicator offers granular detail about where the most market activity occurs at specific price levels. This makes it a more precise tool for
이 제품의 구매자들이 또한 구매함
ARIPoint
Temirlan Kdyrkhan
1 (1)
ARIPoint is a powerful trading companion designed to generate high-probability entry signals with dynamic TP/SL/DP levels based on volatility. Built-in performance tracking shows win/loss stats, PP1/PP2 hits, and success rates all updated live. Key Features: Buy/Sell signals with adaptive volatility bands Real-time TP/SL/DP levels based on ATR Built-in MA Filter with optional ATR/StdDev volatility Performance stats panel (Success, Profit/Loss, PP1/PP2) Alerts via popup, sound, push, or email Cu
PrimeScalping
Temirlan Kdyrkhan
PrimeScalping is a powerful trading companion designed to generate high-probability entry signals with dynamic TP/SL/DP levels based on volatility. Built-in performance tracking shows win/loss stats, PP1/PP2 hits, and success rates — all updated live. Key Features: Buy/Sell signals with adaptive volatility bands Real-time TP/SL/DP levels based on ATR Built-in MA Filter with optional ATR/StdDev volatility Performance stats panel (Success, Profit/Loss, PP1/PP2) Alerts via popup, sound, push, or e
ScalpPoint
Temirlan Kdyrkhan
ScalpPoint is a powerful trading companion designed to generate high-probability entry signals with dynamic TP/SL/DP levels based on volatility. Built-in performance tracking shows win/loss stats, PP1/PP2 hits, and success rates — all updated live. Key Features: Buy/Sell signals with adaptive volatility bands Real-time TP/SL/DP levels based on ATR Built-in MA Filter with optional ATR/StdDev volatility Performance stats panel (Success, Profit/Loss, PP1/PP2) Alerts via popup, sound, push, or emai
SmartScalping
Temirlan Kdyrkhan
SmartScalping is a powerful trading companion designed to generate high-probability entry signals with dynamic TP/SL/DP levels based on volatility. Built-in performance tracking shows win/loss stats, PP1/PP2 hits, and success rates — all updated live. Key Features: Buy/Sell signals with adaptive volatility bands Real-time TP/SL/DP levels based on ATR Built-in MA Filter with optional ATR/StdDev volatility Performance stats panel (Success, Profit/Loss, PP1/PP2) Alerts via popup, sound, push, or e
TrendProMaster
Temirlan Kdyrkhan
MasterTrend Indicator for MT5 A powerful trend-following and signal-evaluation tool MasterTrend   is a custom MT5 indicator that combines Moving Averages and ATR-based risk/reward logic to generate clear buy/sell signals. It visualizes dynamic SL/TP levels, evaluates past trade outcomes, and displays win/loss statistics in a clean on-chart panel. Key features include: Buy/Sell signals based on MA crossovers ATR-based SL/TP1/TP2/TP3 levels with visual lines and labels Signal outcome tracking wit
Meravith Scanner
Ivan Stefanov
5 (2)
MERAVITH SCANNER는 MetaTrader 5용 전문 금융 시장 지표로, 여러 분석 도구를 하나의 통합 시스템으로 결합합니다. 독점적인 거래량 가중 평균 가격(VWAP) 방법론을 사용하여 모든 계산을 자동으로 수행하며, 주관적인 해석을 완전히 배제합니다. 이 지표는 모든 자산 클래스(Forex, 주식, 지수, 상품, 암호화폐)와 M1부터 월간 차트까지 모든 시간 프레임에서 작동합니다. 기본 원리는 “가격은 거래량을 따른다”입니다. MERAVITH는 기관 거래량이 집중되는 위치를 식별하고, 그 집중에서 수학적으로 정확한 가격 수준을 도출합니다. 예측이나 투기를 하지 않으며, 계산만 수행합니다. MERAVITH SCANNER를 사용하면 28개의 주요 Forex 통화쌍을 모든 시간 프레임에서 단 2~3분 만에 스캔할 수 있습니다. 또한 원하는 시장을 스캔할 수도 있으며, 예를 들어 약 100개의 주식을 약 10분 안에 스캔할 수 있습니다. 지표는 소진 레벨, 균형선, 편차, 통계
MasterTrend
Temirlan Kdyrkhan
MasterTrend Indicator for MT5 A powerful trend-following and signal-evaluation tool MasterTrend   is a custom MT5 indicator that combines Moving Averages and ATR-based risk/reward logic to generate clear buy/sell signals. It visualizes dynamic SL/TP levels, evaluates past trade outcomes, and displays win/loss statistics in a clean on-chart panel. Key features include: Buy/Sell signals based on MA crossovers ATR-based SL/TP1/TP2/TP3 levels with visual lines and labels Signal outcome tracking wit
ARICoins
Temirlan Kdyrkhan
ARICoin is a powerful trading companion designed to generate high-probability entry signals with dynamic TP/SL/DP levels based on volatility. Built-in performance tracking shows win/loss stats, PP1/PP2 hits, and success rates all updated live. Key Features: Buy/Sell signals with adaptive volatility bands Real-time TP/SL/DP levels based on ATR Built-in MA Filter with optional ATR/StdDev volatility Performance stats panel (Success, Profit/Loss, PP1/PP2) Alerts via popup, sound, push, or email Cust
IVISTscalp5
Vadym Zhukovskyi
5 (6)
[iVISTscalp5]: 시간을 통한 시장 행동 연구소 TLV Framework | Liquidity Activation Points ⸻ 개요 iVISTscalp5는 VISTmany 프로젝트 내에서 개발된 다중 레벨 타이밍 및 가격 구조 인디케이터입니다. 이 시스템은 Liquidity Activation Points(타이밍)를 통해: 움직임이 발생하는 시간 방향 가격 움직임의 범위 를 예측합니다. iVISTscalp5 인디케이터는 기본 설정만으로도 모든 금융상품에 사용할 수 있습니다. ⸻ 실질적 가치 iVISTscalp5는 일반적인 기술적 지표로 만들어진 것이 아닙니다. 개발의 핵심 아이디어는 다음과 같습니다. 누구나 시간을 통해 시장 행동을 연구할 수 있도록 하는 것. ⸻ Time Language VISTmany (TLV) — 프로젝트의 핵심 개념 t(p) t(p)는 타이밍이 활성화되는 가격 레벨입니다. ⸻ p(p) p(
Red and Green Light – Intelligent Trading Signal Indicator Product Overview Red and Green Light is a professional trading signal indicator based on the multi-stage T3 smoothing algorithm. It integrates a visual traffic light system, intelligent signal recognition, risk alerts, and multiple notification features. Whether you're a manual trader or an Expert Advisor (EA) developer, this indicator helps you capture market opportunities with greater precision and effectively avoid the risks of
Pan PrizMA CD Phase
Aleksey Panfilov
The Expert Advisor and the video are attached in the Discussion tab . The robot applies only one order and strictly follows the signals to evaluate the indicator efficiency. Pan PrizMA CD Phase is an option based on the Pan PrizMA indicator. Details (in Russian). Averaging by a quadric-quartic polynomial increases the smoothness of lines, adds momentum and rhythm. Extrapolation by the sinusoid function near a constant allows adjusting the delay or lead of signals. The value of the phase - wave s
Классификатор силы тренда. Показания на истории не меняет. Изменяется классификация только незакрытого бара. По идее подобен полной системе ASCTrend, сигнальный модуль которой, точнее его аппроксимация в несколько "урезанном" виде, есть в свободном доступе, а также в терминале как сигнальный индикатор SilverTrend . Точной копией системы ASCTrend не является. Работает на всех инструментах и всех временных диапазонах. Индикатор использует несколько некоррелируемых между собой алгоритмов для класси
FFx Universal Strength Meter PRO is more than a basic strength meter. Instead of limiting the calculation to price, it can be based on any of the 19 integrated strength modes + 9 timeframes. With the FFx USM, you are able to define any period for any combination of timeframes. For example, you can set the dashboard for the last 10 candles for M15-H1-H4… Full flexibility! Very easy to interpret... It gives a great idea about which currency is weak and which is strong, so you can find the best pai
The FFx Universal MTF alerter shows on a single chart all the timeframes (M1 to Monthly) with their own status for the chosen indicator. 9 indicators mode (MACD-RSI-Stochastic-MA-ADX-Ichimoku-Candles-CCI-PSAR). Each can be applied multiple times on the same chart with different settings. Very easy to interpret. Confirm your BUY entries when most of the timeframes are showing green color. And confirm your SELL entries when most of the timeframes are showing red color. 2 Alert Options : input to s
FFx Watcher Pro MT5
Eric Venturi-Bloxs
The FFx Watcher PRO is a dashboard displaying on a single chart the current direction of up to 15 standard indicators and up to 21 timeframes. It has 2 different modes: Watcher mode: Multi Indicators User is able to select up to 15 indicators to be displayed User is able to select up to 21 timeframes to be displayed Watcher mode: Multi Pairs User is able to select any number of pairs/symbols User is able to select up to 21 timeframes to be displayed This mode uses one of the standard indicators
FFx Patterns Alerter gives trade suggestions with Entry, Target 1, Target 2 and StopLoss .... for any of the selected patterns (PinBar, Engulfing, InsideBar, OutsideBar) Below are the different options available: Multiple instances can be applied on the same chart to monitor different patterns Entry suggestion - pips to be added over the break for the entry 3 different options to calculate the SL - by pips, by ATR multiplier or at the pattern High/Low 3 different options to calculate the 2 TPs -
FFx Basket Scanner MT5
Eric Venturi-Bloxs
MetaTrader 4 version available here : https://www.mql5.com/en/market/product/24881 FFx Basket Scanner is a global tool scanning all pairs and all timeframes over up to five indicators among the 16 available. You will clearly see which currencies to avoid trading and which ones to focus on. Once a currency goes into an extreme zone (e.g. 20/80%), you can trade the whole basket with great confidence. Another way to use it is to look at two currencies (weak vs strong) to find the best single pairs
MetaTrader 4 version available here: https://www.mql5.com/en/market/product/25793 FFx Pivot SR Suite PRO is a complete suite for support and resistance levels. Support and Resistance are the most used levels in all kinds of trading. Can be used to find reversal trend, to set targets and stop, etc. The indicator is fully flexible directly from the chart 4 periods to choose for the calculation: 4Hours, Daily, Weekly and Monthly 4 formulas to choose for the calculation: Classic, Camarilla, Fibonac
ClassicSBA
Umri Azkia Zulkarnaen
this indicator very simple and easy if you understand and agree with setup and rule basic teknical sba you can cek in link : please cek my youtube channel for detail chanel : an for detail info  contact me  basicly setup buy (long) for this indicator is Magenta- blue and green candle or magenta - green  and green candlestik and for setup sell (short) is Black - yellow - and red candle or black - red  and red candlestik
Pendiente de Precio
Cesar Juan Flores Navarro
Indicador en base a la pendiente de la linea de precio, dibuja una línea de color cuando sube a base de los precios que previamente has sido procesados o linealizados, y cuando baja la pendiente la linea linealizada toma otro color. En este caso se a considerado 6 lineas de diferentes procesos desde pendientes largas hacia las cortas, observándose que cuando coincidan las pendientes se produce un máximo o mínimo, lo que a simple vista nos permitirá hacer una COMPRA O VENTA.
WanaScalper
Isaac Wanasolo
1 (1)
A scalping indicator based on mathematical patterns, which on average gives signals with relatively small SL, and also occasionally helps to catch big moves in the markets (more information in the video) This indicator has three main types of notifications: The first type warns of a possible/upcoming signal on the next bar The second type indicates the presence of a ready signal to enter the market/open a position The third type is for SL and TP levels - you will be notified every time price re
Fibonacci Multiple 12
Cesar Juan Flores Navarro
Fibonacci Múltiple 12, utiliza la serie fibonacci plasmado en el indicador fibonacci, aumentadolo 12 veces según su secuencia. El indicador fibonacci normalmente muestra una vez, el presente indicador se mostrara 12 veces empezando el numero que le indique siguiendo la secuencia. Se puede utilizar para ver la tendencia en periodos cortos y largos, de minutos a meses, solo aumentado el numero MULTIPLICA.
Recommended TimeFrame >= H1. 100% Non Repainted at any moment.  Use it carefully, only with Trend Direction. Trading Usage: 2 Variants: as Range System or as BreakOut System (Both Only With Trend Direction)::: (Always use StopLoss for minimise Risk); [1] as Range System: (Recommended) in UP TREND:  - BUY in Blue Line , then if price goes down by 50 points (on H1) open Second BUY.   Close in any Profit you wish: TrailingStop(45 points) or Close when Price touches upper Gold Line. in DOWN TREND
Linea Horizontal Inteligente
Cesar Juan Flores Navarro
En base a cálculos matemáticos de determino una linea Horizontal que cruza a todas las señales de trading, mostrando los máximos y mínimos. La linea horizontal parte en dos las subidas y bajadas de las señales de trading, de tan manera que es fácil identificar los máximos y mínimos, y es inteligente por que es sensible a las subidas y bajadas, afín de no quedarse en un solo lado por siempre, trabaja excelentemente con otros indicadores suavizadores ya que les garantiza que en un intervalo de tie
Spike Detector
Tete Adate Adjete
this indicator is a Spike detector indicator, it is specially designed to trade Boom 1000, Boom 500, Crash 1000 and Crash 500 We recommend using it on Deriv Boom and Crash indices only Its setting is intuitive, familiar, easy to use it has notification functions; audible notifications and push notifications. this tool is simple to use, easy to handle This update is based on different strategies for spikes
Limitless MT5
Dmitriy Kashevich
Limitless MT5 is a universal indicator suitable for every beginner and experienced trader. works on all currency pairs, cryptocurrencies, raw stocks Limitless MT5 - already configured and does not require additional configuration And now the main thing Why Limitless MT5? 1 complete lack of redrawing 2 two years of testing by the best specialists in trading 3 the accuracy of correct signals exceeds 80% 4 performed well in trading during news releases Trading rules 1 buy signal - the ap
Escalera Inteligente
Cesar Juan Flores Navarro
Indicador en MQL5, recibe la información del precio SUAVIZADO, lo procesa anulando los picos inteligentemente, y el resultado lo envía al desarrollo de la escalera que iniciara y subirá o bajara según el peldaño o INTERVALO ingresado Ingreso PERIODO = 50 (variar segun uso) Ingreso MULTIPLICA AL PERIODO = 1 (variar segun uso) Segun la configuración la escalera puede pegarse o separarse de los precios,, Se aplica toda la linea de tiempo, y a todas las divisas, etc.  
Fibonacci Suavizado
Cesar Juan Flores Navarro
Indicador en MQL5, que obtiene el promedio de 10 EMAS, que son alineadas según Fibonacci, obteniendo un promedio, que sera suavizado.  Se puede ingresar un numero desde 2 a N, que multiplica a los EMA-Fibonacci. Funciona en cualquier criptomoneda, etc. etc... pudiendo calcular el futuro segun la tendencia de las EMAS. Funciona excelentemente en tramos largos, determinando exactamente el mejor inicio/salida. El precio inicial por apertura sera por un periodo de tiempo, luego aumentará.
QuantXSTocks Trading Range Indicator for MT5: INSTRUCTIONS TO USE OUR INDICATOR:- User needs to take trade on Arrow or after an Arrow CandleStick, You can achieve up-to 35-125 pips target by this Indicator. Best Timeframes for Stocks and Indices are M30 and H1: AMAZON M30 (50 pips) TESLA M30 (50 pips) APPLE M30 (50 pips) ADOBE M30 (50 pips) NASDAQ100 H1 (125 pips) The above are the approximate amount of pips you can achieve by this Indicator, Green arrow appears to be buy arrow while the Red ar
Super Suavizador
Cesar Juan Flores Navarro
Indicador en MQL5 que obtiene el promedio de 10 EMAS que son alineadas y procesadas según Fibonacci luego el promedio es suavizado"  Se ingresa un número de 2 a N que multiplica los EMA-Fibonacci y por consiguiente aumenta los fibonacci, resultando un promedio.   Se ingresa un número que suaviza los EMA-Fibonacci. Considerando los números 1/1 seria la suavización minima. Considerando los números 3/5 seria la suavización media. Considerando los números 10/30 seria la suavización alta.....etc
필터:
리뷰 없음
리뷰 답변