Balance Graph Dashboard

Brief Description
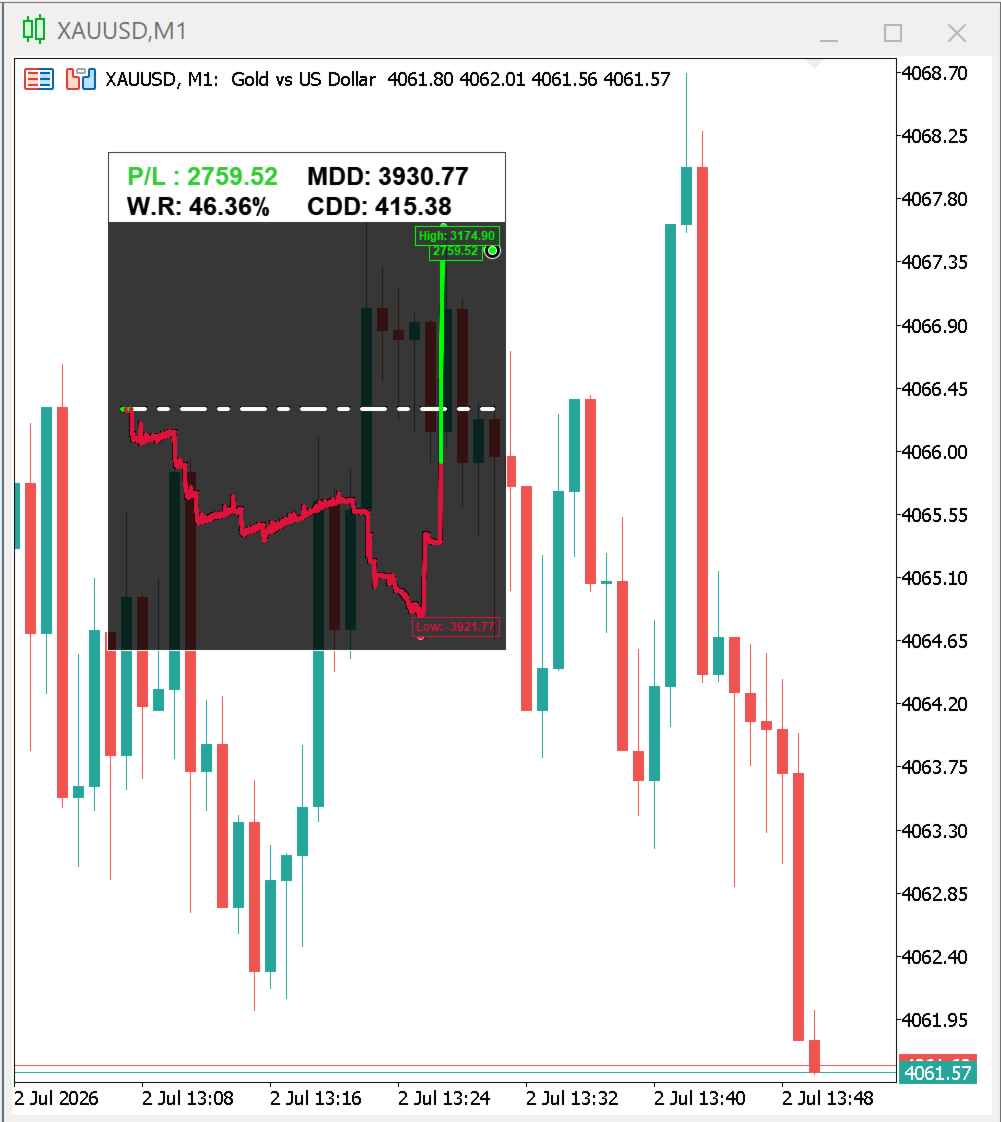
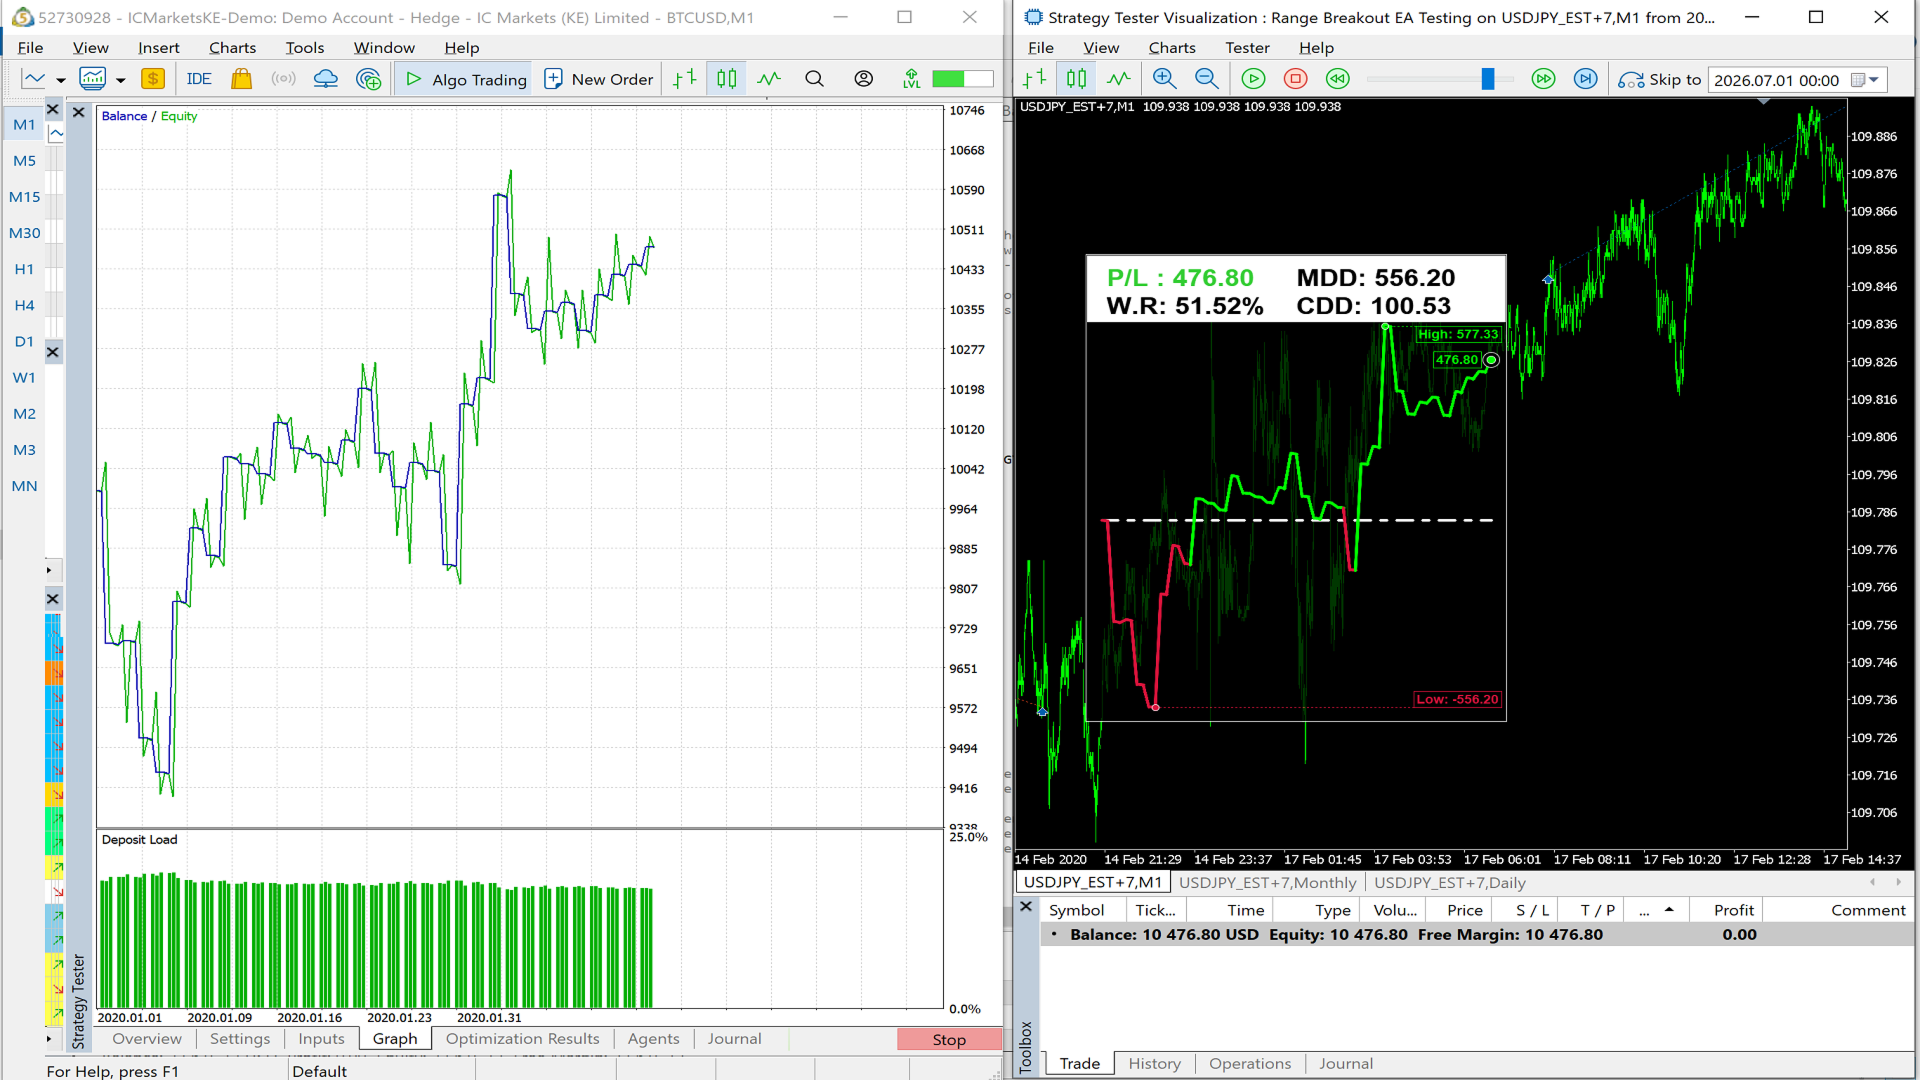
The Balance Curve Dashboard is a sophisticated visual tool that transforms your trading history into an interactive, high-performance equity curve display directly on your MT5 chart. Unlike traditional balance lines that draw on the chart as standard objects, this indicator uses a custom Canvas-based rendering engine to create a crisp, anti-aliased, and fully customizable visual representation of your portfolio's performance.

Key Features:📊 Interactive Visual Dashboard

· Full-color equity curve with profit/loss· Real-time P/L, Win Rate, Max Drawdown, and Current Drawdown metrics· High/Low markers with labeled value boxes
· Current balance marker with floating value display· Gradient fill option for enhanced visual appeal


🎯 Flexible Filtering
· Portfolio View: Track all trades across all symbols
· Symbol Only: Focus on a specific trading symbol
· Strategy Only: Filter by Magic Number

· Symbol + Strategy: Combine both filters for granular analysis


🎨 Fully Customizable

· Adjustable canvas size via Canvas Factor (1x to 2x)
· Customizable colors for profit/loss lines, background, text, borders
· Opacity control for semi-transparent overlays

· Font size controls for labels and metrics


🖱️Interactive

· Drag-and-drop positioning anywhere on the chart

· Chart remains fully functional (mouse scroll enabled while not dragging)


Who Is This For?
· Manual Traders: Visualize your account performance evolution over any period (daily, weekly, monthly, or entire history)
· EA Developers: Use this as a visual front-end for strategy analysis and performance monitoring
· Quant Traders: Quickly assess strategy rates at a glance


INPUTS:

Here is every input explained in full detail:

CanvasFactor — controls the physical pixel size of the entire canvas window. It's a multiplier applied to the base dimensions of 400×500 pixels. At 1 (default) the canvas is exactly 400px wide by 500px tall. At 2 it doubles to 800×1000px — every element inside scales with it: padding, font sizes, marker radii, line

thickness. Values between 1 and 2 (like 1.5) produce intermediate sizes. Going below 1 makes the canvas smaller than the base size, and going above 2makes it very large. Everything throughout, so nothing gets cut off or misaligned when you change this — it all resizes proportionally.


CurveType — this is the most important input. It controls which deals from your account history are included in the balance curve, P/L, win rate, drawdown, and all other metrics. Four options:

PORTFOLIO — includes every single deal from every symbol and every EA/strategy in your account history, regardless of what symbol the chart is on or what magic number any EA used.

If you have trades on EURUSD, GBPUSD, gold, and indices all mixed together, they all count. This shows your overall account performance as a whole.

SYMBOL_ONLY — filters to only deals where DEAL_SYMBOL matches the symbol the indicator is currently attached to (_Symbol). So if you attach the indicator to a EURUSD chart, only everything else is ignored entirely. The magic number of the EA that placed the trade is irrelevant here; any EA's EURUSD trades count. Useful for evaluating how a particular instrument has performed across all strategies trading it.

STRATEGY_ONLY — filters to only deals where DEAL_MAGIC matches strtMagic_No, regardless

of which symbol those trades were on. So if your EA uses magic number 101 and trades both EURUSD and GBPUSD, both show up. Trades from other EAs with different magic numbers are excluded even if they're on the same symbol. Useful for seeing the isolated performance of one specific EA across all the pairs it trades.

SYMBOL_SPECIFIC_STRATEGY — the most restrictive filter: a deal only counts if BOTH DEAL_SYMBOL == _Symbol AND DEAL_MAGIC == strtMagic_No. So it shows only trades placed by a specific EA (identified by magic number) on Everything else — same EA on a different symbol, different EA on the same symbol — is

excluded. Useful when one EA trades multiple pairs and you want to isolate its performance on just one of them.


strtMagic_No — the magic number used as the filter value for STRATEGY_ONLY and SYMBOL_SPECIFIC_STRATEGY curve types. Has no effect at all when CurveType is PORTFOLIO or SYMBOL_ONLY. Set this to match the magic number your EA assigns to its orders via trade.SetExpertMagicNumber() or OrderSend(). Default is 101. If your EA uses a different magic number and you leave this at 101, those two filtered curve types will show an empty curve since no deals will match.


BalanceCurvePeriod — works together with BalanceCurveFactor to define the history window start time. It's a timeframe selector (M1,H1, D1, W1, MN1, etc.) that defines the "unit of for stepping backward through history. At the default PERIOD_MN1 (monthly), one unit of BalanceCurveFactor represents one calendar
month. Changing this to PERIOD_W1 makes one unit equal one week, PERIOD_D1 makes it one
day, and so on. Has no effect when BalanceCurveFactor is negative (entire history

mode).


BalanceCurveFactor — controls how far back in time the history window starts. The exact formula in the code is: start = iTime(_Symbol, BalanceCurvePeriod, 0) - PeriodSeconds(BalanceCurvePeriod) * BalanceCurveFactor. Breaking that down: iTime(_Symbol, BalanceCurvePeriod, 0) is the open time of the current period's bar (e.g. the start of this month if BalanceCurvePeriod = PERIOD_MN1). PeriodSeconds(BalanceCurvePeriod) * BalanceCurveFactor subtracts that many period- Any negative value (default -1) — bypasses this formula entirely and calls HistorySelect(0, TimeCurrent()) instead, which means the entire available account history from the very beginning. This is the "show everything" mode. 0 — start is the open of the current period with no subtraction, so only deals from the current period onward are shown (e.g. this month only if on MN1). 1 — goes back one period before the current one (e.g. last month + this month). 3 on PERIOD_MN1 — shows the last 3 months. On PERIOD_W1 — last 3 weeks. On PERIOD_D1 — last 3 days. So BalanceCurvePeriod is the unit and BalanceCurveFactor is how many of those units to go back.

CanvasOpacity — controls the transparency of the canvas background and certain overlay elements. It's the alpha value passed to label box backgrounds on the High/Low markers, and the current-balance label box. Range is 0 (fully transparent, canvas invisible) to 255 (fully opaque, solid). Default is 200, which is slightly transparent — at this level you can faintly see the chart price bars behind the canvas if they're close to the canvas edge. Going lower makes the background more see-through; going to 255 makes it a solid opaque block.


LineFontSize — despite the name, this is actually the line thickness in pixels for the balance curve

line itself, passed directly as the width parameter to ExtCanvas.LineThick(). Nothing to do with fonts. Default is 5px. Higher values make the curve line thicker and more prominent; lower values make it thinner. At 1 it's a single- pixel line. Also applies to the start-balance dashed horizontal line.


TextFontSize — controls the font size of the four metric labels in the header band (P/L, Win Rate, so it stays proportional when you resize the canvas. Default is 30, which at CanvasFactor=1 renders as 30pt. The marker labels (current balance tag, High/Low tags) use their own hardcoded sizes scaled independently and are not affected by this input.


InpEnableGradient — toggles the shaded area fill between the balance curve and the zero baseline on or off. When true (default), a semi- transparent colored fill is drawn beneath the curve above the baseline (green-tinted when profitable, red-tinted when in loss) by calling DrawVerticalGradientFill() column by column. When false, only the line itself is drawn with no fill underneath — cleaner look, and slightly faster

to render since the entire gradient fill loop is skipped entirely.


InpLineProfitColor — the color of the balance curve line and its gradient fill for any segment where the cumulative P/L is zero or above (i.e. dot, line, and label box border when the curve is in profit. Default is clrLime (bright green).


InpLineLossColor — the color of the balance curve line and gradient fill for any segment where the cumulative P/L is negative (below the zero start line). Also colors the current-balance marker, and the Low marker dot, line, and label box border when in drawdown. Default is clrCrimson (dark red). The curve can switch between these two colors mid-chart wherever the running P/L crosses zero in either direction.


InpBgColor — the fill color of the canvas background, applied via ExtCanvas.Erase() at the start of every redraw. Also used as the fill color inside the High/Low marker label boxes and the current-balance label box — this is what creates the "background behind the text" effect that makes the labels readable over the curve. Default is clrBlack.


InpTxtColor — the color used for the Win Rate drawdown (Max DD, Current DD) text labels in the header. The P/L text uses its own color logic (green or red based on whether P/L is positive or negative) so InpTxtColor doesn't apply to it.


InpBordLineColor — used in three places: the rectangular border drawn around the entire canvas perimeter, the filled header rectangle at the top of the canvas, and the anti-aliased outline rings on the current-balance marker circles (CircleAA() calls). Default is clrWhite. Changing this changes both the outer canvas frame and the marker ring outline simultaneously.
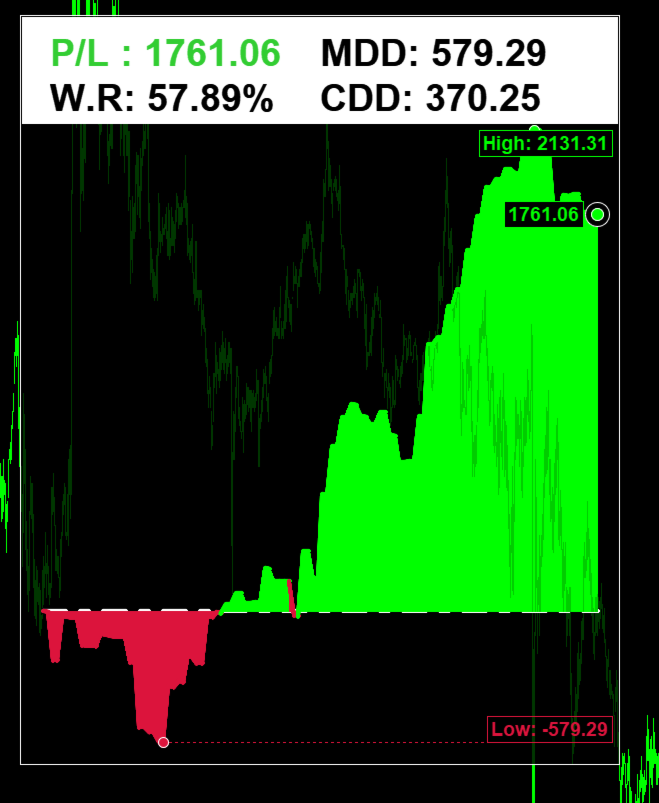
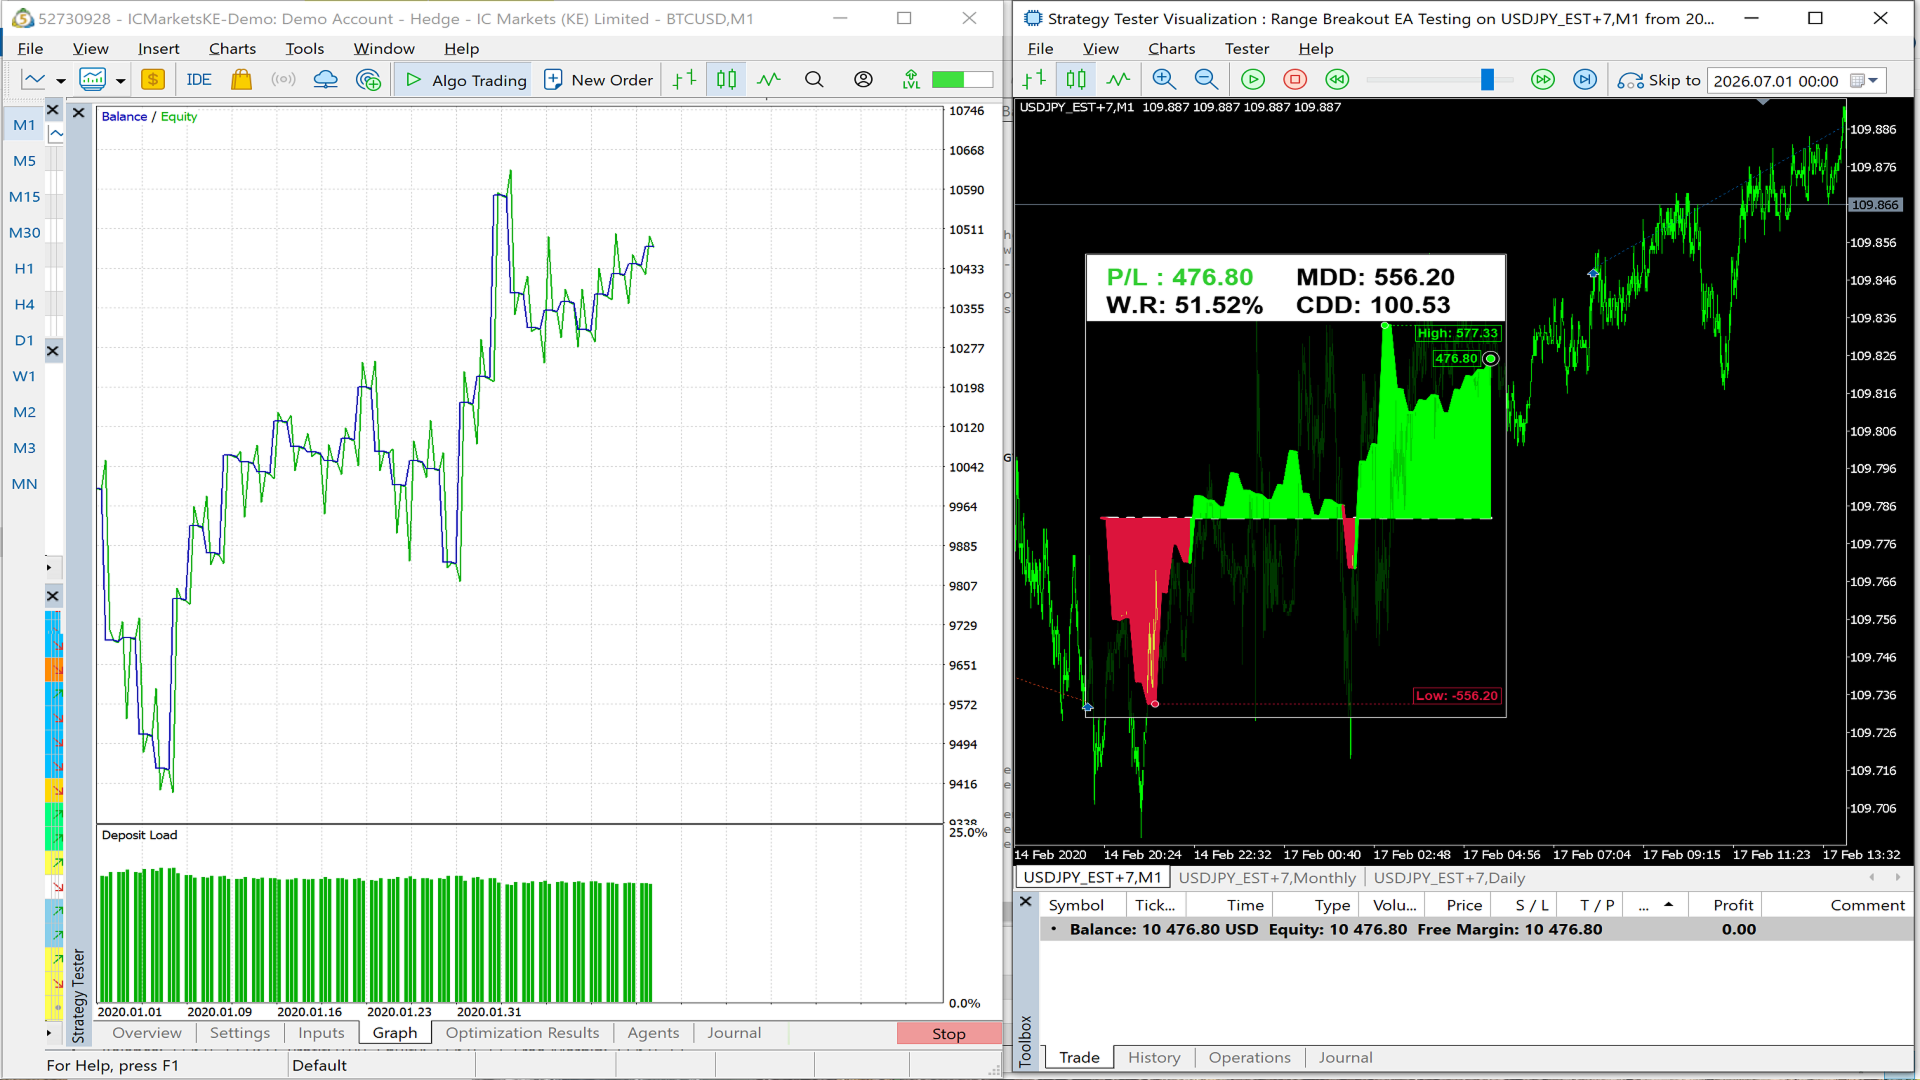
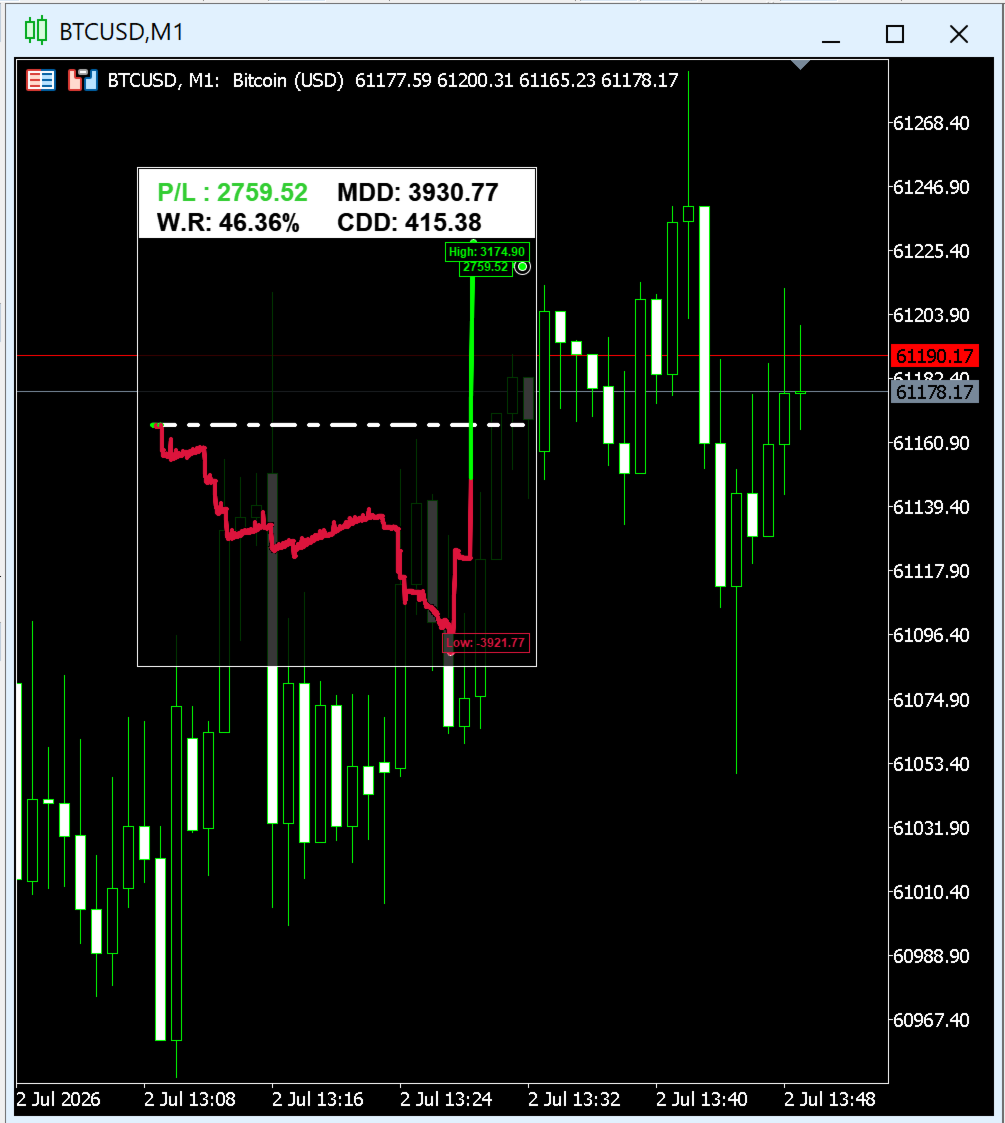
InpStrtLineColor — the color of the dashed horizontal line drawn across the canvas at the zero P/L level (the starting balance baseline). This line is what visually separates profit so it's a dash-dot pattern rather than solid. Default is clrWhite. This is completely independent of InpBordLineColor — you can make the border one color and the baseline another.
推荐产品
该指标建立当前报价,可以与历史报价进行比较,并在此基础上进行价格走势预测。指示器有一个文本字段,用于快速导航到所需日期。 选项: 符号 - 选择指标将显示的符号; SymbolPeriod - 选择指标从中获取数据的时段; IndicatorColor - 指示器颜色; HorisontalShift - 由指标绘制的报价移动指定的柱数; Inverse - true 反转引号,false - 原始视图; ChartVerticalShiftStep - 图表垂直移动(键盘上的向上/向下箭头); 接下来是文本字段的设置,您可以在其中输入日期,您可以通过按“回车”立即跳转到该日期。 接下来是文本字段的设置,您可以在其中输入日期,您可以通过按“回车”立即跳转到该日期。
Atlantis Pro
Mohammed Jebbar
Atlantis Pro 指标 — 逐笔数据精准分析与组合化交易优势 Atlantis Pro 指标是一款先进的多功能工具,基于实时逐笔行情数据,精准捕捉关键价格水平和高概率反转区域。它会持续分析每一笔成交,敏锐识别买卖力量的关键变化,并在图表上即时显示清晰的买入/卖出箭头 — 默认可见,随时准备执行。 Atlantis Pro 适用于 任何时间周期和任何资产 ,包括外汇、股票、商品、指数及加密货币。但它真正的强大之处在于可同时在多个品种上使用:交易者可以同步监控多个标的的最佳进出场信号,构建 多样化的投资组合 ,有效降低风险,提升收益稳定性。 借助 Atlantis Pro,您不再局限于单一图表或单一资产 — 同时捕捉相关或非相关市场的信号,自然对冲头寸,平滑收益波动。这种多标的能力有助于锁定更精准的组合利润,在市场波动中保持持续稳定的收益。 无论是短线剥头皮、波段交易,还是中长期布局,Atlantis Pro 都能提供可执行、实时的精准信号,增强交易者的决策信心。 核心功能: ️ 逐笔数据处理,信号更精准 ️ 买卖箭头默认显示,清晰明了 ️ 适用于任何时间周期与品种 ️
BoxChart MT5
Evgeny Shevtsov
5 (7)
The market is unfair if only because 10% of participants manage 90% of funds. An ordinary trader has slim changes to stand against these "vultures". This problem can be solved. You just need to be among these 10%, learn to predict their intentions and move with them. Volume is the only preemptive factor that faultlessly works on any timeframe and symbol. First, the volume appears and is accumulated, and only then the price moves. The price moves from one volume to another. Areas of volume accumu
Blahtech Supply Demand MT5
Blahtech Limited
4.54 (13)
Was: $299  Now: $99  Supply Demand uses previous price action to identify potential imbalances between buyers and sellers. The key is to identify the better odds zones, not just the untouched ones. Blahtech Supply Demand indicator delivers functionality previously unavailable on any trading platform. This 4-in-1 indicator not only highlights the higher probability zones using a multi-criteria strength engine, but also combines it with multi-timeframe trend analysis, previously confirmed swings a
Wedge Pattern MT5
Sathit Sukhirun
Chinese 这款指标就像是为热衷于图表形态交易的交易者提供的高级图表分析助手。它的设计初衷是减轻视觉分析的负担,并提高盈利的准确性。 从实际应用角度来看,这款指标的主要优势如下: 1. 自动形态检测 (Automated Pattern Detection) 节省时间并减少偏见: 您无需再手动绘制趋势线。指标会寻找价格波段的高低点(Pivot High/Low),并在价格结构符合条件时,自动绘制出上升楔形(Rising Wedge)和下降楔形(Falling Wedge)的框架。 涵盖所有情况: 能够检测正在形成的形态、突破(Breakout)的瞬间,甚至是失败(Failed)的形态,让您清晰地掌握市场全貌。 2. 内置目标和斐波那契止盈 (Built-in Targets & Fibonacci TP) 自动计算目标: 当发生突破时,系统会根据楔形开口的宽度立即计算出主要目标(Main Target)距离,让您明确知道该把止盈(Take Profit)设在哪里。 支持分批平仓 (Scaling Out): 划出多达5个级别的斐波那契线作为子止盈点,非常适合喜欢在关键支撑/阻力位分
VOLUME PROFILE SAF-XII 专业级 MT5 市场轮廓(成交量概况)分析仪 —— 网格交易者的梦幻指标 什么是成交量概况 (Volume Profile)? 成交量概况是一种专业的机构级工具。与传统的随时间显示成交量的指标不同,它显示的是 特定价格水平 上的交易活动。它揭示了交易发生在 哪里 ,帮助您识别: 价值区 (VAH/VAL) :大部分交易发生的价格区间。 控制点 (POC) :成交量最高的核心价格水平。 流动性失衡 :每个层级的多空主导力量对比。 支撑/阻力 :基于实际交易活动形成的天然价格位。 三种操作模式 —— 真正的“设置后即忘” VP_MANUAL(波段交易与关键位分析) 用户通过拖动垂直线自定义分析范围。 仅在移动线条时重新计算。 适用场景 :新闻前夕分析、财报发布、特定日期范围。 VP_AUTO(头寸与动量交易) 随新柱线自动向后滚动。 使用自定义回溯周期(默认 100 根柱线)。 适用场景 :动量策略、突破交易。 VP_SESSION(日内交易与机构流向) 锚定逻辑交易时段(伦敦、纽约、亚洲盘开盘)。 适用场景 :日内交易、基于时段的机构化策略
VibeFox Volume Profile — 适用于 MetaTrader 5 的 Volume Profile VibeFox Volume Profile 是一套完整的 MetaTrader 5 Volume Profile 工具集。它构建成交量沿价格的水平分布,使您能够立即看到市场在何处投入了最多的活动、在何处交易稀薄,以及哪些价格水平可能充当磁石或屏障。每个剖面都直接绘制在图表上,并通过现代的、由鼠标驱动的面板进行控制——无需翻找菜单,无需附加脚本。 您无需仅凭蜡烛图猜测支撑与阻力,而是与成交量的真实足迹打交道:吸引价格的高成交量节点、价格往往会快速穿过的低成交量空隙,以及大部分交易完成的公允价值区域。 按您所需的方式呈现的 Volume Profile Volume Profile 并非单一的固定剖面。它一次性为您提供 多个相互独立的剖面引擎 ,每个都有自己的范围、放置位置和样式,因此您可以在同一图表上从多个角度研究市场。 From-To ——在两条可拖动的线 From 与 To 之间构建的精确剖面。将这两条线放在任意摆动、区间或新闻尖峰周围,便可读取恰好该区段的分布。R
如需最精准的黄金信号设置,请立即联系我,我会发送推荐参数。 VOLURIS — Volume Profile 引擎 你已经知道怎么交易。你只是看不到你本来应该看到的东西。 这种感觉你以前一定经历过。 你进场。价格立刻反向走。你被止损扫掉。然后——就在下一刻——价格反转,并且准确地走向你原本判断的方向。你是对的。只是进早了。或者进晚了。或者两者都有。 你回头看图表,现在你看明白了。你的入场点上方正好有一个 Naked POC。上一交易时段的价值区域正好在价格停住的位置。VWAP 正在充当阻力,而你的图表上甚至没有它。市场背景已经把一切都告诉你了。你只是没有一个工具去读懂它。 这不是交易问题。这是信息问题。 VOLURIS 就是为了解决这个问题而存在。 什么是 VOLURIS VOLURIS 不只是一个指标。它是一个为 MetaTrader 5 打造的完整 Volume Profile 决策工作区,从零开始设计,目的是让自主交易者在图表上、实时地、集中看到专业成交量交易者用来解读市场的关键信息。 不再需要运行五个不同的指标,然后在脑子里拼凑市场画面。不再需要猜价格是在价值
FREE
Here   our more valuable tools SMC Trend Trading   ,  Easy SMC Trading  ,  Institutional SMC Architect Volume Analysis Tools  ,  Volume flow Profile  ,  Market volume profile  , FVG with Volume  , Liquidity Heatmap Profile  ,  Volume Spread Analysis The    Liquidity Heatmap   is a sophisticated institutional trading tool designed to reveal where over-leveraged traders are trapped. By calculating estimated liquidation levels based on volume spikes and leverage, this indicator draws a dynamic "h
重要通知 – 需要许可证和激活 ============================ 激活说明: 完成购买后,请立即联系我们以获取您的许可证密钥、密码或激活信息。没有这些信息,软件将无法运行。我们将确保为您提供顺畅的激活过程,并解答您的任何问题。 --- Volume Delta Profile V2 Enhanced ================================ 专业成交量与Delta分析工具 ------------------------- 概述 ---- **Volume Delta Profile** 是一款专业级分析工具,结合了传统的成交量分布分析与先进的Delta和失衡检测功能。这款综合性指标为交易者提供了市场动态的精细视图,通过实时图形化展示拍卖数据,捕捉价格随时间波动的连续起伏。 --- 核心功能 -------- 5种显示模式 -------------- - **VOL** — 总成交量直方图:显示整体成交量分布 - **BS** — 买卖拆分:可视化每个价格水平的买卖压力 - **ΔH** — Delt
Gioteen Volatility Index (GVI) - your ultimate solution to overcoming market unpredictability and maximizing trading opportunities. This revolutionary indicator helps you in lowering your losing trades due to choppy market movements. The GVI is designed to measure market volatility, providing you with valuable insights to identify the most favorable trading prospects. Its intuitive interface consists of a dynamic red line representing the volatility index, accompanied by blue line that indicate
AW Candle Patterns
AW Trading Software Limited
AW 蜡烛形态指标是高级趋势指标与强大的蜡烛形态扫描仪的组合。它是识别和突出显示 30 个最可靠的烛台形态的有用工具。此外,它是一个基于彩色条的电流趋势分析器,带有   可调整大小和定位的插件多时间框架趋势面板。根据趋势过滤调整模式显示的独特能力。 优点: 轻松识别蜡烛形态 不重绘结果 内置多时间趋势面板 禁用模式类型(1、2、3 根蜡烛) 显示形态时趋势过滤的调整 MT4 version -> HERE  / Instructions and description  -> HERE 显示模式列表: 锤模式 固定/固定 看跌 Harami / 看涨 Harami 看跌 Harami Cross / 看涨 Harami Cross 枢轴点反转向上/枢轴点反转向下 双柱低位收盘价较高/双柱低位收盘价较低 收盘价反转向上 / 收盘价反转向下 中性条 /     两个中性条 双内/内/外 向上推力杆/向下推力杆 晚星/晨星 晚上十字星 / 早上十字星 吞没看跌线/吞没看涨线 镜子酒吧 流星 乌云盖顶 十字星 输入变量: Main settings Trend Filtering Mode
ICT Fair Value Gap Indicator
David Muriithi
4.64 (11)
An ICT fair value gap is a trading concept that identifies market imbalances based on a three-candle sequence. The middle candle has a large body while the adjacent candles have upper and lower wicks that do not overlap with the middle candle. This formation suggests that there is an imbalance where buying and selling powers are not equal. Settings Minimum size of FVG (pips) -> FVGs less than the indicated pips will be not be drawn Show touched FVGs Normal FVG color -> color of FVG that hasn't
FREE
本指标可以让您享受两个最流行的产品来分析在感兴趣的价位的请求量和市场成交量: 真实市场深度图表 真实报价足迹成交量图表 本产品结合两个指标的效力,并以单个文件提供。 反危机出售。今日低价。赶紧! 真实的 COMBO 市场深度功能和报价成交量图表,完全等同于原始指标。您将享受这两款产品结合为单一超级指标的力量!下面是您将得到的功能: 真实市场深度图表 股民专用工具现已在 MetaTrader 5 上可用。 真实市场深度图表 指标在图表上以直方条的形式显示可视化的市场深度,并在实时模式下刷新。 利用 真实市场深度图表 指标您可以正确评估市场请求并从图表上看到大的市场。这可以 100% 的精确剥头皮和设置持仓止损。 指标以两种相应颜色的水平直方条形式显示买和卖的请求 (买-卖)。价格图表上给定级别的显示条和它们的长度与请求的交易量相应。此外, 它指示买卖请求的最大交易量。 此指标显示买卖请求总数量作为堆积面积图。这可以评估当经过下一价位时将会执行的请求总量。买卖请求总数量也显示在图表上。 省缺, 指标显示在图表背景上, 且它不会干扰任何其它指标。当使用指标交易时, 建议使用实际交易量。 本
Blahtech Market Profile MT5
Blahtech Limited
5 (10)
Was: $249  Now: $99   Market Profile defines a number of day types that can help the trader to determine market behaviour. A key feature is the Value Area, representing the range of price action where 70% of trading took place. Understanding the Value Area can give traders valuable insight into market direction and establish the higher odds trade. It is an excellent addition to any system you may be using. Inspired by Jim Dalton’s book “Mind Over Markets”, this indicator is designed to suit the
Volume Profile Canvas
Mauro Italo Gaspari
Volume Profile Canvas - Professional Volume Profile Indicator for MetaTrader 5 DESCRIPTION Volume Profile Canvas is a professional volume profile indicator for MetaTrader 5 that renders directly on the chart using a high-performance Canvas engine. It calculates and displays the volume distribution across price levels, identifying the Point of Control (POC), Value Area High (VAH) and Value Area Low (VAL) in real time. This is a pure analysis tool. It does not trade. It gives you an instant vi
PivotWave
Jeffrey Quiatchon
Introducing PivotWave – your ultimate trading companion that redefines precision and market analysis. Designed with traders in mind, PivotWave is more than just an indicator; it’s a powerful tool that captures the pulse of the market, identifying key turning points and trends with pinpoint accuracy. PivotWave leverages advanced algorithms to provide clear visual signals for optimal entry and exit points, making it easier for traders to navigate volatile market conditions. Whether you are a begin

Volume flow Profile
Israr Hussain Shah
大师版是一款专业级的分析工具,旨在通过成交量和资金流向的视角来可视化市场结构。与标准的成交量指标不同,该工具直接在图表上显示每日成交量分布,让您准确看到价格发现发生的位置以及“聪明钱”的定位。 此大师版专为清晰度和速度而设计,具有独特的自动主题同步系统,加载后即刻美化您的图表布局。 主要特点: 真实资金流向计算: 超越标准的跳动量。启用“Use Money Flow”时,成交量按价格加权,揭示了特定价格水平的实际资金投入。 价值区域 (VA) 可视化: 自动计算价值区域(默认为成交量的70%)。 VA填充: 为价值区域背景着色,以便即时识别控制区域。 关键水平: 清晰标记控制点 (POC)、价值区域高点 (VAH) 和价值区域低点 (VAL)。 专业标记系统: 扫描概况结构以识别关键交易区域: HVN (高成交量节点): 接受和盘整区域(支撑/阻力)。 LVN (低成交量节点): 拒绝区域或“快速通过”区域。 所有标记均向右绘制延长线,便于监控。 Delta 背离(左侧直方图): 左侧直方图可视化每个级别的买卖压力对比。这有助于识别隐藏的背离——即价格可能上涨,但卖家在这些水平上激进打
Sessions and Bar Time
Tran Vinh Vu
4 (1)
The Sessions and Bar Time indicator is a professional utility tool designed to enhance your trading awareness and timing precision on any chart. It combines two key features every trader needs — market session visualization and real-time bar countdown — in one clean, efficient display. Key Features: Candle Countdown Timer – Shows the remaining time before the current candle closes, helping you anticipate new bar formations. Market Session Display – Automatically highlights the four main trading
FREE
This Volume Delta Profile is an advanced MetaTrader 5 indicator that visualizes   volume delta (order flow imbalance)   using a volume profile-style histogram. It shows the difference between buying and selling pressure at specific price levels, helping traders identify supply and demand zones. This indicator provides a unique perspective on market dynamics by visualizing the imbalance between buying and selling pressure, offering insights beyond traditional volume analysis. Core Concept Positiv
LevelsHunter Pro
Dmitrii Kovalevskii
LevelsHunter Pro – 专业成交量分布图与历史分析 这是什么 LevelsHunter Pro 是一款成交量分布图指标,不仅显示当前的 POC、VAH 和 VAL 水平,还允许您   回到过去 ,查看任何历史交易时刻这些水平的位置。 这不是一个在图表上猜测的工具。而是对已经发生的情况进行   冷静分析   的工具。 交易者为什么需要它 问题:   大多数指标只显示「此时此地」。您关闭一笔交易并想分析错误 — 但水平已经移动了。您无法判断 POC 是在入场价之上还是之下。您无法判断价格为何反弹或突破水平。 解决方案:   LevelsHunter Pro 记录每个K线的水平。您只需点击历史中的任何一根K线,就能准确看到当时的成交量分布图。 如何在交易中使用 1. 改善实时入场 您看到一个买入信号。价格接近 POC 或 VAH 水平。您该怎么办? 开启   历史模式 ,快速检查一小时前或昨天在同一水平上价格的表现。如果一小时前价格从 POC 反弹 — 该水平有效。如果突破了 — 最好远离。 一个具体的策略示例: 您交易 VAH 向上突破。价格正在测试 VAH。您点击同一根K线
Here   our more valuable tools SMC Trend Trading   ,  Easy SMC Trading  ,  Institutional SMC Architect Volume Analysis Tools  ,  Volume flow Profile  ,  Market volume profile  , FVG with Volume  , Liquidity Heatmap Profile  ,  Volume Spread Analysis 2. Key Features Dynamic Filtering : The core feature. As soon as the current price crosses a historical liquidity level, that level disappears. This reduces chart clutter and prevents you from trading off "dead" support/resistance. Liquidity Heatma
THE PRICE WILL BE SUCH ONLY FOR THE FIRST 100 ORDERS, AFTER THAT, FOR EVERY 100 ORDERS, THE PRICE WILL INCREASE BY 20% COMPARED TO THE PREVIOUS ONE!!! What is NEXUS? NEXUS is a professional indicator for MetaTrader 5, designed to show the real volume flow and the balance between buyers and sellers in the market. The indicator analyzes price and volume movements to detect the moments when the market changes direction and large participants begin to accumulate or unload positions. Key Features
Honest Breakeven
Konstantin Gruzdev
Indicator gives an honest picture of changes in breakeven levels for transactions throughout the account history, and not just for open positions (screenshot 1). Accurate calculation of levels, taking into account accrued commissions, fees and swaps, allows you to evaluate trading results both visually and in Expert Advisors (screenshot 2). For Expert Advisors, the indicator in its standard form provides not only the break-even level, but also the number of positions, volume, and all additional
Spike Blast Pro
Israr Hussain Shah
Here   our more valuable tools SMC Trend Trading   ,  Easy SMC Trading  ,  Institutional SMC Architect Volume Analysis Tools  ,  Volume flow Profile  ,  Market volume profile  , FVG with Volume  , Liquidity Heatmap Profile  ,  Volume Spread Analysis Spike Blaster Pro is a next-generation MT5 indicator designed specifically for synthetic markets. It works seamlessly on Boom Index and Weltrade Index , providing traders with sharp, reliable spike detection signals. What makes Spike Blaster Pro po
ALIEN Dashboard
Youssef Esseghaiar
ALIEN DASHBOARD FULL EDITION – Professional ICT & Precision Trading Dashboard for MT5 ( HYBRID ENGINE ) Overview The   Alien Dashboard Full Edition   is a comprehensive, all‑in‑one technical indicator for MetaTrader 5 that merges the most powerful concepts from Inner Circle Trader (ICT) methodology with advanced precision‑entry logic, multi‑timeframe analysis, and an intuitive on‑chart dashboard. Designed for serious traders who want to visualise institutional order flow, identify high‑probabili
Introducing "X Marks the Spot" – Your Ultimate MetaTrader 5 Indicator for Perfect Trades! Are you tired of the guesswork in trading? Ready to take your MetaTrader 5 experience to a whole new level? Look no further – "X Marks the Spot" is here to revolutionize your trading strategy! What is "X Marks the Spot"? "X Marks the Spot" is not just another indicator – it's your personal trading compass that works seamlessly on all timeframes . Whether you're a beginner or an experienced trader,
MR Volume Profile 5
Sergey Khramchenkov
The "MR Volume Profile 5" indicator is a charting tool that displays trading volume at different price levels rather than time intervals. A key concept in volume profile is the point of control (POC)—the price level with the highest volume traded during the session or time range. While tools like VWAP or OBV provide volume trends, the "MR Volume Profile 5" indicator offers granular detail about where the most market activity occurs at specific price levels. This makes it a more precise tool for
VPO Profile MT5
Kyra Nickaline Watson-gordon
5 (2)
Definition : VPO is a Volume Price Opportunity. Instead of using bars or candles with an Open, High, Low, and Close price, each "bar" in a Market Profile is represented by horizontal bars against the price It is called Market Profile terminology. In other words volume-price-opportunity (VPO) profiles are histograms of how many volumes were traded at each price within the span of the profile. By using a VPO chart, you are able to analyze the amount of trading activity, based on volume, for each
该产品的买家也购买
ARIPoint
Temirlan Kdyrkhan
1 (1)
ARIPoint is a powerful trading companion designed to generate high-probability entry signals with dynamic TP/SL/DP levels based on volatility. Built-in performance tracking shows win/loss stats, PP1/PP2 hits, and success rates all updated live. Key Features: Buy/Sell signals with adaptive volatility bands Real-time TP/SL/DP levels based on ATR Built-in MA Filter with optional ATR/StdDev volatility Performance stats panel (Success, Profit/Loss, PP1/PP2) Alerts via popup, sound, push, or email Cu
PrimeScalping
Temirlan Kdyrkhan
PrimeScalping is a powerful trading companion designed to generate high-probability entry signals with dynamic TP/SL/DP levels based on volatility. Built-in performance tracking shows win/loss stats, PP1/PP2 hits, and success rates — all updated live. Key Features: Buy/Sell signals with adaptive volatility bands Real-time TP/SL/DP levels based on ATR Built-in MA Filter with optional ATR/StdDev volatility Performance stats panel (Success, Profit/Loss, PP1/PP2) Alerts via popup, sound, push, or e
Meravith Scanner
Ivan Stefanov
5 (2)
MERAVITH SCANNER 是一款适用于 MetaTrader 5 的专业金融市场指标,将多种分析工具整合为一个统一的系统。它基于专有的成交量加权平均价格(VWAP)方法自动完成所有计算,完全消除主观判断。 该指标适用于所有资产类别(外汇、股票、指数、大宗商品、加密货币)以及从 M1 到 Monthly 的所有时间周期。其核心原理是价格跟随成交量。MERAVITH 识别机构资金成交量的集中区域,并从该集中区域中推导出数学上精确的价格水平。它不预测,不推测。它只计算。 使用 MERAVITH SCANNER,您可以在 2–3 分钟内扫描全部 28 个主要外汇货币对的所有时间周期。您也可以扫描任何您选择的市场——例如,大约 100 只股票约需 10 分钟。 该指标计算耗尽水平、平衡线、偏差、统计水平以及目标投射。 图表元素 Origin Point 标记所有计算的起始位置。指标会自动将其放置在最佳位置。红色标签(TOP)表示市场高点并带有看跌倾向。绿色标签(BOTTOM)表示市场低点并带有看涨倾向。 Sentiment Line 是一条动态曲线,反映基于成交量加权计算得出的市场情绪。
SmartScalping
Temirlan Kdyrkhan
SmartScalping is a powerful trading companion designed to generate high-probability entry signals with dynamic TP/SL/DP levels based on volatility. Built-in performance tracking shows win/loss stats, PP1/PP2 hits, and success rates — all updated live. Key Features: Buy/Sell signals with adaptive volatility bands Real-time TP/SL/DP levels based on ATR Built-in MA Filter with optional ATR/StdDev volatility Performance stats panel (Success, Profit/Loss, PP1/PP2) Alerts via popup, sound, push, or e
ScalpPoint
Temirlan Kdyrkhan
ScalpPoint is a powerful trading companion designed to generate high-probability entry signals with dynamic TP/SL/DP levels based on volatility. Built-in performance tracking shows win/loss stats, PP1/PP2 hits, and success rates — all updated live. Key Features: Buy/Sell signals with adaptive volatility bands Real-time TP/SL/DP levels based on ATR Built-in MA Filter with optional ATR/StdDev volatility Performance stats panel (Success, Profit/Loss, PP1/PP2) Alerts via popup, sound, push, or emai
TrendProMaster
Temirlan Kdyrkhan
MasterTrend Indicator for MT5 A powerful trend-following and signal-evaluation tool MasterTrend   is a custom MT5 indicator that combines Moving Averages and ATR-based risk/reward logic to generate clear buy/sell signals. It visualizes dynamic SL/TP levels, evaluates past trade outcomes, and displays win/loss statistics in a clean on-chart panel. Key features include: Buy/Sell signals based on MA crossovers ATR-based SL/TP1/TP2/TP3 levels with visual lines and labels Signal outcome tracking wit
MasterTrend
Temirlan Kdyrkhan
MasterTrend Indicator for MT5 A powerful trend-following and signal-evaluation tool MasterTrend   is a custom MT5 indicator that combines Moving Averages and ATR-based risk/reward logic to generate clear buy/sell signals. It visualizes dynamic SL/TP levels, evaluates past trade outcomes, and displays win/loss statistics in a clean on-chart panel. Key features include: Buy/Sell signals based on MA crossovers ATR-based SL/TP1/TP2/TP3 levels with visual lines and labels Signal outcome tracking wit
ARICoins
Temirlan Kdyrkhan
ARICoin is a powerful trading companion designed to generate high-probability entry signals with dynamic TP/SL/DP levels based on volatility. Built-in performance tracking shows win/loss stats, PP1/PP2 hits, and success rates all updated live. Key Features: Buy/Sell signals with adaptive volatility bands Real-time TP/SL/DP levels based on ATR Built-in MA Filter with optional ATR/StdDev volatility Performance stats panel (Success, Profit/Loss, PP1/PP2) Alerts via popup, sound, push, or email Cust
Euro Escalper
Cristofher Robles
Euro Escalper— Zhuan Ye Ji Gou Ji Tou Pi Zhi Biao Euro Escalper shi yi kuan gao xing neng jiao yi zhi biao, zhuan wei xu yao ji gou ji jing zhun ru chang de jiao yi zhe she ji. Shi yong yu he cheng zhi shu (Deriv), wai hui ji MetaTrader 5 shang de ren he zi chan. Jie he le ji yu Fibonacci de liu dong xing qu yu, nei zhi SuperTrend yin qing he shi shi zhuan ye kong zhi mian ban. Zhu Yao You Shi Wu Chong Hui: Xin hao jian tou jin zai K xian shou pan shi chu xian, yong yuan bu hui yi dong huo xiao
IVISTscalp5
Vadym Zhukovskyi
5 (6)
[iVISTscalp5]:通过时间研究市场行为的实验室 TLV Framework | Liquidity Activation Points ⸻ 项目概述 iVISTscalp5 是在 VISTmany 项目框架下开发的多层级时间与价格结构指标。 该系统通过 Liquidity Activation Points(时间激活点 / timings)预测: 市场启动时间 方向 运动范围 iVISTscalp5 指标可使用默认参数应用于任何金融工具。 ⸻ 实际价值 iVISTscalp5 并不是作为传统技术指标而开发的。 它的核心理念是: 让任何人都能够通过“时间”研究市场行为。 ⸻ Time Language VISTmany (TLV) — 项目的核心概念 t(p) t(p) 是 timings 被激活的价格水平。 ⸻ p(p) p(p) 是 iVISTscalp5 指标构建的核心价格水平。 最强的市场反应通常出现在: t(p) 与 p(p) 相互作用时。 ⸻ 在 TLV(Time Language VIST
# Red and Green Light 智能交易信号指标 ## 产品简介 **Red and Green Light** 是一款基于T3多阶平滑算法的专业交易信号指标,集成了可视化红绿灯系统、智能信号识别、风险提醒和多重警报功能。无论您是手动交易者还是EA开发者,这款指标都能帮助您更精准地把握市场机会,有效规避逆势交易风险。 ### 核心优势 - **精准信号** :T3算法过滤噪音,捕捉真实趋势 - **直观可视化** :红绿灯系统一目了然 - ️ **风险保护** :自动检测逆势交易 - **多重警报** :弹窗、声音、推送通知 - **高度自定义** :文字、颜色、布局完全可调 - **实时更新** :5秒刷新,状态同步 --- ## 核心功能 **1. T3算法** :Tim Tillson/Fulks-Matulich,6阶平滑,动态通道。参数:周期6-21,Hot 0.5-0.8,多种价格类型。 **2. 信号识别** :N根K线收盘价高于T3上沿通道(T3_1u/2u/3u/5u)时买入。N根K线收
Pan PrizMA CD Phase
Aleksey Panfilov
The Expert Advisor and the video are attached in the Discussion tab . The robot applies only one order and strictly follows the signals to evaluate the indicator efficiency. Pan PrizMA CD Phase is an option based on the Pan PrizMA indicator. Details (in Russian). Averaging by a quadric-quartic polynomial increases the smoothness of lines, adds momentum and rhythm. Extrapolation by the sinusoid function near a constant allows adjusting the delay or lead of signals. The value of the phase - wave s
Классификатор силы тренда. Показания на истории не меняет. Изменяется классификация только незакрытого бара. По идее подобен полной системе ASCTrend, сигнальный модуль которой, точнее его аппроксимация в несколько "урезанном" виде, есть в свободном доступе, а также в терминале как сигнальный индикатор SilverTrend . Точной копией системы ASCTrend не является. Работает на всех инструментах и всех временных диапазонах. Индикатор использует несколько некоррелируемых между собой алгоритмов для класси
FFx Universal Strength Meter PRO is more than a basic strength meter. Instead of limiting the calculation to price, it can be based on any of the 19 integrated strength modes + 9 timeframes. With the FFx USM, you are able to define any period for any combination of timeframes. For example, you can set the dashboard for the last 10 candles for M15-H1-H4… Full flexibility! Very easy to interpret... It gives a great idea about which currency is weak and which is strong, so you can find the best pai
The FFx Universal MTF alerter shows on a single chart all the timeframes (M1 to Monthly) with their own status for the chosen indicator. 9 indicators mode (MACD-RSI-Stochastic-MA-ADX-Ichimoku-Candles-CCI-PSAR). Each can be applied multiple times on the same chart with different settings. Very easy to interpret. Confirm your BUY entries when most of the timeframes are showing green color. And confirm your SELL entries when most of the timeframes are showing red color. 2 Alert Options : input to s
FFx Watcher Pro MT5
Eric Venturi-Bloxs
The FFx Watcher PRO is a dashboard displaying on a single chart the current direction of up to 15 standard indicators and up to 21 timeframes. It has 2 different modes: Watcher mode: Multi Indicators User is able to select up to 15 indicators to be displayed User is able to select up to 21 timeframes to be displayed Watcher mode: Multi Pairs User is able to select any number of pairs/symbols User is able to select up to 21 timeframes to be displayed This mode uses one of the standard indicators
FFx Patterns Alerter gives trade suggestions with Entry, Target 1, Target 2 and StopLoss .... for any of the selected patterns (PinBar, Engulfing, InsideBar, OutsideBar) Below are the different options available: Multiple instances can be applied on the same chart to monitor different patterns Entry suggestion - pips to be added over the break for the entry 3 different options to calculate the SL - by pips, by ATR multiplier or at the pattern High/Low 3 different options to calculate the 2 TPs -
FFx Basket Scanner MT5
Eric Venturi-Bloxs
MetaTrader 4 version available here : https://www.mql5.com/en/market/product/24881 FFx Basket Scanner is a global tool scanning all pairs and all timeframes over up to five indicators among the 16 available. You will clearly see which currencies to avoid trading and which ones to focus on. Once a currency goes into an extreme zone (e.g. 20/80%), you can trade the whole basket with great confidence. Another way to use it is to look at two currencies (weak vs strong) to find the best single pairs
MetaTrader 4 version available here: https://www.mql5.com/en/market/product/25793 FFx Pivot SR Suite PRO is a complete suite for support and resistance levels. Support and Resistance are the most used levels in all kinds of trading. Can be used to find reversal trend, to set targets and stop, etc. The indicator is fully flexible directly from the chart 4 periods to choose for the calculation: 4Hours, Daily, Weekly and Monthly 4 formulas to choose for the calculation: Classic, Camarilla, Fibonac
ClassicSBA
Umri Azkia Zulkarnaen
this indicator very simple and easy if you understand and agree with setup and rule basic teknical sba you can cek in link : please cek my youtube channel for detail chanel : an for detail info  contact me  basicly setup buy (long) for this indicator is Magenta- blue and green candle or magenta - green  and green candlestik and for setup sell (short) is Black - yellow - and red candle or black - red  and red candlestik
Pendiente de Precio
Cesar Juan Flores Navarro
Indicador en base a la pendiente de la linea de precio, dibuja una línea de color cuando sube a base de los precios que previamente has sido procesados o linealizados, y cuando baja la pendiente la linea linealizada toma otro color. En este caso se a considerado 6 lineas de diferentes procesos desde pendientes largas hacia las cortas, observándose que cuando coincidan las pendientes se produce un máximo o mínimo, lo que a simple vista nos permitirá hacer una COMPRA O VENTA.
WanaScalper
Isaac Wanasolo
1 (1)
A scalping indicator based on mathematical patterns, which on average gives signals with relatively small SL, and also occasionally helps to catch big moves in the markets (more information in the video) This indicator has three main types of notifications: The first type warns of a possible/upcoming signal on the next bar The second type indicates the presence of a ready signal to enter the market/open a position The third type is for SL and TP levels - you will be notified every time price re
Fibonacci Multiple 12
Cesar Juan Flores Navarro
Fibonacci Múltiple 12, utiliza la serie fibonacci plasmado en el indicador fibonacci, aumentadolo 12 veces según su secuencia. El indicador fibonacci normalmente muestra una vez, el presente indicador se mostrara 12 veces empezando el numero que le indique siguiendo la secuencia. Se puede utilizar para ver la tendencia en periodos cortos y largos, de minutos a meses, solo aumentado el numero MULTIPLICA.
Recommended TimeFrame >= H1. 100% Non Repainted at any moment.  Use it carefully, only with Trend Direction. Trading Usage: 2 Variants: as Range System or as BreakOut System (Both Only With Trend Direction)::: (Always use StopLoss for minimise Risk); [1] as Range System: (Recommended) in UP TREND:  - BUY in Blue Line , then if price goes down by 50 points (on H1) open Second BUY.   Close in any Profit you wish: TrailingStop(45 points) or Close when Price touches upper Gold Line. in DOWN TREND
Linea Horizontal Inteligente
Cesar Juan Flores Navarro
En base a cálculos matemáticos de determino una linea Horizontal que cruza a todas las señales de trading, mostrando los máximos y mínimos. La linea horizontal parte en dos las subidas y bajadas de las señales de trading, de tan manera que es fácil identificar los máximos y mínimos, y es inteligente por que es sensible a las subidas y bajadas, afín de no quedarse en un solo lado por siempre, trabaja excelentemente con otros indicadores suavizadores ya que les garantiza que en un intervalo de tie
Spike Detector
Tete Adate Adjete
this indicator is a Spike detector indicator, it is specially designed to trade Boom 1000, Boom 500, Crash 1000 and Crash 500 We recommend using it on Deriv Boom and Crash indices only Its setting is intuitive, familiar, easy to use it has notification functions; audible notifications and push notifications. this tool is simple to use, easy to handle This update is based on different strategies for spikes
Limitless MT5
Dmitriy Kashevich
Limitless MT5 is a universal indicator suitable for every beginner and experienced trader. works on all currency pairs, cryptocurrencies, raw stocks Limitless MT5 - already configured and does not require additional configuration And now the main thing Why Limitless MT5? 1 complete lack of redrawing 2 two years of testing by the best specialists in trading 3 the accuracy of correct signals exceeds 80% 4 performed well in trading during news releases Trading rules 1 buy signal - the ap
Escalera Inteligente
Cesar Juan Flores Navarro
Indicador en MQL5, recibe la información del precio SUAVIZADO, lo procesa anulando los picos inteligentemente, y el resultado lo envía al desarrollo de la escalera que iniciara y subirá o bajara según el peldaño o INTERVALO ingresado Ingreso PERIODO = 50 (variar segun uso) Ingreso MULTIPLICA AL PERIODO = 1 (variar segun uso) Segun la configuración la escalera puede pegarse o separarse de los precios,, Se aplica toda la linea de tiempo, y a todas las divisas, etc.  
Fibonacci Suavizado
Cesar Juan Flores Navarro
Indicador en MQL5, que obtiene el promedio de 10 EMAS, que son alineadas según Fibonacci, obteniendo un promedio, que sera suavizado.  Se puede ingresar un numero desde 2 a N, que multiplica a los EMA-Fibonacci. Funciona en cualquier criptomoneda, etc. etc... pudiendo calcular el futuro segun la tendencia de las EMAS. Funciona excelentemente en tramos largos, determinando exactamente el mejor inicio/salida. El precio inicial por apertura sera por un periodo de tiempo, luego aumentará.
QuantXSTocks Trading Range Indicator for MT5: INSTRUCTIONS TO USE OUR INDICATOR:- User needs to take trade on Arrow or after an Arrow CandleStick, You can achieve up-to 35-125 pips target by this Indicator. Best Timeframes for Stocks and Indices are M30 and H1: AMAZON M30 (50 pips) TESLA M30 (50 pips) APPLE M30 (50 pips) ADOBE M30 (50 pips) NASDAQ100 H1 (125 pips) The above are the approximate amount of pips you can achieve by this Indicator, Green arrow appears to be buy arrow while the Red ar
筛选:
无评论
回复评论