TMA Centered Bands Indicator MT5
- Индикаторы
- Eda Kaya
- Версия: 2.1
TMA-Centered Bands Indicator MetaTrader 5
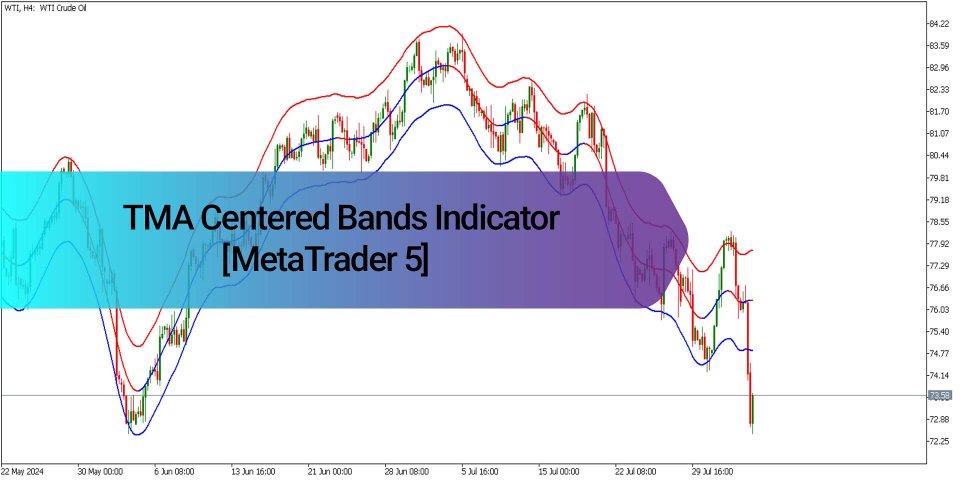
The TMA Centered Bands indicator, available on MetaTrader 5, utilizes a Moving Average (MA) represented by three bands on the chart to identify prevailing market trends. During bullish trends, the middle band turns blue, while in bearish trends, it shifts to red.
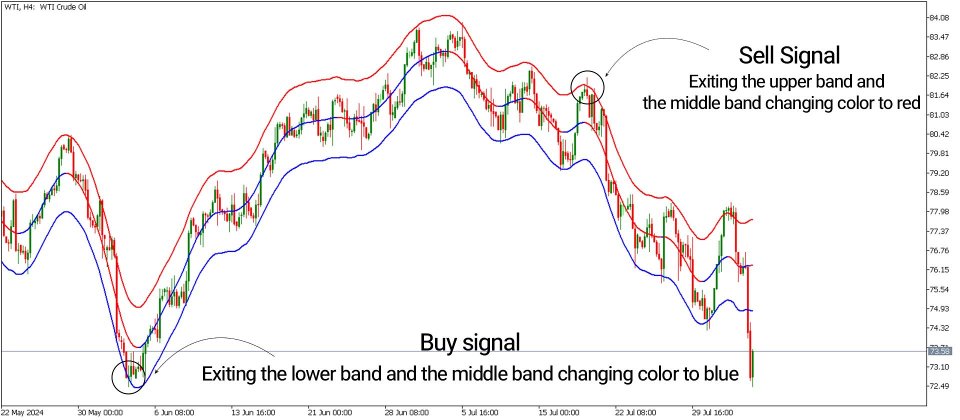
When the price moves above the upper band, a potential reversal to the downside may occur, suggesting a possible sell opportunity. Likewise, a drop below the lower band often indicates a potential upward reversal, hinting at a buy signal. These visual cues support traders in identifying potential entry and exit points based on trend changes and band interactions.
«Indicator Installation & User Guide»
MT5 Indicator Installation | TMA Centered Bands Indicator MT4 | ALL Products By TradingFinderLab | Best MT5 Indicator: Refined Order Block Indicator for MT5 | Best MT5 Utility: Trade Assistant Expert TF MT5 | TP & SL Tool: Risk Reward Ratio Calculator RRR MT5 | Prop Firm Protector: Trade Assist Prop Firm Plus TF Expert MT5 | Money Management + DrawDown Protector: Trade Panel Prop Firm Drawdawn Limiter Pro MT5
Indicator Table
| Indicator Category | Signal and Forecast – Bands & Channels |
| Platforms | MetaTrader 5 |
| Trading Skills | Beginner |
| Indicator Types | Reversal – Breakout |
| Timeframe | Multi Timeframe |
| Trading Style | Scalper – Day Trader – Intraday – Swing Trader |
| Trading Instruments | All Markets |
Overview
Identifying the trend direction is vital in all analytical trading styles. The TMA (Triangular Moving Average) indicator, based on Moving Averages, outlines a price range that can suggest both the current and future trend direction. This setup is visually similar to Bollinger Bands, with bands acting as dynamic support and resistance against price fluctuations.
Uptrend Signals (Buy Positions)
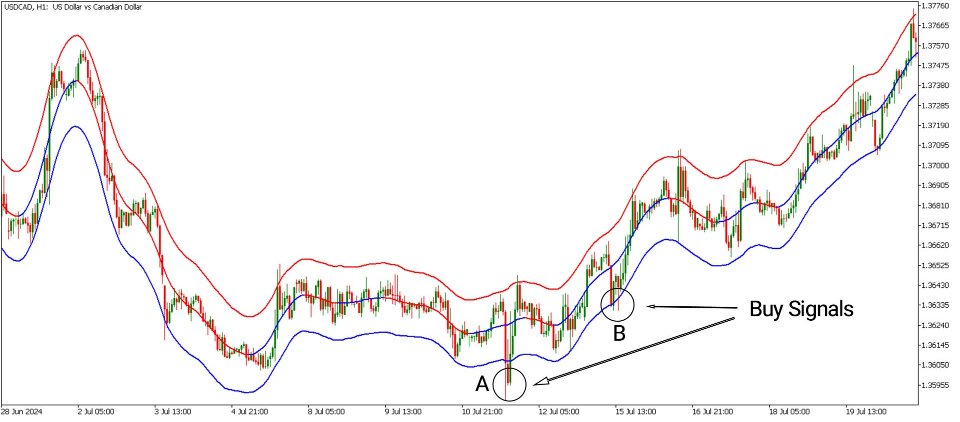
In the chart below, the US Dollar/Canadian Dollar (USDCAD) pair is shown on the 1-hour timeframe. At points A and B, the price dips below the lower band before moving back inside it, while the middle band turns blue. This scenario generates a bullish trend signal, prompting traders to consider buy positions—especially when supported by additional confirmations like candlestick patterns.
Downtrend Signals (Sell Positions)
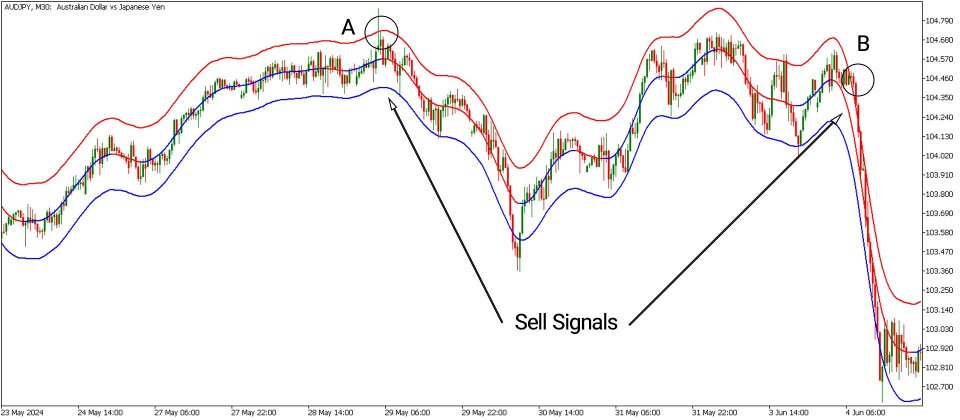
The following chart displays the Australian Dollar/Japanese Yen (AUDJPY) pair on the 30-minute timeframe. At points A and B, the price rises above the upper band before returning inside the band, accompanied by the middle band turning red. This indicates a bearish trend signal, suggesting the potential for sell positions—particularly when backed by reversal patterns in shorter timeframes.
Settings of the TMA Indicator
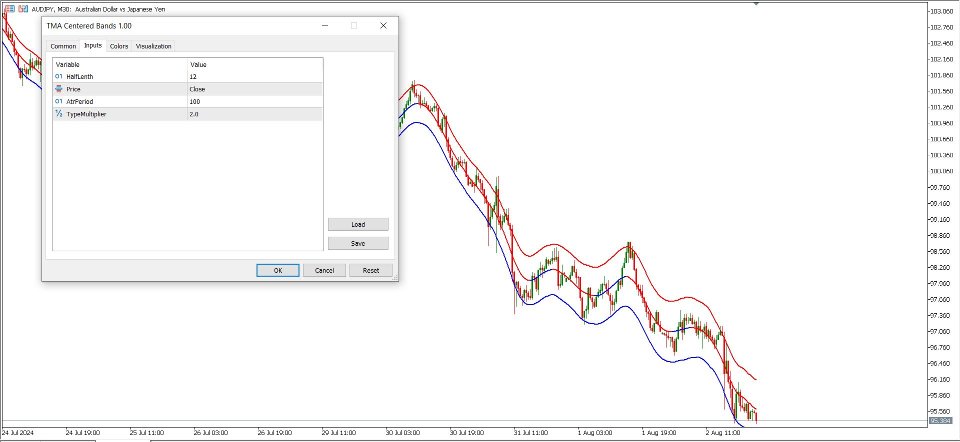
- HalfLength: Set to 12, this defines the number of candles used for averaging, affecting the indicator’s responsiveness to recent price changes.
- Price: Configured to use the 'Close' price, meaning it calculates the moving average based on the closing prices of candles.
- AtrPeriod: Set to 100, this defines the period used for the Average True Range (ATR), smoothing out volatility readings for a clearer picture of market conditions.
- TypeMultiplier: With a value of 2, this setting controls the width between the central and outer bands. A higher multiplier widens the bands, allowing more price action to occur within them.
Conclusion
The TMA Centered Bands indicator is suitable for all trading strategies, particularly those based on trend analysis. Its bands serve as reliable visual guides to trend direction. Traders can identify market trends and seek confirmation on lower timeframes before entering a trade.
This approach ensures alignment with overall market direction, potentially increasing the success rate of trading strategies.























Пользователь не оставил комментарий к оценке