MetaTrader 5용 기술 지표 - 52

In the SM Trend Cloud indicator, two buffers are used for calculation and rendering. One of the main advantages of this tool is its simplicity, while its signals can be quite accurate. But, again, we have a trend indicator in front of us, and therefore it will generate false signals mainly in conditions of consolidation. At the same time, I do not advise using the indicator in its own form, there is no way to do without additional filters. As an additional signal, I suggest using ZigZag indicat
FREE

Initialize RSI with period 2 above the closing price. Initialize EMA with period 20 above the closing price. Buy condition: RSI < 15 (oversold). Closing price of 4 consecutive candles > EMA (uptrend). Place BUY signal at the bottom of the candle. Sell condition: RSI > 85 (oversold). Closing price of 4 consecutive candles < EMA (downtrend). Place SELL signal at the top of the candle
FREE

Торговая панель с основной необходимой информацией на графике. Панель отображает: - Баланс и свободные средства - Маржу - Количество ордеров на продажу и их общий объем (по той паре на которой установлен) - Количество ордеров на покупку и их общий объем (по той паре на которой установлен ) - Количество отложенных ордеров и их направление (по той паре на которой установлен ) - Просадка в % и в деньгах на текущий момент - Расчет % стопа при указании лота и размер стопа в пунктах - Оповещения при с
FREE

The indicator is getting the four most important trading sessions: New York London Sydney
Tokyo The indicator auto calculate the GMT time. The indicator has buffers that can be used to get the current session and the GMT.
You can use it as stand alone indicator and you can turn the draw off and call it from your EA. INPUTS Max Day: Max days back to get/draw. London Session On: Show/Hide London Session. New York Session On: Show/Hide New York Session. Sydney Session On: Show/Hide Sydney Session
FREE

This indicator changes the standard MetaTrader 5 candles to candles at the selected BID, ASK or Average price (BID+ASK)/2. Simply attach the indicator to the chart and select the prices to plot the candles or bars. Indicator Parameters ENUM_DRAW_TYPE - plot candles or bars on the chart For the price - the price for plotting the candles or bars The chart returns to its normal visualization mode after removing the indicator.
FREE
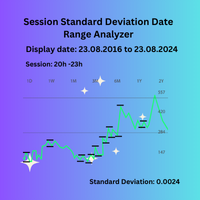
Session Standard Deviation Date Range Analyzer: Evaluate the standard deviation of each bar's price (high, low, close, open, weighted, median, and typical) within defined trading sessions and date ranges, providing detailed insights into price volatility and market behavior. **Note:** When the trading platform is closed, the indicator may not load correctly. To ensure it works, you may need to load the indicator, unload it, and then load it again. **Note:** : This indicator can only be used wit
FREE

Dynamic Range Pro – Indicator Dynamic Range Pro is a technical indicator designed to visualize key market zones by plotting a dynamic channel based on price extremes. Main Features: Dynamic channel calculated using the highest highs and lowest lows over a specified period. Midline representing price equilibrium. Compatible with multiple instruments and timeframes. Inputs: PeriodPR: Sets the number of bars used for channel calculation. Functionalities: Highlights potential breakouts when price mo
FREE

Product Concept This indicator is designed to identify and confirm the strength of a prevailing trend by combining momentum analysis with statistical price deviation. It serves as a comprehensive filter to distinguish between high-probability trend continuations and market exhaustion phases.
Key Technical Features
Adaptive Smoothing: Uses an advanced mathematical algorithm to reduce lag without sacrificing signal accuracy.
Multi-Filter Logic: Cross-references multiple time-based momentum calcul
FREE

TS Time Remaining - Indicador de Cuenta Regresiva para Velas en MetaTrader 5 El TS Time Remaining es un indicador gratuito diseñado para la plataforma MetaTrader 5 que permite a los traders visualizar en tiempo real el tiempo restante de la vela actual. Esta herramienta es especialmente útil para aquellos operadores que trabajan con estrategias basadas en la acción del precio y patrones de velas japonesas, ya que les permite anticiparse al cierre de la vela y tomar decisiones con mayor precisión
FREE

INDICATOR: GEN RSI Hunter Developer: gedeegi General Description GEN RSI Hunter is a technical indicator based on the Relative Strength Index (RSI) that automatically detects potential BUY and SELL signals based on overbought/oversold conditions and price reversal patterns. This indicator is perfect for traders who want to capture short-term swing opportunities using price action confirmation and price patterns like Double Top and Double Bottom. Signals are confirmed by breakout candles and val
FREE

The euro index (Euro Currency Index, EURX) is an average indicator of changes in the exchange rates of five currencies (US dollar, British pound, Japanese yen, Swiss franc and Swedish krona) against the euro. Displays a Eur X chart in a seperate window below the main chart. YOUR BROKER MUST HAVE THESE SYMBOLS FOR THE INDICATOR TO WORK Based on EUR/USD, EUR/JPY, EUR/GBP, EUR/CHF and EUR/SEK All these pairs must be added to Market Watch for the indicator to work correctly As this is calculated usi
FREE

AVERAGE DAILY RANGE INFO INDICATOR IS SIMPLY A NICE WAY TO GLANCE AT THE RANGE FOR A SPECIFIED NUMBER OF DAYS. IT SHOWS THE INFORMATION IN A SIMPLIFIED FORMAT BY DEFAULT RIGHT UPPER CORNER OF THE CHART WITH OPTIONS TO PLACE IT ANYWHERE ONE PLEASE. ITS SIMPLE YET EFFECTIVE. YOU CAN CHANGE THE PERIOD, CUSTOMIZE THE COLOR AND CHANGE THE FONT TYPE OR FONT SIZE IN THE SETTINGS TO SUIT YOUR STYLE.
FREE
Hi Traders, RSI and Stochastic are among the most popular indicators used to measure momentum and help identify overbought and oversold conditions. This indicator displays two optional RSI and Stochastic values on your chart, helping you save chart space and keep things clean and organized. You can set your desired upper and lower thresholds for RSI and Stochastic to monitor conditions. If the RSI (or Stochastic) value is between the upper and lower thresholds, the text color will remain your de
FREE

Volume Steps (Volume as OHLC candles) Volume Steps displays volume as candlestick-style OHLC bars in a separate subwindow. Each candle compares current volume to the previous bar, making volume shifts and step-changes easier to read than standard histograms. Key features: Volume shown as OHLC candles (open = previous volume, close = current volume) Selectable volume type : Tick Volume or Real Volume (if provided by the broker) Two color modes : Match price candle direction (bull/bear) Independen
FREE

Non-proprietary study of Joe Dinapoli used for trend analysis. The indicator gives trend signals when the fast line penetrates the slow line. These signals remain intact until another penetration occurs. The signal is confirmed at the close of the period. It is applicable for all timeframes. Inputs lnpPeriod: Period of moving average. lnpSmoothK: %K period. lnpSmoothD: %D period. ********************************************************************************
FREE

Global Session 4X Indicator Global Session 4X is a visual indicator that displays active Forex trading sessions around the world in real time. Designed with precision and respect for market diversity, it covers financial hubs such as London, New York, Tokyo, Sydney, São Paulo, Istanbul, Riyadh, Toronto, and more. Each session is shown as a color-coded band highlighting the most traded currency pairs in that region. The layout is clean, modern, and fully customizable — traders can choose which se
FREE
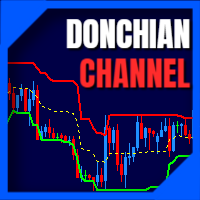
The donchian channel indicator might just be the best fit for you
Trading in derivative products such as futures, options, CFD's, forex and certificates contains significant risk. These products are not suitable for every investor. Investors could potentially lose all or more than the original investment. If anything, only money equal to personal risk capital should be used and can be lost without jeopardizing financial security or lifestyle. Partially or fully automated trading programs can
FREE

--- StudentK Sync Chart --- 1. Move charts at the same time 2. Cross check among different Symbols and Timeframes 3. Plan your own trading strategies
=== Simple (Free) Version ===
1. Allow USDJPY only
2. Support M5 and M15
3. * Contact StudentK for unlocking all timeframes *
--- Context --- StudentK is not indicated as a master or K Sir for knowledgeable person who claims for winning all the time. (But lots of traders should know the fact that it is rarely truth, especially in fluctuated per
FREE

One of the simplest Pivot Point indicator, easy to operate, and most complete for a single chart in determining Resistance and Support level lines.
In single chart, it will show R&S Level Line with 5 popular types of Pivot Point, Highest&Lowest of closing price Include the Trend and up to 3 Time Frames.
Five types (Floor, Woodie, Camarilla, DeMark, & Fibonacci) of popular Pivot Points in determining Resistance and Support levels. With just using simple button on the
FREE

MetaTrader 5 (MT5)용 Wormhole 시간대 지표는 단순한 거래 도구가 아닙니다. 그것은 금융 시장에서의 경쟁 우위입니다. 초보자와 전문가 모두를 염두에 두고 설계된 Wormhole은 데이터 분석과 의사결정 방식을 변화시켜 항상 한 걸음 앞서 나갈 수 있도록 도와줍니다. 왜 Wormhole 지표(무료)가 필요한가 경쟁자를 능가하십시오: 동일한 차트에서 두 가지 시간대를 동시에 볼 수 있다는 것은 항상 한 걸음 앞설 수 있다는 것을 의미합니다. 차트 간 전환을 더 이상 할 필요 없이 모든 필요한 정보가 바로 눈앞에 있습니다. 숨겨진 기회를 발견하십시오: 전통적인 시간대를 변형하고 다른 거래자들이 놓친 패턴을 발견하십시오. 5분 차트의 범위를 00:01에서 00:06으로 변경하여 00:00에서 00:05까지의 표준 시간 대신 분석할 수 있습니다. 이러한 미세한 변화는 독특한 시장 동향을 드러낼 수 있습니다. 실행 가능한 통찰을 얻으십시오: 트렌드, 반전 및 지지/저항 수준
FREE

A simple and efficient indicator that plots and updates the 50% of the current day, for those who use this point as a reference in day trading.
On trend days the 50% region tends to be a good resistance point, ideal for making new entries.
On non-trend days (sideways) the 50% region is great for carrying out positions.
In addition, for study or back-testing criteria, you can define the amount of previous days to be plotted by the indicator.
For questions or suggestions, please contact us. A
FREE

Es un indicador que no se repinta y que muestra la tendencia a corto plazo. contiene lo siguiente: Visual Mode MA Period MA Method MA Price
ATR Period Volatility Factor Offset Factor Use Break Use Envelopes Use Alert
cualquier sugerencia hagamelo saber en los comentarios y también colocar estrellas para postear más contenido, indicadores y advisor actualizadas
FREE

This indicator will show the the change of volumes via 2 lines of SMA: . Fast line (default is 5 candles) . Slow line (default is 13 candles) We can use the crossing point of fast line and slow line to know investors are interesting in current price or not. Pay attention: The crossing point is not signal for entry. Absolutely that we must use in combination with other indicators for sure. Parameters: . Fast line periods: the periods (candles) to calculate SMA of fast line . Slow line periods: th
FREE

Trading Guide MT5 Indicator - Ultimate Trading Psychology Assistant Description
The Trading Guide MT5 Indicator is a powerful psychological trading assistant designed to keep traders disciplined, focused, and emotionally balanced. This innovative indicator displays real-time motivational messages, trading rules, and analysis guidelines directly on your chart, with vibrant blinking colors to capture your attention and reinforce proper trading habits.
Key Features
Real-Time Trading Psychology
FREE
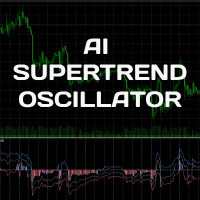
The AI SuperTrend Clustering Oscillator identifies three key outputs—bullish, neutral, and bearish—derived from variations between multiple SuperTrend indicators. FUNCTIONALITY The oscillator consists of three primary elements: Bullish Output : Represents the most optimistic signal, always the highest value. Bearish Output : Reflects the most pessimistic signal, always the lowest value. Consensus Output : Falls between the bullish and bearish outputs, serving as an overall trend indicator. A
FREE

Are you having trouble with too many events in the economic calendar? This reduces to the minimum number you need. You can filter by country code importance any key words and you can receive alerts before the set time of the event. ++++++++++++++ If country code is blank, display available code on the expert tab. You need to turn off the automatic calendar update setting in MT5. Any sound file of .wav format in Sounds directory. The length of keyword characters is limited by MT5.
FREE

The indicator displays the value of ROC (Rate of change) from the selected price or moving average as a histogram. You can plot the moving average ROC values for smoothing indicator.
Displayed Data ExtROC - rate of change ExtMAROC - smoothing line
Parameters You can change the price, on which the indicator is calculated.
Inputs InpMAPeriod - in case you want to calculate the moving average ROC, enter averaging period. Enter 1 for the calculation of the specified prices. InpMAMethod - smoothin
FREE

News Indicator. Shows the interest rate of 12 countries (Australia, Brazil, Canada, Mexico, euro zone, UK, India, New Zealand, Switzerland, United States, South Korea, Japan). It will help to analyze the impact of the interest rate on the exchange rate. It makes sense to set an indicator on large timeframes. To improve the information content, it makes sense to change the settings style of the indicator of the desired country, so that the line stands out from the total mass of indicators, as ind
FREE

TP Audio Alert is a MetaTrader 5 custom indicator that plays a sound automatically whenever a trade position is closed at Take Profit (TP) . This tool is perfect for traders who want to be notified instantly without constantly watching the chart. Key Features: Plays sound when a TP position is closed Lightweight and does not clutter the chart No visual elements (zero plotted indicators) Simple and easy to configure Compatible with all symbols and timeframes How to Change the Sound File: Pla
FREE

70% OFF SALE! Now only $39 (originally $99) The most profitable Daily Bias Strategy [EBP- 88% Proven Win Rate]
https://youtu.be/XiU9JHUM5NE?si=TRJzXKjfVNO4tdsh&t=422 Love it? Hate it? Let me know in a review! Feature requests and ideas for new tools are highly appreciated. :) Engulfing Fib Master is a powerful MetaTrader 5 indicator designed to detect high-probability bullish & bearish engulfing patterns and
automatically plot Fibonacci retracement levels for precise trade

Индикатор, показывающий моменты пересечения важных уровней индикатора RSI. Может быть использован для поиска моментов пересечения уровней для успешной торговли на отскок или по тренду.
Входные параметры Inform about finding the signal - параметр, отвечающий за получение уведомлений (Alert) о найденном сигнале. По умолчанию - нет RSI period - Период RSI для работы RSI Max - Значение максимальной границы RSI RSI Min - Значение минимальной границы RSI
FREE

Your swiss army knife to ancipate price reversals
This indicator anticipates price reversals analyzing bullish and bearish pressure in the market. The buying pressure is the sum of all the accumulation bars over a certain number of days, multiplied by the volume. The selling pressure is the sum of all of the distribution over the same number of bars, multiplied by the volume. It gives you a measure of the buying pressure as a percentage of the total activity, which value should fluctuate from 0
FREE

Only Exponential Moving Average at Close Price is used in standard Bulls Power limiting the possibilities of that indicator to some extent. Bulls Power Mod enables you to select from four Moving Averages and seven applied prices, thus greatly expanding the indicator's functionality.
FREE

Hyper DM, Moving Distance from Moving Averages is an indicator that allows you to define the distance in points of the upper and lower bands in relation to the moving average in the middle.
Its operation is simple, it has configuration parameters of the moving average of the middle and based on it and the defined distance parameters of the upper and lower bands, it is plotted in the graph.
FREE

Funciona como bandas de bollinger normais. Criado por Joe Ross, é um setup de maior risco por ser contra-tendência. Pode ser usado para Day Trade, Swing Trade e Position. Para identificar, é necessário inserir no gráfico as Bandas de Bollinger, com uma Média Móvel Simples de 20 períodos e largura (desvio) 2. Verifica-se um fechamento de determinado candle abaixo da banda inferior de Bollinger. Se o próximo candle fechar dentro das Bandas, marca-se a máxima dele. O rompimento dessa máxima será o
FREE

Media Móvel Grátis para uso em conjunto ao Diamond Indicator Atenção. Essa é a mm para conjugar ao indicador. Esse não é o indicador. Comprem o indicador que está tendo ótimos resultados. A seguir informações sobre o indicador: Indicador Para Opções Binarias. Usa dois gales. Instalar em mt5 Esse indicador é para ser usado no tempo de vela de 5 minutos e em M5. Este também funciona em M1, porém é mais eficiente em M5. Só descompactar e copiar os arquivos na pasta de dados do seu MT5. Arquivos
FREE

Limited Discount for Today at FREE Usual $150) Matrix Trading Indicator – Precision Trading at Its Best The Problem: Why Do Retail Traders Struggle? Many traders face common pitfalls that limit their profitability: Unclear Market Levels: Price reacts unpredictably, making it hard to pinpoint key support/resistance areas.
False Signals & Breakouts: Entering trades at the wrong time due to misleading indicators.
Lack of Confluence: Relying on a single indicator instead of a multi-layered s
FREE

Moving Spread – 실시간 시장 비용 모니터 평균 스프레드를 실시간으로 모니터링하고 고비용 기간의 거래를 피하세요. 이 지표의 기능 Moving Spread 는 시간이 지남에 따라 시장의 평균 스프레드(포인트 단위) 를 측정하여 그 변동을 보여줍니다. 이는 진입 비용이 너무 높을 때를 파악하는 데 필수적인 도구입니다. 이러한 상황에서는 거래 시작 전에 이미 수익이 줄어들 수 있습니다. 왜 이것이 중요한가요?
높은 스프레드는 시장 진입 및 청산 시 더 많은 비용을 지불한다는 것을 의미합니다. 이 지표는 이러한 순간을 식별하고 비용이 과도할 때 거래를 피하는 데 도움을 줍니다. 작동 방식 별도의 창에서 현재 스프레드를 표시 하며, 평균값을 나타내는 빨간색 선이 있습니다. 스프레드가 정의된 임계값(예: > 0)을 초과하면 자동 알림 을 제공합니다. 스캘퍼 및 당일 트레이더에게 이상적 이며, "블리딩"(지속적인 손실)로 인한 숨겨진 손실을 방지하는 데 도움이 됩니
FREE
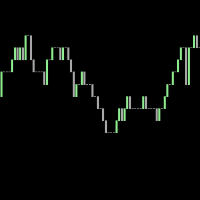
This is a tick indicator which compares the current bid price with the previous bid directly before it, and draws candles based on a comparison of the current ticks. It does not use historical ticks. Everything happens in real time, data moves from right to left, and the newest data arrives at the right. A trend line can be added which points in the direction of the price shifts.
FREE

During volatile market conditions brokers tend to increase spread. int OnCalculate ( const int rates_total, const int prev_calculated, const datetime &time[], const double &open[], const double &high[], const double &low[], const double &close[], const long &tick_volume[], const long &volume[], const int &spread[]) { int spread_array[];
FREE

The SpreadTracer and TimeLeft indicator is a powerful yet straightforward tool designed for traders who want to keep a close eye on market conditions directly on their chart. This custom indicator provides essential real-time information about the spread and candle time, making it easier to make informed trading decisions. Key Features: Current Spread Monitoring : The indicator constantly displays the current spread of the trading pair, helping you assess the cost of entering or exiting a positi
FREE

ForexBob Candle Timer Is an amazing countdown time indicator which shows the time remaining for next candle to open. It can be used on any timeframe. It helps to plan your next trading action.
Inputs are simple Color - To change the color of displaying time. Size - To set the size of font Next for settings are used to set the location of time Font - To change the font type.
Please check my other products here https://www.mql5.com/en/market/my
FREE

The "Price change from zero" indicator is designed to display price changes over a selected period in points.
1. The basic idea The indicator calculates the difference between the closing price on the current bar and the opening price on the bar set back by the Candle Period. The result is displayed as a line in a separate window.
2. Interpretation Positive value: The price has increased over the period.
Negative value: The price decreased during the period.
Zero value: The price has retur
FREE

The Average Cross System indicator is a versatile tool designed for traders using the MetaTrader 4 (MT4) platform. This indicator provides a straightforward yet effective way to identify potential buy and sell signals based on moving average crossovers, a widely used technical analysis strategy. Key Features: Moving Average Crossovers: The heart of the Average Cross System is the detection of moving average crossovers. It automatically identifies when a shorter-term moving average crosses above
FREE

The indicator displays the chart of an arbitrary combination of trading instruments, described by the entered arithmetic formula. Using the indicator. Add an indicator to any chart. Enter the formula as a string in the indicator's parameters. All symbols used in the formula must exactly match the names in the table "Market Overview" of the terminal. Example of the formula: (SIBN + SNGS) / 'RTS-3.19' + 2.5 * GAZP / LKOH Start the indicator The formula must meet the following requirements: The nam
FREE
Moving Average Color - Indicador Inteligente para MT5 Descrição Geral O Moving Average Color é um indicador avançado que combina média móvel tradicional com sistema visual inteligente de cores. O indicador muda automaticamente as cores da média móvel e das velas (candlesticks) baseado na posição do preço em relação à média, oferecendo uma análise visual clara e instantânea da tendência do mercado. Principais Características Funcionalidades Principais: Média Móvel Configurável : Suporte a
FREE

Indicador Volatilidade Histórica Indicador é um oscilador que faz o plot da volatilidade histórica de um ativo, representado pelas fórmulas: Volatilidade Histórica = Raiz quadrada da média das diferenças ao quadrado * Fator de anualização. Média das diferenças ao quadrado = soma de todas as diferenças de retorno diário / número total das diferenças. Retorno diário = (preço atual - preço anterior) / preço anterior. Nesse indicador estamos utilizando os preços de fechamento de cada barra e fazemos
FREE

The MWC COX indicator shows the extreme zones of net short/long positions of the Commitments of Traders Report released by the CFTC once a week for four periods of time. Default settings are periods of 12, 26, 52 and 156 weeks.
Additional Features Displays the sum of all 4 periods in one line MA, MOM and RSI indicators are integrated ( not in the MQL5 Version 1.0 ) Please make sure that you download the MWC_Demo.zip file and unpack it into [...]/MQL5/Files folder. -> www.myweeklycot.com/t
FREE
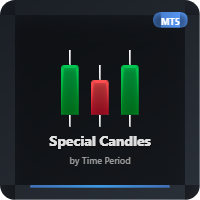
This indicator allows you to observe candle formation over a specific period, such as the Nasdaq, which starts at mid-hour. For example, for the first hour. The distance and size of the candle positioned on the right side can be adjusted. Color can also be assigned based on falling and rising candles. The needle can be made visible or invisible if desired. The body size can also be adjusted as desired.
FREE

The indicator converts two moving averages into histograms and paints their intersection area.
There is a shift trick setting, it is used to smooth the result of calculations. You can see the changes if you reduce this parameter to 1 (minimum value).
Available averages:
MA Simple MA Exponential MA LinearWeighted MA Smoothed DEMA TEMA and
RSI - as a bonus By default, the fast MA is displayed at the top of the histogram, and the slow one at the bottom. You can swap them if you like.
shift tr
FREE

Recomended broker: https://tinyurl.com/5ftaha7c Indicator used to monitor price fluctuations in the market and discover possible reversals through reversal points or divergences in the indicator. All assets and all timeframes. SEE OUR RESULTS ON INSTAGRAM: https://www.instagram.com/diogo.cansi/ TELEGRAM GROUP = https://t.me/robosdsc More information by email dscinvestimentos@gmail.com or by Whatsapp 55-991372299
FREE
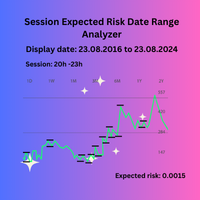
Session Expected Risk Date Range Analyzer: Analyzes price data across specified date ranges to provide detailed insights into financial risk and volatility, using each bar's price metrics for accurate risk assessment.
The Session Expected Risk Date Range Analyzer is a sophisticated tool designed to offer traders and analysts detailed insights into the expected financial risk across specific date ranges. Unlike traditional session-based analysis, this indicator focuses on calculating risk metr
FREE

The indicator draws two simple moving averages using High and Low prices. The MA_High line is displayed when the moving average is directed downwards. It can be used for setting a stop order for a sell position. The MA_Low line is displayed when the moving average is directed upwards. It can be used for setting a stop order for a buy position. The indicator is used in the TrailingStop Expert Advisor. Parameters Period - period of calculation of the moving average. Deviation - rate of convergence
FREE

A scrolling Market Ticker that displays price changes from all symbols in the Market Watch list. Provides an easy snapshot of symbol prices, and keeps scrolling automatically while you trade and analyse the chart.
Options include: - MTF, eg choose to show price changes of the daily chart, or the hourly - use the live candle or the recently completed - font and background coloring
FREE

# Power Assisted Trend Following Indicator
## Overview
The PowerIndicator is an implementation of the "Power Assisted Trend Following" methodology developed by Dr. Andreas A. Aigner and Walter Schrabmair. This indicator builds upon and improves J. Welles Wilder's trend following concepts by applying principles from signal analysis to financial markets.
The core insight of this indicator is that successful trend following requires price movements to exceed a certain threshold (typically a mul
FREE

**MA Distance Filter: Your Smart Trading Ally!** Discover the **MA Distance Filter**, a powerful MetaTrader 5 indicator designed to elevate your trading strategy! Easily spot precise **buy** and **sell** opportunities based on moving average crossovers and minimum distance thresholds.
**What it offers:** - **Striking visual signals**: Green arrows for buy and red for sell, displayed live on the latest candle. - **Dynamic moving averages**: Track the fast, slow, and optionally a third
FREE

Индикатор Envelopes gaussian - это стандартный Envelopes с обработкой фильтром Гаусса. Преимущество данного индикатора в меньшем запаздывание от стандартного индикатора.
Входные параметры: Period - период индикатора по умолчанию 14 Deviation - ширина канала по умолчанию 0.1 Shift - смещение индикаторных линий от цены в барах. По умолчанию 0 Индикатор пригоден для использования в советниках
Буфер 0 — верхняя линия индикатора;
Буфер 1 — нижняя линия индикатора;
FREE

If you like this product, please give it a 5 star rating as a token of appreciation.
This indicator plots horizontal lines on the chart representing the previous year’s high and low prices . These levels are widely used in technical analysis as major support/resistance references.
Automatically identifies the previous calendar year’s high and low . Plots horizontal lines on the chart at these levels. Customizable color, width, and style of the lines. Deletes lines on deinitialization. Updates
FREE
Automate Your Strategy! Use the Expert Advisor Daily Drop Analyzer to automatically execute the strategy, with filters, configurable parameters, and order management.
Check it here: Daily Drop Analyzer EA
Daily Drop Analyzer is a technical indicator for MetaTrader 5 that performs historical tests based on daily percentage drops. It analyzes up to 200 Market Watch symbols to identify recurring entry levels within a configurable range. The calculation uses daily candles (default: 120 days) and
FREE

Moving Average Colored
A very simple indicator, but one that cannot be missed when carrying out your operations. Considered one of the oldest and indispensable indicators to have on your chart now with coloring to make your operations even easier. Configuration Parameters: Time course Averaging Method
Come and see our mql5 signals too https://www.mql5.com/pt/signals/914535?
FREE
Custom ATR Indicator for Horizontal Levels Trading The Custom ATR Indicator is a powerful tool designed for traders who rely on horizontal levels and understand the importance of the Average True Range (ATR) in making informed trading decisions. This indicator calculates the ATR based on a customizable number of bars, filters out abnormal bars (too large or too small), and provides clear visualizations of key data, including ATR values, Stop Loss levels, and price movement percentages. Key F
FREE

Wolf Countdown helps you not to waste the right amount of time, it gives you back the time remaining until the candle closes.
How to use: Download and install the Wolf Countdown Indicator on your MetaTrader 5. Apply the indicator to your favorite chart.
this works on any timeframe...
Thanks to this indicator you will never miss the right moment to enter your trades.
FREE

The custom Bollinger Bands Height indicator measures and displays the current state of the Bollinger Bands indicator, showing whether the bands are widening (moving away from each other) or narrowing (starting to converge). Contraction, indicated by the narrowing of the bands, suggests that the current market movement is losing momentum and hints at the potential start of a new strong movement. This can be a signal to look for an opportune moment to enter a position, as a sharp price change may
FREE
The indicator displays support and resistance levels based on fibonacci level in multi period Creates lines indicating the latest support and resistance levels.
These lines are updated whenever there is a change in support or resistance levels. Labels are removed if the corresponding conditions are not met.
the period is availble in setting and level fibonacci
FREE

Double Line Donchian Channel MT5/Meta Trader 5 Indicator, this is customized Indicator to show only 2 Lines of Highest and Lowest PRICE line where you can add a MA (MOVING AVERAGE) for center line. What is Donchian Channel?
Donchian Channels are three lines generated by moving average calculations that comprise an indicator formed by upper and lower bands around a midrange or median band. The upper band marks the highest price of a security over N periods while the lower band marks the lowest p
FREE

The EMA Engulfing Cross indicator is an indicator for the MetaTrader 5 platform that signals potential buy and sell opportunities based on an engulfing candle pattern after a recent exponential moving average cross. You can adjust how recently the trend change must have occurred using the PASTemaCROSS input. The RSI oversold/overbought function is used to confirm the signals generated by the moving averages. It takes into account the previous bar before the engulfing bar, and it is best used wi
FREE

Tired of adjusting the indicator settings losing precious time? Tired of the uncertainty regarding their efficiency? Afraid of the uncertainty in their profitability? Then the indicator ACI (automatically calibrateable indicator) is designed exactly for you. Launching it, you can easily solve these three issues just performing the simplest action: clicking a single Calibrate button. To achieve the highest efficiency, you should perform another additional action: move the power slider to the maxi
FREE

It is the simplest indicator in existence. It has only one function: report the seconds elapsed since the last minute end in a very convenient way, with a label that can be moved in the chart, so that the trader does not have to take his eye off the forming candle. It is used on M1, but also on larger intervals, for those interested in opening/closing positions at the best time. Sometimes an intense movement in the last 10" of the minute gives indications of future trend, and can be used for sc
FREE

Simple Calendar Events is an indicator that will mark important Important Economy Events on your chart. For example, if you are trading something that is USD based, you would like to know when some important events are coming, you can expect some volatility or some different Price action, so you can base your strategy on it. If you trade something that is country based you can also choose that, and it will show you when the event is, so you can be prepared for it. When you hover with the mouse
FREE

Advanced Volume Flow Indicator A professional volume analysis tool that helps traders identify potential market reversals and trend confirmations through advanced volume flow calculations and smart filtering algorithms. Main Features Advanced volume analysis with precision filtering Real-time trade signals with price levels Smart alert system for automated trade detection Clear visual representation with color-coded volume bars Multi-timeframe optimization Professional-grade calculat
FREE
MetaTrader 플랫폼 어플리케이션 스토어에서 MetaTrader 마켓에서 트레이딩 로봇을 구매하는 방법에 대해 알아 보십시오.
MQL5.community 결제 시스템은 페이팔, 은행 카드 및 인기 결제 시스템을 통한 거래를 지원합니다. 더 나은 고객 경험을 위해 구입하시기 전에 거래 로봇을 테스트하시는 것을 권장합니다.
트레이딩 기회를 놓치고 있어요:
- 무료 트레이딩 앱
- 복사용 8,000 이상의 시그널
- 금융 시장 개척을 위한 경제 뉴스
등록
로그인
계정이 없으시면, 가입하십시오
MQL5.com 웹사이트에 로그인을 하기 위해 쿠키를 허용하십시오.
브라우저에서 필요한 설정을 활성화하시지 않으면, 로그인할 수 없습니다.