Смотри обучающее видео по маркету на YouTube
Как купить торгового робота или индикатор
Запусти робота на
виртуальном хостинге
виртуальном хостинге
Протестируй индикатор/робота перед покупкой
Хочешь зарабатывать в Маркете?
Как подать продукт, чтобы его покупали
Технические индикаторы для MetaTrader 4 - 89

For this set of indicators 1. General information - Calculates with high performance mathematical algorithms. - Calculated from the price of candles - The entry point of this order is filtered by the train EMA and the oscillator. - Calculate the integrity of the candle
2. How does it work? - You can see two types of order entry points: the notification on the monitor and the arrow. - You can trust 75-95 percent of this entry point.
3. Settings - A complete candle i

For this set of indicators 1. General information - Calculates with high performance mathematical algorithms. - Calculated from the price of candles - The entry point of this order is filtered by the train EMA and the oscillator. - Calculate the integrity of the candle
2. How does it work? - You can see two types of order entry points: the notification on the monitor and the arrow. - You can trust 75-95 percent of this entry point.
3. Settings - Retracement is retr

For this set of indicators 1. General information - Calculates with high performance mathematical algorithms. - Calculated from the price of candles - The entry point of this order is filtered by the train EMA and the oscillator. - Calculate the integrity of the candle
2. How does it work? - You can see two types of order entry points: the notification on the monitor and the arrow. - You can trust 75-95 percent of this entry point.
3. Settings - A complete candle i

For this set of indicators 1. General information - Calculates with high performance mathematical algorithms. - Calculated from the price of candles - The entry point of this order is filtered by the train EMA and the oscillator. - Calculate the integrity of the candle
2. How does it work? - You can see two types of order entry points: the notification on the monitor and the arrow. - You can trust 75-95 percent of this entry point.
3. Settings - A complete candle i

For this set of indicators 1. General information - Calculates with high performance mathematical algorithms. - Calculated from the price of candles - The entry point of this order is filtered by the train EMA and the oscillator. - Calculate the integrity of the candle
2. How does it work? - You can see two types of order entry points: the notification on the monitor and the arrow. - You can trust 75-95 percent of this entry point.
3. Settings - A complete candle i

For this set of indicators 1. General information - Calculates with high performance mathematical algorithms. - Calculated from the price of candles - The entry point of this order is filtered by the train EMA and the oscillator. - Calculate the integrity of the candle
2. How does it work? - You can see two types of order entry points: the notification on the monitor and the arrow. - You can trust 75-95 percent of this entry point.
3. Settings - A complete candle i

Паттерны Price Action Моя утилита 1 : более 66 функций, включая этот индикатор | свяжитесь со мной если у вас есть вопрос Индикатор отображает наиболее важные паттерны Price Action, которые указывают на потенциальный разворот или продолжение тренда. Поддерживаемые свечные модели: Пин - бар; Поглощение; Внутренний бар; Утренняя звезда; Вечерняя звезда; Завеса из темных облаков; Просвет в облаках; Особенности работы: возможность выбора определенных паттернов для отображения (вы можете о

Автоматические уровни поддержки и сопротивления Моя утилита 1 : более 66 функций, включая этот индикатор | свяжитесь со мной если у вас есть вопрос Индикатор отображает уровни, которые являются экстремумами для заданных тайм-фреймов. Уровень сопротивления является максимальной ценой последнего закрытого бара; Уровень поддержки является минимальной ценой последнего закрытого бара; 2 режима работы: Тело свечи: использование цен открытия и закрытия; Экстремумы: использование максимально

This may just look like another indicator for identifying and displaying supply and demand, but dig-in further and you will discover it has much more to offer. In addition to the complete flexibility for displaying zones, consider the identification of recent support or resistance, the back-testing capability to help you learn how to identify the best supply and demand zones to trader from, the continuously updated trend information for all time frames, times from around the world displayed on

FBO Impact is a professional yet simple to use trend following system. It detects the prevailing trend and gives entry points after pullbacks to significant price levels. To determine the trend it uses a unique filtering algorithm. Suitable for defining entry points for scalping as well as for intra-day trading. Features Works with the prevailing market trend. Suitable for all currency pairs. Ideal for all time frames but higher time frames are recommended. Does not redraw/repaint the arrows on

Индикатор размера бара: уведомление о больших барах Моя утилита 1 : более 66 функций, включая этот индикатор | свяжитесь со мной если у вас есть вопрос Индикатор находит свечи, которые превышают заданный размер, и обозначает их размер. удобно для фильтрации паттернов в период низкой волатильности; указывает на начало тренда; помогает видеть наиболее значимые бары; может использоваться при торговле бинарными опционами ; 2 режима работы: Тело свечи: будет считаться разница меж

Показывает направление баров на всех основных таймфреймах. Многофункциональная утилита : более 66+ функций, включая этот индикатор | Версия для MT5
Значение визуальных сигналов ( квадраты):
Красный : Цена закрытия ниже цены открытия: Close < Open; Зелёный : Цена закрытия выше цены открытия: Close > Open; Синий : Цена закрытия равна цене открытия: Close = Open; Можно установить Сдвиг рассчитываемого бара относительно текущего: Shift = 0: направление текущих (незакрытых) баров, Shift

14 индикаторов и вспомогательных инструментов для удобной торговли Этот инструмент содержит 14 дополнительных инструментов, которые могут быть полезны для определенных действий трейдера, тем самым упрощая и ускоряя торговый процесс. Посмотрите мой #1 Trade Manager : включает 66+ функций и индикаторов | Свяжитесь со мной если у вас есть вопросы Из-за разного разрешения мониторов некоторые пользователи могут столкнуться с тем, что метки будут отображаться с наложением или быть слишком мален

The falcon indicator works based on the innovative falcon strategy before me, as I used special numbers for the Moving Release indicator and the Bollinger Band, in addition to many indicators for filtering the signal, some numbers from the Nine Square and the Fibonacci numbers, where the results were impressive. We also have a free version for a month in the video description on Youtube download link Thanks

Trading is a trade war So traders are warriors. A warrior needs a weapon.
The Binary Galaxy A1 is a powerful weapon. Extremely accurate This tool can be customized as you like.
Who deserves such an accurate weapon? 1. People who want profits From binary options trading 2. Those who want to trade short, profit fast 3. People who want long-term can do it. 4. Beginners can use it. 5. Old hand works very well.
How it works It works very easy. For binary options Time frame M1 or M5 and expires 5-

Trading is a trade war So traders are warriors. A warrior needs a weapon.
The Scalping One Plus A1 is a powerful weapon. Extremely accurate This tool can be customized as you like.
Who deserves such an accurate weapon? 1. People who want profits From binary options trading 2. Those who want to trade short, profit fast 3. People who want long-term can do it. 4. Beginners can use it. 5. Old hand works very well.
How it works It works very easy. For binary options Time frame M1 or M5 and expire

Hello This Indicator will draw Green (Up) and Red (Down) small arrows from Multi TimeFrames based in ( Average True Range ) to help you to take decision to buy or sell or waiting If there 4 green arrows in same vertical line that's mean (Up) and If there 4 Red arrows in same vertical line that's mean (Down) and the options contain (Alert and Mobile , Mail Notifications). Please watch our video for more details https://youtu.be/MVzDbFYPw1M and these is EA for it https://www.mql5.com/en/market/pr

Индикатор Dragon Trend отражает информацию в наглядном виде. Интеллектуальный алгоритм индикатора Dragon Trend с достаточной точностью определяет тренд, отфильтровывает рыночный шум и генерирует входные сигналы.
Одно из самых любимых направлений в анализе ценового графика является использование графического анализа. Состояние рынка, фаза его движения во многом определяет успешность трейдера и выбранной им стратегии. Индикатор использует цветовую сигнализацию: синий - при смене с нисходящего н

Ключевое отличие индикатора Trend Channel Generator от других канальных индикаторов состоит в том, что Trend Channel Generator берет в расчет не простые скользящие средние, а дважды сглаженные, что с одной стороны позволяет более четко определять движение рынка, а с другой стороны делает индикатор менее чувствительным. Trend Channel Generator – это индикатор канала без перерисовки, строящийся на основании скользящих средних.
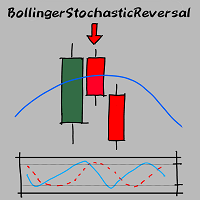
Hello Guys! I want to share with you a very simple but very effective indicator, which I use a lot in my daily trading. Bollinger bands are one of the most effective tools in trading, especially for those who like to operate on low time frames and prefer fast operations.
The indicator detects fast reversals: when the price close above or below the Bollinger Bands, but then re-enters in the Bands on the next candle, the indicator sends a signal and draws an arrow on the newly opened candle! It i

Victory Price Direction Рада представить вам мой новый индикатор . Этот индикатор включает в себя все лучшие стратегии, которые я исследовала. Индикатором очень просто пользоваться. Сейчас в индикаторе 3 базовые стратегии . Я постоянно занимаюсь поиском улучшений стратегий.
Вы получаете: Простой и эффективный индикатор разворотов. Индикатор поможет вам корректно поставить Take Profit Сообщит когда нужно закрыть сделку, что не позволит уйти в большой минус. Никогда

This indicator is an indicator that detects whether or not each moving average line is currently in the perfect order state. A perfect order is a state in which there are three moving averages on the FX chart, one for each of the short-term, medium-term, and long-term, lined up in the same direction in order to create a trend. The steeper the slope, the stronger the trend and the longer it tends to last. Many traders are aware of this perfect order. Perfect orders include uptrend perfect orders
All moving averages in one indicator
Have you ever wanted an indicator which contains all types of moving averages and show you when they cross? And at the same time works on all timeframes and it's very simple to configure? Well, now it's your chance to have it , because I am very glad to bring you another of my best creations : ALL in one MA indicator
This indicator is the base indicator used for this strategy. https://www.mql5.com/en/market/product/54168#!tab=overview
Features The w
The five guardians
This indicator is a combination of the next indicators, each with their own settings. CCI MACD ADX DMI STOCHASTIC
When all five of them align with the same movement we get a green color which represents the buy movement , and contrary we have a red color which represents a sell movement. If its gray, its undecided, and we have to wait until a better signal will appear.
Logo made by https://www.fiverr.com/aleksa19
Features Beginner friendly tools that incorporates one of the most useful indicators into simple and efficient strategy. This oscillator merges MA of RSI and parabolic SAR based on MACD values. Compared to standard parabolic SAR you'll see it is smoother and it seems likely to identify better significant price breaks. You will also have histogram that shows price bias and to assist with making trading decisions based on alignment.
Market to run
It can be adapted to all type of trading styles
Features A n indicator will be given if we have a break on high volume.
Up Arrow
Volume> Average_Volume * Multiplier
Price> Highest Price for Last N candle, plus set, Pip / Percentage Value
Down Arrow
Volume> Average_Volume * Multiplier
Price <Lowest Price for Last N candle, minus set, Pip / Percentage Value
Market to run
It can be adapted to all type of trading styles such as scalping, day trading or swing. It doesn't matter if its forex, stock , crypto and so on. It can be adapted an
DMI ADX Histogram Oscillator I present you one of the most precise and powerful indicator Its made of DMI Histogram together with ADX Oscillator. It has inside arrow to show a buy or sell setup.
Features The way it works its the next one : the histogram is a difference between DMI+ and DMI-. At the same time together we have the oscillator ADX for
Market to run
It can be adapted to all type of trading styles such as scalping, day trading or swing. It doesn't matter if its forex, stock ,
Индикатор разработан для торговли бинарными опционами на малых таймфреймах до м 15 Прост в использовании не нуждается в дополнительных настройках и можно использовать без дополнительных фильтров Рекомендации для торговли При появлении сигнала ( синий стрелки показывающий на верх ) нужно рассматривать направление на buy При появлении сигнала ( красной строки показывающий на низ ) нужно рассматривать направление на sell Заключить сделку стоит на той свечи где пришел сигнал на одну свечу если сиг

It is an indicator that analyzes the high and low prices in real time by Dow theory, draws a trend line, and draws the predicted arrival point in the Box format after breaking the low price and the high return price. The high and low prices are determined by the nBars parameter (initial value = 5), but displaying the corresponding moving averages (SMA and EMA 4 to 5 times nBars) at the same time makes it easier to understand the trend change. (D ownload the demo version of the free GreenBox and

Ежедневный скальпер тренда (DTS) Этот индикатор является частью систем RPTrade Pro Solutions.
DTS — это индикатор дневного тренда, использующий ценовое действие, динамическую поддержку и сопротивление. Он предназначен для использования любым, даже абсолютный новичок в торговле может использовать его. НИКОГДА не перекрашивает. Показания даны от близкого к близкому. Предназначен для использования в одиночку, никаких других индикаторов не требуется. Дает вам тренд и потенциальный Take Profit в на
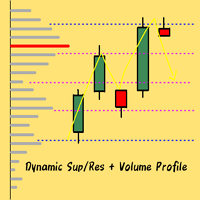
!!!REVISION 3 OF THE INDICATOR HAS BEEN RELEASED! IF YOU WANT TO TRY THE INDICATOR FOR 1 MONTH FOR FREE JUST WRITE ME NOW!!!
DYNAMIC LEVELS + VOLUME PROFILE + REGRESSION CHANNEL Hello Guys! Revision 3 of the indicator has been released! The indicator plots SUPPORTS AND RESISTANCES DYNAMICALLY on the chart, identifying different levels of interest based on the price action. Every trader knows that indicators are important, but they often provide the signal "with a candle of delay", therefore whe
Это стрелочный индикатор. Он выбирает данные от 23-х стандартных индикаторов и расчитывает уровень сигнала который показывает предполагаемое движение цены инструмента торговли. Минимальный уровень сигнала индикатора установлен в пределах -100 до +100%. Используйте усреднение для формирования сигнала.
Как работать с индикаторам.
Следим за сигналом и принимаем решения. Индикатор перерисовывается только на нулевой свечи, поэтому решения принимаются после закрытия свечи с новым сигналом, и сигнал
Это линейный индикатор. Он выбирает данные от 23-х стандартных индикаторов и рассчитывает уровень сигнала, который показывает предполагаемое движение цены инструмента торговли. Минимальный уровень сигнала индикатора установлен в пределах -100 до +100%. Используйте усреднение для формирования сигнала.
Как работать с индикаторам.
Следим за сигналом и принимаем решения. При пересечении нулевого уровня индикатора снизу вверх можно рассматривать покупки. При пересечении нулевого уровня сверху вни
Это индикатор гистограмма. Он выбирает данные от 23-х стандартных индикаторов и расчитывает уровень сигнала который показывает предполагаемое движение цены инструмента торговли. Минимальный уровень сигнала индикатора установлен в пределах -100 до +100%. Используйте усреднение для формирования сигнала.
Как работать с индикаторам.
Следим за сигналом и принимаем решения, цвета гистограммы показывают когда возможны покупки а когда продажи, или нейтральный цвет - сделать паузу. Индикатор перерисов

Stochastic force is an advanced version of the stochastic oscillator. Instead of using the regular price a more efficient price data is provided as an input for the oscillator which takes into account the price efficiency, volume and market noise. Also price is pre-filtered with the selected average type and then post-filtered by a hull moving average which provides a smooth transition of the oscillator. It eliminates maximum false signals and has the potential to become an integral part of any

Trend Harvester is yet another trend indicator with flat detection. It uses price series and Moving Average for detecting market trend.
For better result I would recomend to play with parameters.
Lower periods will force to react to short trends.
Higher periods will try to show longer trands.
You can set the same period for Price Series and Moving Average for quick test.
You can also choose Moving Average type between "Regular" and "Zero Lag".
"Zero Lag" type improves reaction to trend change.

VertexFilter - это индикатор соединивший в себе классический zig zag и осциллятор. Принцип действия следующий: когда регистрируется новый максимум или минимум, это делается с помощью индикатора zig zag, индикатор ждет смены направления движения цены, это делается с помощью осциллятора, в такие моменты появляются сигналы на покупку и продажу. Таким образом индикатор подает сигналы когда цена меняет направление движения вблизи экстремумов. Это позволяет отфильтровать ложные сигналы. Индикатор имее
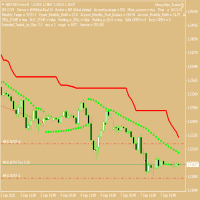
ATR Stops Attach to chart of any timescale Length = 10 ATR period = 9 kv = 6 I use this set up on a one hour chart, basically the blue line indicates an upward trend while the red line indicates a downward trend All setting can be used on any chart period, If you don't like the settings I use then just play around with the settings on any chosen time period until you find a setup which suites your trading style
MA with Trend colour Attach to chart of any timescale MA period = 200 buffer = 1 I use this set up on a one hour chart, basically the green line indicates an upward trend while the red line indicates a downward trend All setting can be used on any chart period, If you don't like the settings I use, then just play around with the settings on any chosen time period until you find a setup which suites your trading style

The indicator allows you to trade binary options. The recommended time frame is М5 and the expiration time is 5 minutes. The indicator suitable for auto and manual trading. A possible signal is specified as a arrows above/under a candle. You should wait until the candle closes and entry the trade at new candle Arrows are not re-painted Trade sessions: Any Currency pairs: ( recommended) AUD/CAD Working time frame: M5 Expiration time: 5,10,15 minute Up buffer: 1, down buffer: 0 *** Use with bro

The indicator allows you to trade binary options. The recommended time frame is М5 and the expiration time is 5 minutes. The indicator suitable for auto and manual trading. A possible signal is specified as a arrows above/under a candle. You should wait until the candle closes and entry the trade at new candle Arrows are not re-painted Trade sessions: Any Currency pairs: ( recommended) EUR/AUD Working time frame: M5 Expiration time: 5,10,15 minute Up buffer: 1, down buffer: 0 *** Use with brok

The indicator allows you to trade binary options. The recommended time frame is М5 and the expiration time is 5 minutes. The indicator suitable for auto and manual trading. A possible signal is specified as a arrows above/under a candle. You should wait until the candle closes and entry the trade at new candle Arrows are not re-painted Trade sessions: Any Currency pairs: ( recommended) AUD/NZD Working time frame: M5 Expiration time: 5,10,15 minute Up buffer: 1, down buffer: 0 *** Use with brok
It is a judgment tool that judges trends in 1 minute and supports discretionary trading.
Various usages 1. It is used to recognize the environmental advantage of buying or selling with the color of the line. If the line is red, it is advantageous to buy. If it is blue, it is advantageous to sell. Neither if there is no line. 2. Used as a guide for entry by signing the entry. Red arrow long Blue arrow short 3.Used as a guide for closing (Even if there is no entry sign, the close point will be s

Индикатор Absolute price предназначен для профессионалов, оценивающих фундаментальные тенденции рынка. Он вычисляет индекс любого инструмента и анализирует его. Индекс валюты государства показывает реальную покупательную способность этой валюты, а динамика этого индекса динамику экономического состояния соответствующего государства. Анализ индексов обоих валют, входящих в валютную пару, позволяет гораздо надежнее идентифицировать тренд этой валютной пары и о
Медвежий/Бычий дивергентный бар. Один из сигналов системы "Торговый хаос" Билла Вильямса. (Первый мудрец)
При отдалении от индикатора "Аллигатор" и наличии дивергенции на индикаторе "Awesome Oscillator" показывает потенциальную точку смены движения.
Строится исходя из открытия/закрытия бара, положения относительно предыдущих, Аллигатора и АО.
При торговле вход осуществляется на пробитии бара (шорт - лоу бара, лонг - хай бара), а стоп лосс ставится за крайнюю точку бара.
Для более эффективного ос
The strategy works on the ECN account (5min and more)
Inside bar : with the direction of movement average 200 (you can change 200 it if you want). when the price is on the MA the indicator only gives the buy sign, and the opposite if the price is below the MA 1 Buy: The indicator draws a blue line, when a candle closes above that line and the price reverses towards the line, Buy from that blue line. Put the stop on the red line and the take profit on the yellow line TP1, or green line TP2 2
ATR on Chart has been made for anyone wants to easily analyze ATR from Price Chart. It will show ATR rang and you can apply with each bar or MA .
When price touches the line it means it is trending to that side .
Please be aware that this indicator DOES NOT point out the momentum of trending. I r ecommend to use this indicator to find : https://www.mql5.com/en/market/product/55009
Input d escription : ATRperiod = Setting of ATR period. ATRmulti = Multiply value from ATRperiod . Mode = se

the indicator will show signal arrows on the graph at the crossing of a given level it has push and audible alerts. By crossing from low to high level 0.3, a blue arrow will come out for the purchase, at the same time an audible signal will sound. By crossing from low to high level 0.7, a red arrow will come out for the sale, at the same time an audible signal will sound. Possibility to deactivate push and audible alerts.
MT5 version : https://www.mql5.com/en/market/product/51968

The indicator allows you to trade binary options. The recommended time frame is М5 and the expiration time is 5 minutes. The indicator suitable for auto and manual trading. A possible signal is specified as a arrows above/under a candle. You should wait until the candle closes and entry the trade at new candle Arrows are not re-painted Trade sessions: Any Currency pairs: ( recommended) EUR/CAD Working time frame: M5 Expiration time: 5,10,15 minute Up buffer: 1, down buffer: 0 *** Use with brok

This indicator Super XT indicator.Indicator displays trend movement. Indicator calculates automatically line. Features
FiltPer - displays indicator period. Window - displays indicator trend (true/false).
Trend - displays indicator trend (true/false).
X - move the trend left and right. Y - move the trend up and down.
How to understand the status: If the Trend color is green, trend is up.
If the Trend color is red, trend is down.
////////////////////////////////////////////////////////

Mr Pip Trend indicator combines powerful price action analysis and sophisticated algorithmic data analysis to provide traders with high-accuracy chart analysis and support the decision-making process. You can use Mr Pip Trend Indicator to trade all the markets (all Forex pairs, all CFDs and Cryptocurrencies) on all timeframes! Mr Pip Trend Indicator provides chart analysis that is effective at detecting new trends but finds the exact sweet-spot between early and late entries. What is different
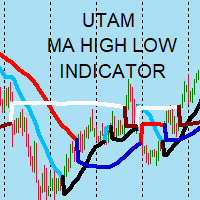
Nice Day! - A moving average candle indicates a high and low turn trend.
- MA_vonal_vastagsaga: MA_line_thickness. - MA_vonal_szine: MA_line_color. - MA_vonal_szine_long: MA_line_color_long. - MA_vonal_szine_short: MA_line_color_short. - mql5.com can also be used for my robots. Szép Napot! - Mozgó átlag gyertyájának magas (High) és alacsony (Low) fordulos trend jelzése. - mql5.com robotjaimhoz is használható.

What you can do with CandleStick CandleStick is a useful indicator for doing MTF analysis. This indicator displays the CandleStick of another time frame on the chart . By understanding the information in multiple time charts at the same time, it is easier to understand the overall market view. It is also a useful tool for validating and studying past quotes and trades. There are similar products made by others, but I designed and developed it so that it is easy for me to use.
Features of Candle

Indicator developed with precision algorithm that seeks moments of strong trend in the markets. Reconciled with an algorithm that seeks high volume moments in the market. I recommend using timeframes M15 to H1. I also recommend an optimization to your liking for your best currency pairs. Any questions, do not hesitate to ask. Buy EA based on this indicator CLICKING HERE This is an excellent trigger indicator for your trading system. If you already operate a trend and want an indicator to show y

Отображает на графике появляение гэпа (случай, когда цена закрытия предыдущего бара отличается от цена открытия нового бара). Вы можете настроить:
Размер гэпа (в пунктах): будут отображаться только те гэпы, которые превышают или равны этому значениею. Цвет стрелок: отдельно для гэпов вверх и вниз. При наведении мышкой на стрелки гэпов на графике - будет отображен их размер. Для разных тайм-фреймов и валютных пар рекомендуется подбирать подходящий размер гэпа. Ещё у меня есть Многофункциональны

The indicator allows you to trade binary options. The recommended time frame is М5 and the expiration time is 5 minutes. The indicator suitable for auto and manual trading. A possible signal is specified as a arrows above/under a candle. You should wait until the candle closes and entry the trade at new candle Arrows are not re-painted Trade sessions: Any Currency pairs: ( recommended) EUR/NZD Working time frame: M5 Expiration time: 5,10,15 minute Up buffer: 1, down buffer: 0 *** Use with b

We know for sure that The Fibonacci sequence is a science used to calculate or estimate target distances.
How does this indicator work? 1. Tell the spread status 2. Tell me the current price 3. Indicate whether the candlestick status is bullish or bearish on each time frame. 4. Indicates the status of the past 2 candles 5. Tell Pivot Point 6. Tell the Fibonacci sequence. 7.The Fibonacci measurement can be set. 8. Pivot can be set backward. 9. Look at support and resistance.
Suitable for 1. Da

Приседающий бар (Squat bar).
Один из элементов системы "Торговый хаос" Билла Вильямса. (Приседающий бар)
Расчитывается исходя из разницы в изменении цены и тикового обьема.
Усиливает сигнал "Медвежьего/Бычьего Дивергентного разворотоного бара (Первый Мудрец)" если совпадает с ним или находится рядом.
Протестирован в сравнении с оригинальной программой "Investror's Dream"
Для более эффективного освоения системы читайте и смотрите материалы Билла Вильямса.
В настройках можо выбрать цвет и шир

TorN ( Trend or Not ) has been made from ADX problem on fixed level. Only fixed level is hard to find trending or not. Now I find the better method to analyze ADX with MA . You can use this signal to confirm your trending strategy. (Or use it to find Sideway)
The best signal is signal line get higher than MA line and fixed level. ( Recommend to use level value same as ADX period or higher ) If signal line lower than MA line on Any level is mean weakening trend.
Please be aware that thi

This type of arrow indicator works without redrawing signals. The signal on the indicator is shown as arrows (in the direction of movement). It is very simple and effective to use in the Forex market. Type of trading: "Scalping" It is applicable and performs well in intraday trading, as well as long-term trading. Сигнал на индикаторе показан в виде стрелок ( по направлению движения).
Очень прост и эффективен в применении на рынке Форекс.
Вид торговли: " Скальпинг"
Применим и хорошо себя по
Индикатор с инновационным алгоритмом определения направления тренда. Показывает лучшие результаты определения тренда на любых валютных парах, акциях, криптовалюте без перерисовки результата. Поможет сразу определить прибыльность текущей пары и таймфрейма. Использует паттерны Price action в связке с авторским уникальным алгоритмом. Подходит как новичкам так и профессионалам для всех видов торговли. Как выбрать прибыльный таймфрейм и оптимизировать индикатор под валютную пару. Особенности Новейший

Reversal Sniper is designed to find the extreme reversals of the price. Indicator collects data of Cycle Sniper Indicator.
NOTE: REVERSAL SNIPER Indicator is made for Cycle Sniper Users as an additional tool. However, it can be used by the traders who look for finding out strong reversal levels.
Indicator works on all timeframes and all instruments.
Reversal Sniper Checks: Harmonic Patterns RSI Zig Zag and Harmonic Swings Cycle Sniper Indicator's Buy / Sell Signals The complex algo is bas
The Icarus Signals Continuation(TM) Indicator is a simple, but highly effective tool for identifying strong price trends, both long and short, across all time-frames and instrument types. The Icarus Continuation Indicator allows users to plot individual markers for each bar, when price has extended into a high-probability trend area, after a set level of extension. The Continuation Indicator allows users to fully optimise each of the unique Icarus settings to best fit a particular trading s

The Knowledge of which Geometry aims is the knowledge of the Eternal - Plato Quant Stress Scanner is a Scientifically developed Stress detection algorithm along the geometrical lines on the price data which are quantified into Stress repulsion, fractures and clusters in a easily understandable signal form. Each signal are displayed in well-arranged with currency pairs in row-wise and timeframes in column-wise manner. Explanation of signal and plotting stress levels with trendlines are shown in

Описание
Impulse Angle - индикатор, который идентифицирует на рынке импульсы и отображает на графике угол их наклона.
Рекомендации
Вы можете использовать данный индикатор для определения тренда (импульса) и соответственно для определения направления открытия позиции или закрытия противоположной позиции.
Параметры
===== _INDICATOR_SETTINGS_ ===== - настройки расчета индикатора
Maximum History Bars - максимальное количество баров истории для расчета индикатора. Average True Range Peri
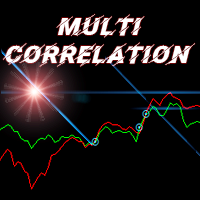
Индикатор корреляции двух торговых инструментов. Идеально подходит для парного трейдинга. Пример использования: при значительном расхождении коррелирующих торговых инструментов открыть две сделки в направлении каждой из них. Закрытие сделок производится при пересечении линий корреляции. Настройки: First symbol (if empty - current) - Первый торговый инструмент (если пусто - текущий); Second tool (if empty - current) - Второй торговый инструмент (если пусто - текущий); Number of bars - Количество

This is an alert for when price is above the 200 ema, macd is below its zero line and the slow ma crosses above the fast ma and vice versa for sells. It has been tested 100 times as seen on youtube and has a 65% win rate on the 30 minute time frame.
I've attached a video to explain how to use it. Under the vuideo is a link to Trading Rush video where he tests the strategy 100 times on 30 minute.
(1) INDICATOR PARAMETERS
MA Period . Default is 200 MA Type . Default is
Узнайте, как легко и просто купить торгового робота в MetaTrader AppStore - магазине приложений для платформы MetaTrader.
Платежная система MQL5.community позволяет проводить оплату с помощью PayPal, банковских карт и популярных платежных систем. Кроме того, настоятельно рекомендуем протестировать торгового робота перед покупкой, чтобы получить более полное представление о нем.
Вы упускаете торговые возможности:
- Бесплатные приложения для трейдинга
- 8 000+ сигналов для копирования
- Экономические новости для анализа финансовых рынков
Регистрация
Вход
Если у вас нет учетной записи, зарегистрируйтесь
Для авторизации и пользования сайтом MQL5.com необходимо разрешить использование файлов Сookie.
Пожалуйста, включите в вашем браузере данную настройку, иначе вы не сможете авторизоваться.