YouTube'dan Mağaza ile ilgili eğitici videoları izleyin
Bir alım-satım robotu veya gösterge nasıl satın alınır?
Uzman Danışmanınızı
sanal sunucuda çalıştırın
sanal sunucuda çalıştırın
Satın almadan önce göstergeyi/alım-satım robotunu test edin
Mağazada kazanç sağlamak ister misiniz?
Satış için bir ürün nasıl sunulur?
MetaTrader 4 için teknik göstergeler - 89

Gösterge, belirtilen zaman dilimleri için ekstrem olan seviyeleri gösterir. Direnç seviyesi, son kapanan çubuğun en yüksek fiyatıdır; Destek seviyesi, son kapanan çubuğun en düşük fiyatıdır; #1 Trade Assistant ürünüme göz atın: 66+ özellik, bu gösterge dahil | Sorularınız için bana ulaşın 2 çalışma modu: Gerçek gövde: Açılış ve kapanış fiyatları kullanılacak; Ekstremler: En yüksek ve en düşük fiyatlar kullanılacak;
Bu gösterge: Potansiyel dönüş seviyelerini görmeye yardımcı olur; Seviyelerin y

This may just look like another indicator for identifying and displaying supply and demand, but dig-in further and you will discover it has much more to offer. In addition to the complete flexibility for displaying zones, consider the identification of recent support or resistance, the back-testing capability to help you learn how to identify the best supply and demand zones to trader from, the continuously updated trend information for all time frames, times from around the world displayed on

FBO Impact is a professional yet simple to use trend following system. It detects the prevailing trend and gives entry points after pullbacks to significant price levels. To determine the trend it uses a unique filtering algorithm. Suitable for defining entry points for scalping as well as for intra-day trading. Features Works with the prevailing market trend. Suitable for all currency pairs. Ideal for all time frames but higher time frames are recommended. Does not redraw/repaint the arrows on

Belirtilen boyutu aşan çubukları bulur Benim #1 Trade Asistanıma göz atın: 66+ özellik, bu gösterge dahil | Sorularınız için iletişime geçin 2 çalışma modu: Gerçek gövde: açılış ve kapanış fiyatları arasındaki fark kullanılacak; Ekstremler: maksimum ve minimum fiyatlar arasındaki fark kullanılacak;
Bu gösterge: Düşük volatilite dönemlerinde desen filtreleme için kullanışlı; Trend başlangıcını gösterir; En önemli çubukları görselleştirir; İkili opsiyon işlemlerinde kullanılabilir; G

Tüm ana zaman dilimlerindeki çubukların yönünü gösterir. Çok fonksiyonlu araç : 65+ özellik, bu gösterge dahil | MT5 sürümü
Görsel sinyallerin anlamı ( kareler):
Kırmızı : Kapanış fiyatı açılış fiyatından düşük : Close < Open; Yeşil : Kapanış fiyatı açılış fiyatından yüksek : Close > Open; Mavi : Kapanış fiyatı açılış fiyatına eşit : Close = Open; Hesaplanan çubuğun mevcut çubuğa göre Kaydırma sını ayarlayabilirsiniz: Shift = 0: şu anda açık olan (değişen) çubukların yönü, Shift = 1

Kolay işlem için 14 gösterge ve yardımcı araç Bu yardımcı program, trader'ın belirli eylemleri için yararlı olabilecek 14 ek araç içerir, böylece işlem sürecini basitleştirir ve hızlandırır. Benim #1 Trade Manager 'ıma göz atın: 66+ özellik ve gösterge içerir | Bana ulaşın sorularınız varsa Farklı monitör çözünürlükleri nedeniyle, bazı kullanıcılar etiketlerin üst üste göründüğünü veya çok küçük olduğunu fark edebilir. Bu sorunu yaşarsanız, yazı boyutunu ayarlayabilirsiniz: giriş değişken

The falcon indicator works based on the innovative falcon strategy before me, as I used special numbers for the Moving Release indicator and the Bollinger Band, in addition to many indicators for filtering the signal, some numbers from the Nine Square and the Fibonacci numbers, where the results were impressive. We also have a free version for a month in the video description on Youtube download link Thanks

Trading is a trade war So traders are warriors. A warrior needs a weapon.
The Binary Galaxy A1 is a powerful weapon. Extremely accurate This tool can be customized as you like.
Who deserves such an accurate weapon? 1. People who want profits From binary options trading 2. Those who want to trade short, profit fast 3. People who want long-term can do it. 4. Beginners can use it. 5. Old hand works very well.
How it works It works very easy. For binary options Time frame M1 or M5 and expires 5-

Trading is a trade war So traders are warriors. A warrior needs a weapon.
The Scalping One Plus A1 is a powerful weapon. Extremely accurate This tool can be customized as you like.
Who deserves such an accurate weapon? 1. People who want profits From binary options trading 2. Those who want to trade short, profit fast 3. People who want long-term can do it. 4. Beginners can use it. 5. Old hand works very well.
How it works It works very easy. For binary options Time frame M1 or M5 and expire

Hello This Indicator will draw Green (Up) and Red (Down) small arrows from Multi TimeFrames based in ( Average True Range ) to help you to take decision to buy or sell or waiting If there 4 green arrows in same vertical line that's mean (Up) and If there 4 Red arrows in same vertical line that's mean (Down) and the options contain (Alert and Mobile , Mail Notifications). Please watch our video for more details https://youtu.be/MVzDbFYPw1M and these is EA for it https://www.mql5.com/en/market/pr

The Dragon Trend indicator displays information in a visual form. The intelligent algorithm of the Dragon Trend indicator determines the trend with sufficient accuracy, filters out market noise and generates input signals.
One of the most beloved trends in price chart analysis is the use of chart analysis. The state of the market, the phase of its movement largely determines the success of the trader and the strategy he has chosen. The indicator uses color signaling: blue - when changing from

The key difference between the Trend Channel Generator indicator and other channel indicators is that the Trend Channel Generator takes into account not simple moving averages, but twice smoothed ones, which, on the one hand, makes it possible to more clearly determine the market movement, and on the other hand, makes the indicator less sensitive. Trend Channel Generator is a non-redrawing channel indicator based on moving averages.
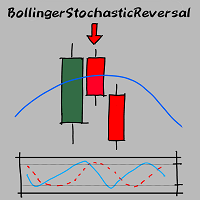
Hello Guys! I want to share with you a very simple but very effective indicator, which I use a lot in my daily trading. Bollinger bands are one of the most effective tools in trading, especially for those who like to operate on low time frames and prefer fast operations.
The indicator detects fast reversals: when the price close above or below the Bollinger Bands, but then re-enters in the Bands on the next candle, the indicator sends a signal and draws an arrow on the newly opened candle! It i

Victory Price Direction I'm glad to present you my new indicator. This indicator includes all the best strategies that I have researched. When developing and optimizing, I used ML algorithms. The indicator is very easy to use.
Now the indicator has 3 basic strategies and the ability to customize your own strategy. I am constantly looking for better strategies.
You get: A simple and effective indicator of reversals. The indicator will help you place Take Profit correctly. It

This indicator is an indicator that detects whether or not each moving average line is currently in the perfect order state. A perfect order is a state in which there are three moving averages on the FX chart, one for each of the short-term, medium-term, and long-term, lined up in the same direction in order to create a trend. The steeper the slope, the stronger the trend and the longer it tends to last. Many traders are aware of this perfect order. Perfect orders include uptrend perfect orders
All moving averages in one indicator
Have you ever wanted an indicator which contains all types of moving averages and show you when they cross? And at the same time works on all timeframes and it's very simple to configure? Well, now it's your chance to have it , because I am very glad to bring you another of my best creations : ALL in one MA indicator
This indicator is the base indicator used for this strategy. https://www.mql5.com/en/market/product/54168#!tab=overview
Features The w

The five guardians
This indicator is a combination of the next indicators, each with their own settings. CCI MACD ADX DMI STOCHASTIC
When all five of them align with the same movement we get a green color which represents the buy movement , and contrary we have a red color which represents a sell movement. If its gray, its undecided, and we have to wait until a better signal will appear.
Logo made by https://www.fiverr.com/aleksa19
Features Beginner friendly tools that incorporates one of the most useful indicators into simple and efficient strategy. This oscillator merges MA of RSI and parabolic SAR based on MACD values. Compared to standard parabolic SAR you'll see it is smoother and it seems likely to identify better significant price breaks. You will also have histogram that shows price bias and to assist with making trading decisions based on alignment.
Market to run
It can be adapted to all type of trading styles
Features A n indicator will be given if we have a break on high volume.
Up Arrow
Volume> Average_Volume * Multiplier
Price> Highest Price for Last N candle, plus set, Pip / Percentage Value
Down Arrow
Volume> Average_Volume * Multiplier
Price <Lowest Price for Last N candle, minus set, Pip / Percentage Value
Market to run
It can be adapted to all type of trading styles such as scalping, day trading or swing. It doesn't matter if its forex, stock , crypto and so on. It can be adapted an
DMI ADX Histogram Oscillator I present you one of the most precise and powerful indicator Its made of DMI Histogram together with ADX Oscillator. It has inside arrow to show a buy or sell setup.
Features The way it works its the next one : the histogram is a difference between DMI+ and DMI-. At the same time together we have the oscillator ADX for
Market to run
It can be adapted to all type of trading styles such as scalping, day trading or swing. It doesn't matter if its forex, stock ,
The indicator is designed for trading binary options on small timeframes up to 15 m Easy to use does not need additional settings and can be used without additional filters Recommendations for trading When a signal appears (blue arrows pointing up), you need to consider the buy direction When a signal appears (the red line indicates the bottom), you need to consider the direction to sell To conclude a deal is on the candle where the signal for one candle came, if the signal turned out to be unpr

It is an indicator that analyzes the high and low prices in real time by Dow theory, draws a trend line, and draws the predicted arrival point in the Box format after breaking the low price and the high return price. The high and low prices are determined by the nBars parameter (initial value = 5), but displaying the corresponding moving averages (SMA and EMA 4 to 5 times nBars) at the same time makes it easier to understand the trend change. (D ownload the demo version of the free GreenBox and

Günlük Trend Ölçekleyici (DTS) Bu gösterge, RPTrade Pro Solutions sistemlerinin bir parçasıdır.
DTS, Fiyat Hareketi, Dinamik Destek ve Dirençleri kullanan günlük bir trend göstergesidir. Herkes tarafından kullanılmak üzere tasarlanmıştır, ticarete yeni başlayanlar bile kullanabilir. ASLA yeniden boyamaz. Endikasyonlar yakından kapana doğru verilmiştir. Tek başına kullanılmak üzere tasarlanmıştır, başka bir göstergeye gerek yoktur. Günün başında size trend ve potansiyel Take Profit verir.
O n
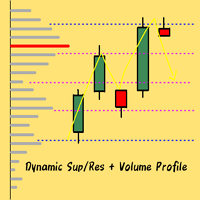
!!!REVISION 3 OF THE INDICATOR HAS BEEN RELEASED! IF YOU WANT TO TRY THE INDICATOR FOR 1 MONTH FOR FREE JUST WRITE ME NOW!!!
DYNAMIC LEVELS + VOLUME PROFILE + REGRESSION CHANNEL Hello Guys! Revision 3 of the indicator has been released! The indicator plots SUPPORTS AND RESISTANCES DYNAMICALLY on the chart, identifying different levels of interest based on the price action. Every trader knows that indicators are important, but they often provide the signal "with a candle of delay", therefore whe
Это стрелочный индикатор. Он выбирает данные от 23-х стандартных индикаторов и расчитывает уровень сигнала который показывает предполагаемое движение цены инструмента торговли. Минимальный уровень сигнала индикатора установлен в пределах -100 до +100%. Используйте усреднение для формирования сигнала.
Как работать с индикаторам.
Следим за сигналом и принимаем решения. Индикатор перерисовывается только на нулевой свечи, поэтому решения принимаются после закрытия свечи с новым сигналом, и сигнал
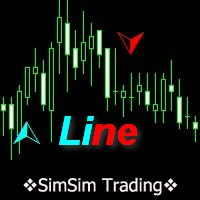
Это линейный индикатор. Он выбирает данные от 23-х стандартных индикаторов и рассчитывает уровень сигнала, который показывает предполагаемое движение цены инструмента торговли. Минимальный уровень сигнала индикатора установлен в пределах -100 до +100%. Используйте усреднение для формирования сигнала.
Как работать с индикаторам.
Следим за сигналом и принимаем решения. При пересечении нулевого уровня индикатора снизу вверх можно рассматривать покупки. При пересечении нулевого уровня сверху вни
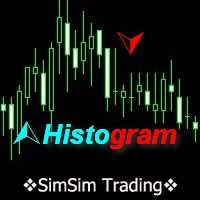
Это индикатор гистограмма. Он выбирает данные от 23-х стандартных индикаторов и расчитывает уровень сигнала который показывает предполагаемое движение цены инструмента торговли. Минимальный уровень сигнала индикатора установлен в пределах -100 до +100%. Используйте усреднение для формирования сигнала.
Как работать с индикаторам.
Следим за сигналом и принимаем решения, цвета гистограммы показывают когда возможны покупки а когда продажи, или нейтральный цвет - сделать паузу. Индикатор перерисов

Stochastic force is an advanced version of the stochastic oscillator. Instead of using the regular price a more efficient price data is provided as an input for the oscillator which takes into account the price efficiency, volume and market noise. Also price is pre-filtered with the selected average type and then post-filtered by a hull moving average which provides a smooth transition of the oscillator. It eliminates maximum false signals and has the potential to become an integral part of any

Trend Harvester is yet another trend indicator with flat detection. It uses price series and Moving Average for detecting market trend.
For better result I would recomend to play with parameters.
Lower periods will force to react to short trends.
Higher periods will try to show longer trands.
You can set the same period for Price Series and Moving Average for quick test.
You can also choose Moving Average type between "Regular" and "Zero Lag".
"Zero Lag" type improves reaction to trend change.

VertexFilter - это индикатор соединивший в себе классический zig zag и осциллятор. Принцип действия следующий: когда регистрируется новый максимум или минимум, это делается с помощью индикатора zig zag, индикатор ждет смены направления движения цены, это делается с помощью осциллятора, в такие моменты появляются сигналы на покупку и продажу. Таким образом индикатор подает сигналы когда цена меняет направление движения вблизи экстремумов. Это позволяет отфильтровать ложные сигналы. Индикатор имее
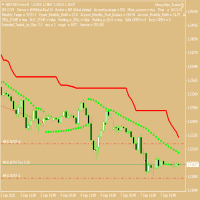
ATR Stops Attach to chart of any timescale Length = 10 ATR period = 9 kv = 6 I use this set up on a one hour chart, basically the blue line indicates an upward trend while the red line indicates a downward trend All setting can be used on any chart period, If you don't like the settings I use then just play around with the settings on any chosen time period until you find a setup which suites your trading style
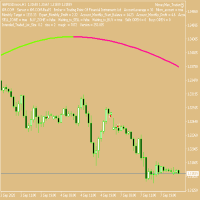
MA with Trend colour Attach to chart of any timescale MA period = 200 buffer = 1 I use this set up on a one hour chart, basically the green line indicates an upward trend while the red line indicates a downward trend All setting can be used on any chart period, If you don't like the settings I use, then just play around with the settings on any chosen time period until you find a setup which suites your trading style

The indicator allows you to trade binary options. The recommended time frame is М5 and the expiration time is 5 minutes. The indicator suitable for auto and manual trading. A possible signal is specified as a arrows above/under a candle. You should wait until the candle closes and entry the trade at new candle Arrows are not re-painted Trade sessions: Any Currency pairs: ( recommended) AUD/CAD Working time frame: M5 Expiration time: 5,10,15 minute Up buffer: 1, down buffer: 0 *** Use with bro

The indicator allows you to trade binary options. The recommended time frame is М5 and the expiration time is 5 minutes. The indicator suitable for auto and manual trading. A possible signal is specified as a arrows above/under a candle. You should wait until the candle closes and entry the trade at new candle Arrows are not re-painted Trade sessions: Any Currency pairs: ( recommended) EUR/AUD Working time frame: M5 Expiration time: 5,10,15 minute Up buffer: 1, down buffer: 0 *** Use with brok

The indicator allows you to trade binary options. The recommended time frame is М5 and the expiration time is 5 minutes. The indicator suitable for auto and manual trading. A possible signal is specified as a arrows above/under a candle. You should wait until the candle closes and entry the trade at new candle Arrows are not re-painted Trade sessions: Any Currency pairs: ( recommended) AUD/NZD Working time frame: M5 Expiration time: 5,10,15 minute Up buffer: 1, down buffer: 0 *** Use with brok
It is a judgment tool that judges trends in 1 minute and supports discretionary trading.
Various usages 1. It is used to recognize the environmental advantage of buying or selling with the color of the line. If the line is red, it is advantageous to buy. If it is blue, it is advantageous to sell. Neither if there is no line. 2. Used as a guide for entry by signing the entry. Red arrow long Blue arrow short 3.Used as a guide for closing (Even if there is no entry sign, the close point will be s

This indicator is intended for professionals assessing fundamental market trends. This indicator calculates the index of any instrument and analyzes it. The index of the state currency shows the real purchasing power of this currency, and the dynamics of this index shows the dynamics of the economic state of the corresponding state. An analysis of the indices of both currencies included in a currency pair makes it much more reliable to identify the trend of this cur

Bearish/Bullish divergent bar . One of the signals of the "Trade Chaos" system of Bill Williams. (First wiseman)
When bar moving away from the "Alligator" indicator and there is divergence on the Awesome Oscillator indicator, it shows a potential point of movement change.
It is based on the opening/closing of the bar, the position relative to the previous ones, the Alligator and AO.
When trading, the entrance is at the breakthrough of the bar(short trade - low of bar, long trade high of bar), a

The strategy works on the ECN account (5min and more)
Inside bar : with the direction of movement average 200 (you can change 200 it if you want). when the price is on the MA the indicator only gives the buy sign, and the opposite if the price is below the MA 1 Buy: The indicator draws a blue line, when a candle closes above that line and the price reverses towards the line, Buy from that blue line. Put the stop on the red line and the take profit on the yellow line TP1, or green line TP2 2
ATR on Chart has been made for anyone wants to easily analyze ATR from Price Chart. It will show ATR rang and you can apply with each bar or MA .
When price touches the line it means it is trending to that side .
Please be aware that this indicator DOES NOT point out the momentum of trending. I r ecommend to use this indicator to find : https://www.mql5.com/en/market/product/55009
Input d escription : ATRperiod = Setting of ATR period. ATRmulti = Multiply value from ATRperiod . Mode = se

the indicator will show signal arrows on the graph at the crossing of a given level it has push and audible alerts. By crossing from low to high level 0.3, a blue arrow will come out for the purchase, at the same time an audible signal will sound. By crossing from low to high level 0.7, a red arrow will come out for the sale, at the same time an audible signal will sound. Possibility to deactivate push and audible alerts.
MT5 version : https://www.mql5.com/en/market/product/51968

The indicator allows you to trade binary options. The recommended time frame is М5 and the expiration time is 5 minutes. The indicator suitable for auto and manual trading. A possible signal is specified as a arrows above/under a candle. You should wait until the candle closes and entry the trade at new candle Arrows are not re-painted Trade sessions: Any Currency pairs: ( recommended) EUR/CAD Working time frame: M5 Expiration time: 5,10,15 minute Up buffer: 1, down buffer: 0 *** Use with brok

This indicator Super XT indicator.Indicator displays trend movement. Indicator calculates automatically line. Features
FiltPer - displays indicator period. Window - displays indicator trend (true/false).
Trend - displays indicator trend (true/false).
X - move the trend left and right. Y - move the trend up and down.
How to understand the status: If the Trend color is green, trend is up.
If the Trend color is red, trend is down.
////////////////////////////////////////////////////////

Mr Pip Trend indicator combines powerful price action analysis and sophisticated algorithmic data analysis to provide traders with high-accuracy chart analysis and support the decision-making process. You can use Mr Pip Trend Indicator to trade all the markets (all Forex pairs, all CFDs and Cryptocurrencies) on all timeframes! Mr Pip Trend Indicator provides chart analysis that is effective at detecting new trends but finds the exact sweet-spot between early and late entries. What is different
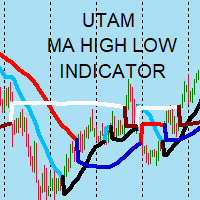
Nice Day! - A moving average candle indicates a high and low turn trend.
- MA_vonal_vastagsaga: MA_line_thickness. - MA_vonal_szine: MA_line_color. - MA_vonal_szine_long: MA_line_color_long. - MA_vonal_szine_short: MA_line_color_short. - mql5.com can also be used for my robots. Szép Napot! - Mozgó átlag gyertyájának magas (High) és alacsony (Low) fordulos trend jelzése. - mql5.com robotjaimhoz is használható.

What you can do with CandleStick CandleStick is a useful indicator for doing MTF analysis. This indicator displays the CandleStick of another time frame on the chart . By understanding the information in multiple time charts at the same time, it is easier to understand the overall market view. It is also a useful tool for validating and studying past quotes and trades. There are similar products made by others, but I designed and developed it so that it is easy for me to use.
Features of Candle

Indicator developed with precision algorithm that seeks moments of strong trend in the markets. Reconciled with an algorithm that seeks high volume moments in the market. I recommend using timeframes M15 to H1. I also recommend an optimization to your liking for your best currency pairs. Any questions, do not hesitate to ask. Buy EA based on this indicator CLICKING HERE This is an excellent trigger indicator for your trading system. If you already operate a trend and want an indicator to show y

Grafikte bir boşluğun görünümünü gösterir (önceki çubuğun kapanış fiyatı yeni çubuğun açılış fiyatından farklı olduğunda). #1 çok fonksiyonlu araç: 66+ özellik, bu gösterge dahil | Bana ulaşın sorularınız varsa | MT5 sürümü Başlangıç ayarlarında şunları yapılandırabilirsiniz: Boşluk boyutu (puan cinsinden): yalnızca bu değeri aşan boşluklar gösterilecektir. Ok rengi : yukarı ve aşağı boşluklar için ayrı ayrı. Grafikteki boşluk oklarının üzerine geldiğinizde, boyutları görüntülenecektir

The indicator allows you to trade binary options. The recommended time frame is М5 and the expiration time is 5 minutes. The indicator suitable for auto and manual trading. A possible signal is specified as a arrows above/under a candle. You should wait until the candle closes and entry the trade at new candle Arrows are not re-painted Trade sessions: Any Currency pairs: ( recommended) EUR/NZD Working time frame: M5 Expiration time: 5,10,15 minute Up buffer: 1, down buffer: 0 *** Use with b

We know for sure that The Fibonacci sequence is a science used to calculate or estimate target distances.
How does this indicator work? 1. Tell the spread status 2. Tell me the current price 3. Indicate whether the candlestick status is bullish or bearish on each time frame. 4. Indicates the status of the past 2 candles 5. Tell Pivot Point 6. Tell the Fibonacci sequence. 7.The Fibonacci measurement can be set. 8. Pivot can be set backward. 9. Look at support and resistance.
Suitable for 1. Da

Squat bar.
One of the signals of the "Trade Chaos" system of Bill Williams.
It is calculated based on the difference in price changes and tick volume.
Strengthens the signal of the "Bearish/Bullish Divergent Bar (First Wiseman)" if it coincides with it or is nearby.
Tested in comparison with the original program "Investor's Dream".
For more effective development of the system, read and see the materials of Bill Williams.
In the settings you can choose the color and width of bar. (Width: 3-if

TorN ( Trend or Not ) has been made from ADX problem on fixed level. Only fixed level is hard to find trending or not. Now I find the better method to analyze ADX with MA . You can use this signal to confirm your trending strategy. (Or use it to find Sideway)
The best signal is signal line get higher than MA line and fixed level. ( Recommend to use level value same as ADX period or higher ) If signal line lower than MA line on Any level is mean weakening trend.
Please be aware that thi

This type of arrow indicator works without redrawing signals. The signal on the indicator is shown as arrows (in the direction of movement). It is very simple and effective to use in the Forex market. Type of trading: "Scalping" It is applicable and performs well in intraday trading, as well as long-term trading. Сигнал на индикаторе показан в виде стрелок ( по направлению движения).
Очень прост и эффективен в применении на рынке Форекс.
Вид торговли: " Скальпинг"
Применим и хорошо себя по
Indicator with an innovative algorithm for determining the direction of the trend. Shows the best results for determining the trend on any currency pairs, stocks, cryptocurrency without redrawing the result. It will help you immediately determine the profitability of the current pair and timeframe. Uses Price action patterns in conjunction with the author's unique algorithm. Suitable for both beginners and professionals for all types of trading. How to choose a profitable timeframe and optimize

Reversal Sniper is designed to find the extreme reversals of the price. Indicator collects data of Cycle Sniper Indicator.
NOTE: REVERSAL SNIPER Indicator is made for Cycle Sniper Users as an additional tool. However, it can be used by the traders who look for finding out strong reversal levels.
Indicator works on all timeframes and all instruments.
Reversal Sniper Checks: Harmonic Patterns RSI Zig Zag and Harmonic Swings Cycle Sniper Indicator's Buy / Sell Signals The complex algo is bas
The Icarus Signals Continuation(TM) Indicator is a simple, but highly effective tool for identifying strong price trends, both long and short, across all time-frames and instrument types. The Icarus Continuation Indicator allows users to plot individual markers for each bar, when price has extended into a high-probability trend area, after a set level of extension. The Continuation Indicator allows users to fully optimise each of the unique Icarus settings to best fit a particular trading s

The Knowledge of which Geometry aims is the knowledge of the Eternal - Plato Quant Stress Scanner is a Scientifically developed Stress detection algorithm along the geometrical lines on the price data which are quantified into Stress repulsion, fractures and clusters in a easily understandable signal form. Each signal are displayed in well-arranged with currency pairs in row-wise and timeframes in column-wise manner. Explanation of signal and plotting stress levels with trendlines are shown in

Description
Range Detector is an indicator that identifies impulses in the market and displays their slope angles on the chart.
Recommendations
You can use this indicator to determine a trend and, accordingly, to determine the direction of opening a position or closing an opposite position.
Parameters
===== _INDICATOR_SETTINGS_ ===== - indicator settings
Maximum History Bars - maximum number of history bars for calculating the indicator. Average True Range Period - ATR indicator p
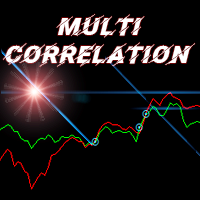
Indicator of correlation of two trading instruments.
Ideal for pair trading.
Example of use: if there is a significant divergence of correlated trading instruments, open two deals in the direction of each of them. Trades are closed when the correlation lines are crossed. Settings: First symbol (if empty - current) - The first trading instrument (if empty, the current one); Second tool (if empty - current) - Second trading instrument (if empty - current); Number of bars - Number of bars for ca

This is an alert for when price is above the 200 ema, macd is below its zero line and the slow ma crosses above the fast ma and vice versa for sells. It has been tested 100 times as seen on youtube and has a 65% win rate on the 30 minute time frame.
I've attached a video to explain how to use it. Under the vuideo is a link to Trading Rush video where he tests the strategy 100 times on 30 minute.
(1) INDICATOR PARAMETERS
MA Period . Default is 200 MA Type . Default is

The original BoomTroom trend indicator. With this indicator, you do not need to sit near the computer and wait for the inflection point to appear day and night.
How important it is to determine the trend in the stock market or the Forex market! Still not sure how to determine the inflection point of a trend? Are you still worried about how to draw short-term and long-term trend lines? Run this smart utility. You will see pivot points of varying strength, as well as long-term and short-term tre

The Unique Trend indicator tracks market trends, ignoring sharp fluctuations and market noise. The indicator is suitable for trading on small timeframes because it ignores sudden price jumps or price corrections due to the reduction of market noise around the average price.
The scan at minima and maxima forms the internal boundaries (channel) when calculating the indicator signals. The channel allows you to remove market noise. iMA and iATR are used to generate signals using the author's algor

Implementation of indication of trend movement with moments for potential stops in the Cloud Power indicator.
The transition to the shadow warns of a possible reversal. The entry of the price inside the shadow speaks of a flat movement. The indicator tracks the market trend with unmatched reliability, ignoring sharp market fluctuations and noise around the average price. Simple, visual and efficient use. The indicator does not redraw and does not lag.
It can be easily used as an independent t

The Forex market can go through many different price paths to reach a point in the future. The future is dynamic. Therefore, planning a trade with a possible future scenario is an essential step for your success. For these purposes, we present to your attention Trend Units.
A unique author's strategy that simultaneously determines the strength of trends and points of entry into the market, visualizing it using arrows on the chart. The indicator is optimally adapted for trading on time periods
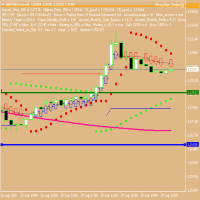
My Trend Finder
//**************************** FREE signal that uses all three of my indicators feel free to copy see link below https://www.mql5.com/en/signals/1318509?source=Site +Signals+My //**************************** period is the only setting basically number of bars on your chosen timeframe, Attach to chart of any timescale Period in bars = 7 which is a short monitoring period, 100 would be longer monitoring I use this set up on a one hour chart, basically No arrow means not su
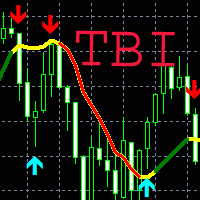
Простое визуальное и эффективное обнаружение тренда.Сигнал поступает на " закрытой свече ".Работает на всех символах и таймфреймах.Индикатор не использует входных параметров.Все алгоритмы для расчета заложены в код.Индикатор может использовать для разработки советников.Изменение цвета индикатора,характеризует поведение рынка.Зеленый цвет сигнализирует восходящее движение.Красный цвет сигнализирует о нисходящем движении.Желтый цвет показывает флет.Желаю всем удачной торговли!!!

LSM Basket Indicator is a ideal tool to trade "Basket Currency" for scalping/day trading or swing trading. Imbedded tools: 1. MTF(Multi Time frame) Basket Currency Trend filtering system . 2. Identify Basket Currency Trend reversal Area (Combined with " SupplyDemand Zones Indicator " ) 3. Basket Currency Strength indicator. 4. Chart Symbols Changer.(please see video) 5. Symbol daily change %.
Parameters:
Alert On "Reached Buy level/Sell level: true/false Alert On "Enter Supply Demand

Trend Code (v2.0) Trend Code is a very simple and yet effective trend indicator to capture trend movement, detect the trend reversal, calculate entry price as well as proper stop loss. Trend Code indicator is made up of a series of block, while bull trend block in bull colour and bear block in bear trend colour. For bull trend block, the TrendOpen is the lower edge, TrendClose is the upper edge, for bear trend block, the other way round. Parameters: TrendOpenAdjustment = 0.8, (range 0~1.0) Tr

Icarus Bolli-Band Change Display(TM) Indicator is a simple, but highly effective tool for visually identifying areas where the all-important 'Bollinger Band' values are in a state of expansion, contraction of neither. The traditional Bollinger Bands have been widely applied to trading charts globally since their creation by John Bollinger several decades ago. One of the limitations of the traditional Bollinger Bands is the ability to clearly identify when the bands are in fact expanding or contr

Hit Man is an indicator for determining the trend, complements any strategy, and can also be used as an independent tool. Professional indicator for determining the trend and entry points. It uses a unique filtering algorithm to determine the trend. Shows a change in the direction of price movement on any currency pairs, without redrawing the result. Suitable for determining entry points for scalping and swing, as well as for intraday, medium-term trading.
Benefits Suitable for all types of tr
MetaTrader mağazası, alım-satım robotları ve teknik göstergeler satmak için en iyi yerdir.
MetaTrader platformu için ilgi çekici bir tasarıma ve iyi bir açıklamaya sahip bir uygulama geliştirmeniz yeterlidir. Milyonlarca MetaTrader kullanıcısına sunmak için size ürününüzü Mağazada nasıl yayınlayacağınızı açıklayacağız.
Alım-satım fırsatlarını kaçırıyorsunuz:
- Ücretsiz alım-satım uygulamaları
- İşlem kopyalama için 8.000'den fazla sinyal
- Finansal piyasaları keşfetmek için ekonomik haberler
Kayıt
Giriş yap
Gizlilik ve Veri Koruma Politikasını ve MQL5.com Kullanım Şartlarını kabul edersiniz
Hesabınız yoksa, lütfen kaydolun
MQL5.com web sitesine giriş yapmak için çerezlerin kullanımına izin vermelisiniz.
Lütfen tarayıcınızda gerekli ayarı etkinleştirin, aksi takdirde giriş yapamazsınız.