 MetaTrader 5
 Эксперты
 Индикаторы
 Библиотеки
 Утилиты
 Виджеты
 Правила
Смотри обучающее видео по маркету на YouTube
Как купить торгового робота или индикатор
Запусти робота на
виртуальном хостинге
виртуальном хостинге
Протестируй индикатор/робота перед покупкой
Хочешь зарабатывать в Маркете?
Как подать продукт, чтобы его покупали
Технические индикаторы для MetaTrader 4 - 84
 На основании сигналов технических индикаторов из списка ниже вы сможете принимать решения относительно открытия или закрытия сделки в платформе MetaTrader 4.
Работа индикаторов заключается в математическом преобразовании цены и/или объемов финансового инструмента для прогнозирования изменений цен.
Intraday Signals is a visual and effective semi-automatic trading system, that: generates possible entry points to open BUY and SELL trades; displays recommended Take Profit and Stop Loss; displays current profit on open trade; displays current spread. The profitability of the indicator is shown in the screenshot on the example of the GBPUSD pair Does not redraw and works on opening bar. Time frames - M1-H1. Recommended TimeFrame-M5-M15. Signals are produced based on the used of HMA, Laguerre

5 signal in 1 Product TimeFrame Recommend 1m-5m
Banks Pro Binary Option is Indicator for binary option Can Use Manaul Trade or Robot on Platform Mt2Trading https://www.mt2trading.com/?ref=104 Time Trading good work EU US session Recommend Curency EUR GBP USD careful AUD JPY Recommend Martingale 2-5 Step
Recommend set profit 1%-5%/Day Setting Brake News Event High volatility recommend 15-30 min
Have Problem Contract Telegram @BinaryBanks Email a
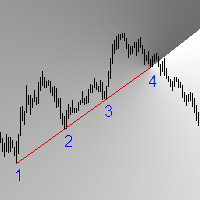
Это полноценная Price Action торговая система, основанная на поиске точек входа в момент пробития ценой трендовых линий. Индикатор находит и рисует линии поддержки, сопротивления и горизонтальные уровни. Когда цена пересекает эти линии, индикатор подаёт звуковой сигнал Алерт и присылает Push-уведомление. Так же вы можете рисовать свои собственные линии, и индикатор тоже будет работать с ними и подавать сигналы Алерт и Push-уведомления о пересечении ценой ваших линий. Ваши собственные линии оста
Трендовый индикатор с подтверждающим сигналом. В нижний части графика строится гистограмма с силой сигнала от 1 до 2 при сигнали на покупку и от -1 до -2 при сигнале на продажу. Индикатор подходит ко всем периодам графика и ко всем валютным парам. На основном графике отрисовываются стрелки сигнализирующие о вхождения в сделку. В верхнем правом углу отображается инфопанель с ценой входа в сделку текущей ценой прибылью в пунктах информация по текущему сигналу - покупка или продажа. Индикатор нас

This scanner is monitoring the entire market for Ichimoku trade opportunities for all symbols and for all time frames. You don't have to look to all the charts, for all symbols and for all time frames. This scanner will alert you on your computer, or on your mobile, when a trade opportunity has been found. You never have to miss a trade opportunity! This indicator is designed to scan all pairs and symbols, for all selected time frames, to find a Tenkan and Kijun Cross or a breakout of the Ich

Индикатор предназначен для торговли бинарными опционами на малых таймфреймах до м 30 Сигналы Синяя стрелка вверх это сигнал на покупку Красная стрелка вниз это сигнал на продажу Сигнал появится вместе появлением новой свечи и во время формирования Сигналит на текущую свечу Время экспирации одна свеча от таймфрейма на котором торгуете Для фильтрации ложных сигналов можно использовать moving average Или уровни поддержки сопровождения Надежный и верный помощник в торговле.
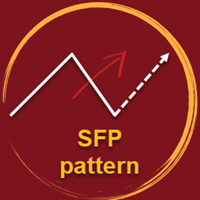
A Swing Failure Pattern ( SFP ) is a trade setup in which big traders hunt stop-losses above a key swing high or below a key swing low for the purpose of generating the liquidity needed to push price in the opposite direction. When price 1) pierces above a key swing high but then 2) closes back below that swing high, we have a potential bearish SFP . Bearish SFPs offer opportunities for short trades. When price 1) dumps below a key swing low but then 2) closes back above that swing low, we have
This indicator is designed to scan all pairs and symbols, for all selected time frames, to find a cross of moving averages. The 4 Moving Average Strategy
The scanner has 4 moving averages: - 2 moving averages to define the trend - 2 moving averages are used to find the right moment to send an alert
If the fast trend MA is above the slow trend MA, than it is considered as a bullish market and it will only provide bullish alerts. If the fast trend MA is lower then the slow trend MA, it is conside

Трёхуровневый цифровой фильтр тренда. Индикатор не нуждается в настройке. Просто установите и работайте! Предварительно подберите необходимый рабочий таймфрейм и торговый инструмент, визуально подходящие для торговли. Сигнал не перерисовывается на сформированной свече!
Не забудьте посмотреть другие мой продукты - https://www.mql5.com/ru/users/altiveus/seller . Приобретая мои продукты, вы поддерживаете разработку нового программного обеспечения. Так же купив любой мой продукт вы получаете скидку

Ultimate Scalper Pro checks for Early Entries , the used algorithm is based on CCI, RSI, MA, ATR.
This indicator is a powerful trend one, it shows the ma rket clearly , NO Noise , NO Repaint . you can use it with your own strategy or indicator, personally i use it with CCI, MFI, my own TMA bands non repaint and CSS indicator, it gives entry with the Lowest Drawdown , especially when used with (oversold and overbought) indicators and currency strength indicator.
Basically entries like thi

A two-lines crossover oscillator for market entry and exit. Use on M15 and above for better accuracy. Place indicator on a second chart with the same currency pair and expand for a better view. The indicator gives one a good idea of volatility, volume and trend. Works on any currency pair, yet extremely well on currency pairs with good daily PIP volatility such as GBPJPY, GBPNZD and exotic currency pairs. Use during major market sessions such as London and London-New York overlap for best result
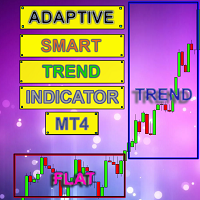
Интеллектуальный индикатор Adaptive Smart Trend Indicator определяет секторы Тренда и Флета и также в виде гистограммы показывает точки пробоя уровней (1 - 5).
Индикатор проводит множество математических вычислений для отображения на графике более оптимальных Трендовых движения.
Программа содержит два индикатора в одном: 1 - рисует секторы Тренда и Флета, 2 - индикатор гистограмма показывает наиболее хорошие сигналы для открытия ордера. Индикатор автономно вычисляет наибол

The Rise of Sky walker is a trend indicator is a powerful indicator for any par and any timeframe. It doesn't requires any additional indicators for the trading setup.The indicator gives clear signals about opening and closing trades.This Indicator is a unique, high quality and affordable trading tool. Can be used in combination with other indicators Perfect For New Traders And Expert Traders Low risk entries. Never repaints signal. Never backpaints signal. Never recalculates signal. Great F

Идея искать паттерны по зиг-загу принадлежит Marat_tech , реализация и расчеты в больше мере мои.
Этот индикатор ищет такие модели рынка как: голова и плечи, треугольники, двойные вершины и основания,флаги, клинья и три касания.
Параметры:
barsToProcess - первоначальное количество баров для расчета;
ArrowSize - размер стрелок;
AllowablePatternLength - минимальная длина паттерна (в барах);
AllowablePatternPriceDiv - минимальная высота паттерна, применим для всех, кроме паттернов "голова и плеч
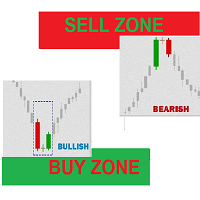
Simple indicator for BUY / Sell Zones moving Buy and Sell zones : Closest zone is wide and clear : Red for Sell zone , Green for Buy zone >>> old far zones are in bold lines :::BUY Zones (GREEN) appear only in UP Trend and disappear in DOWN Trend :::SELL Zones (RED) appear only in DOWN Trend and disappear in UP Trend input parameters ::: index bars : bars range for zone calculation levels : number of zones Up move/Down move arrows mail and message Alerts !! used on any symbol used on any timefr
Diverence Dash is a MACD, RSI, OBV, Momentum, Stochastic or Standard Deviaviation Divergence Dashboard. It will scan all symbols and timeframes you want. Also, Divergence Dash can open charts with the divergence found using the template of your choice. Divergences are often used as a leading indicator and, by using Divergence Dash, are easy to spot. The risk/reward ratio in divergence trading is very low. What can Divergence Dash for you: Find MACD, RSI, OBV, Momentum, Stochastic or Standard Dev
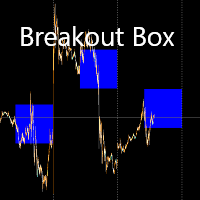
A breakout box that can set for the start of any of the major trading sessions - Hong Kong, London, London-New York overlap. Set the width of the breakout box in points (10 points=1 PIP) Use it to gauge if the currency pair you are trading in is in a channel or not. Trade once price breaks out from the box. Use with a volume and momentum indicator for best results. You may change the colour of the box to suit your individual preference and chart colour scheme.
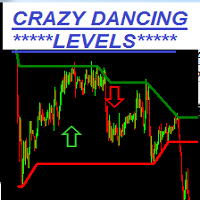
Crazy Dancing moving RES/SUP Levels Automatic redrawing of moving Supports and resistances levels to indicate price breaking supports (signal SELL) or breaking resistance levels (signal BUY) Very simple appearing indicator but very clever and smart too !!!! Main Inputs: # of bars for the support and resistances levels + the initial shift from start + moving average for filter signaling Smaller values for bars /shift inputs when using Higher Time frames (D1-H4) and the reverse higher values for
mql5 version: https://www.mql5.com/en/market/product/44815 Simple indicator to calculate profit on fibonacci retracement levels with fixed lot size, or calculate lot size on fibonacci levels with fixed profit. Add to chart and move trend line to set the fibonacci retracement levels. Works similar as default fibonacci retracement line study in Metatrader. Inputs Fixed - select what value will be fix, lot or profit Fixed value - value that will be fix on all levels Levels - levels for which to ca
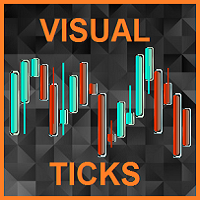
A real rarity for scalpers.
Are you looking for TFs lower than M1 ?
Do you want to see the price dynamics inside the candle?
This is a tool for you.
Visual Ticks is an indicator that shows the tick chart in a separate window.
He does it in real time waiting for changing ticks.
Thanks to Visual Ticks, we can look inside the traditional candle and see the dynamics of the moving price.
By setting "period_of_model" we can shape a chart made of candles.
"period_of_model" defines how many consecuti
Данный инструмент хорошо себя зарекомендовал при тестировании на рынке форекс на валютной паре EUR/USD.
Так же тестировали для Бинарных опционов этот инструмент смог показать хорошие качество сигналов на валютной EUR/USD.
СИГНАЛЫ НЕ ПЕРЕРИСОВЫВАЕТ ПЕРЕМЕЩАЯЕТ СТРЕЛКУ НА 1 СВЕЧУ МАКСИМУМ ТАКОЕ ВСТРЕТИТЬСЯ КРАЙНЕЙ РЕДКО
Сигналы данного инструмента формируются во время свечи входить в сделку стоит после закрытия свечи на которой был сформирован сигнал.
Стрелка зелёного цвета обозначает возможно
Индикатор спреда между двумя парами инструментов c функцией автоматического восстановления пропущенных баров.
Данный индикатор позволяет автоматически восстановить бары по усредненным ценам соседних баров в случае, если один из инструментов их в истории. Является продолжением Pair Spread Indicator . Основные функции индикатора: График в виде гистограммы показывает разницу в цене между двумя инструментами в отдельном окне. Идеально подходит для связанных инструментов, например: BRN -- WTI, G
KT Power Pennant обнаруживает и отмечает на графике известную фигуру «вымпел». Вымпел — это фигура продолжения тренда, характеризующаяся значительным движением цены в одном направлении, за которым следует период консолидации с сходящимися линиями тренда.
После формирования фигуры вымпела подаётся сигнал на покупку или продажу в зависимости от пробоя вверх или вниз после завершения модели.
Особенности
Фигуры вымпела обеспечивают вход с низким риском после фазы консолидации и последующего пробо

Special Offer, The Prices For Limit Time Golden Sign is an indicator that signals entry into buying or selling positions that works best on GBPs pairs and a 4-hour frame. It can make 20 to 200 Pips at every signal. Its success rate is over 80%. It contains two types of signal for each direction, one is slow and the second is faster. You can use any of them, but when the two combine together they are the strongest signal. Or you can add it to your strategy. Note: (Make sure to download the clear
Индикатор сочетает в себе несколько видов расчета: расчет ценовых каналов и определение направления тренда. Зелена линия - сигнал к покупкам ; Пурпурная линия - сигнал к продажам . Две желтые линии "маленького" канала выше средней зеленой линии - готовимся в продажам; Две желтые линии ниже пурпурной линии - готовимся в покупкам. Синие линии каналов - чем выше расстояние между линиями, тем ближе откат цены или разворот тренда. Индикатор можно использовать как в трендовых торговых системах, так и

Представляю Вашему вниманию, комплексный индикатор, основанный на математических, исторических и ценовых вычислениях. Индикатор будет весьма полезным в построении собственных торговых стратегий и систем. На что способен индикатор : 1. Строит каналы, основываясь на ценовых уровнях. Определяет силу канала и отражает ее визуально (чем жирнее линия, тем значимее канал. Пунктирная линия- самый слабый канал) 2. Строит волны, основываясь на каналах (красная линия-бычье настроение, синяя
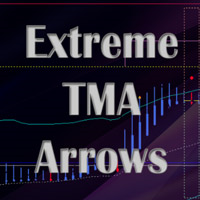
Extreme TMA System with Arrows Indicator And Buy/Sell Boxes with Take Profit & Stop Loss
This is a Non-Repainting Arrows Indicator based on the Extreme TMA System. It shows TMA cross signals and the best BUY/SELL signals. Along with the most predicted TakeProfit. And StopLoss based on TakeProfit ratio.
Please note: This is an Arrows only Indicator. Dashboard is sold separately here: https://www.mql5.com/en/market/product/44825
About Indicator: This indicator shows BUY/SELL Signal Arrows and
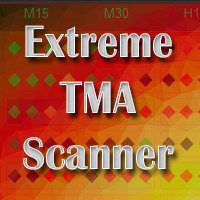
This Scanner Dashboard uses the Extreme TMA System Arrows Indicator to show good BUY/SELL signals. This Product contains dashboard only. It does not contain the Abiroid_Arrow_Extreme_TMA.ex4 indicator. Arrows indicator is not necessary for dashboard to work. To see arrows, you can buy the arrows indicator separately if you like: https://www.mql5.com/en/market/product/44822
Dash shows Slopes for current and Higher Timeframes. - 1st diamond is current TF. Next diamonds are higher TFs
(Please Not

Технический индикатор RSI Multi Timeframe Alert — это мощный инструмент, предназначенный для обеспечения всестороннего представления RSI (индекса относительной силы) одновременно на нескольких таймфреймах. С помощью этого индикатора трейдеры могут легко определять условия перепроданности и перекупленности на разных таймфреймах без необходимости переключаться между графиками. Он также включает в себя систему быстрого оповещения, которая отправляет мобильные и всплывающие уведомления, когда RS

Condors TMA ( Triangular Moving Average ) – это индикатор канала без перерисовки, строящийся на основании скользящих средних. Ключевое отличие индикатора Condor TMA от других канальных индикаторов (например, от того же Боллинджера) состоит в том, что Condor TMA берет в расчет не простые скользящие средние, а дважды сглаженные, что с одной стороны позволяет более четко определять движение рынка, а с другой стороны делает индикатор менее чувствительным.

Индикатор Cancer отлично подойдет для трендовой торговли! Интеллектуальный алгоритм индикатора с высокой вероятностью показывает точки потенциального разворота рынка. Если вы торгуете по тренду то стратегия торговли построенная на основе данного индикатора отлично ам подойдет. Индикатор фильтрует рыночной шум, приктически все и все необходимые функции для работы по треду встроены в один инструмент. Работает на всех валютных парах и на всех таймфреймах, настройка индикатора - по вашему желанию. Г

Для данного индикатора разработан новый алгоритм определения тренда. Алгоритм с приемлимой точностью генерирует входные сигналы и уровни выхода. Стратегия для торговли по тренду, фильтрация и все необходимые функции, встроенные в один инструмент! Принцип работы индикатора заключается в том, чтобы при размещении на график автоматически определять текущее состояние рынка, анализировать исторические данные, на основании исторических данных и выводить на экран трейдеру указания к дальнейшим действия

Inspired from, Time is the most important factor in determining market movements and by studying past price records you will be able to prove to yourself history does repeat and by knowing the past you can tell the future. There is a definite relation between price and time. - William Delbert Gann
CITRA BOT is a Price Action/Price Pattern detection Indicator which uses historical data to validate a current pattern or profile to predict the probability of hitting future resistance or support le
A real rarity for scalpers.
Are you looking for TFs lower than M1 ?
Do you want to see the price dynamics inside the candle?
This is a tool for you.
Visual Ticks is an indicator that shows the tick chart in a separate window.
He does it in real time waiting for changing ticks.
Thanks to Visual Ticks, we can look inside the traditional candle and see the dynamics of the moving price.
By setting "period_of_model" we can shape a chart made of candles.
"period_of_model" defines how many consecuti
O Touch VWAP é um indicador que permite calcular uma Média Ponderada por Volume (VWAP) apenas apertando a tecla 'w' no seu teclado e após clicando no candle do qual deseja realizar o calculo, clicando abaixo do candle é calculada a VWAP baseado na minima dos preços com o volume, clicando sobre o corpo do candle é calculado uma VWAP sobre o preço medio com o volume e clicando acima do candle é calculado uma VWAP baseado na máxima dos preços com o volume, voce tambem tem a opção de remover a VWAP
Select from up to 6 Strategies solo or Combine different strategies for signal generation (Combining more than 2 strategies may LIMIT a lot the number of signals)! ALL From Chart !!! Also Inputs editing from Chart !!! Push your strategy bottom (one strategy) OR Combine signal from as may strategies (up to 6) : Selected and enabled strategies will be in GREEN !!! 1- BUY SELL areas 2- Support resistance break signal 3- Elliot wave continuation /reversal signal 4- Advanced Moving averages 5- Tren
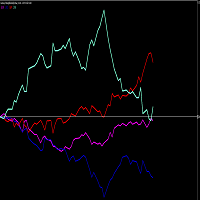
PLEASE NOTE THAT LIKE MANY SUCH INDICATORS ON THIS MARKET, THIS INDICATOR WILL NOT WORK AS A DEMO DOWNLOAD FOR STRATEGY TESTER. Therefore the 1 month option at the lowest cost allowed of $10 is available for you to test. One of the better ways to trade is to analyse individual currencies rather than currency pairs. This is impossible with standard chart indicators on MT4. This currency strength meter allows one to trade the USDZAR, EURZAR, GBPZAR. Each currency (not pair) is measured consta
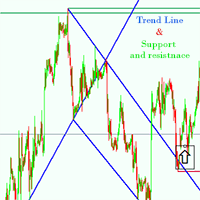
Support and resistance Strategy is one of the most widely used concepts in forex trading.
Strangely enough, everyone seems to have their own idea on how you should measure forex support and resistance. no more wasting time This Indicator is made to do it automatically for you, Features of support and resitance indicator * Automatically detection of the trend line and support & resistance * Works on any pair any time frame any time * Works on offline Chart Inputs : TrendLinePeriod=900 CycleSize
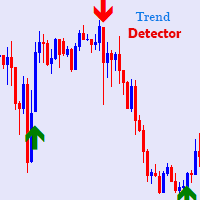
Trend Detector Trading Indicator is a trend following trading system based on the MT4 Platform that Detects the start of the Trend. Very simple and power indicator showing buy / sell arrows direction for trading currencies and commodities as well. one scan is done which generates certain trades, long and Short which takes 1 second to generate the entry/exit points,
Currency pair : EUR/CHF, EUR/GBP, EUR/JPY, EUR/USD, GBP/CAD, GBP/JPY, GBP/USD, NZD/USD, USD/CAD, USD/CHF . and All the Pairs you
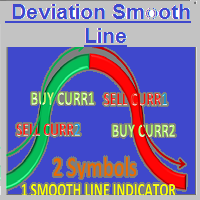
SMOOTH DEVIATION line indicator for 2 symbols It compares the power/strength lines of two user input symbols and create a SMOOTHED line that indicates the degree of deviation of the 2 symbols Strategy#1- FOLLOW THE INDICATOR THICK LINE when CROSSING O LEVEL DOWN --- TRADE ON INDICATOR THICK LINE (TREND FRIENDLY) !! Strategy#2- TRADE INDICATOR PEAKS (Follow indicator Reversal PEAKS Levels)!! you input - the index of calculation ( 10/20/30....) - the indicator Drawing start point
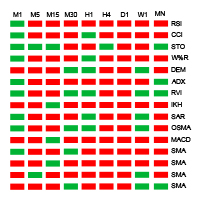
Indicator principle: Display all cycle trends of 15 indicators in one chart Oscillation indicator shows the current value of each cycle at the same time (RSI, CCI, STOCHI, W% R, DEM, ADX, RVI, IKH, SAR, OSAM, MACD, moving average, moving average crossing) RSI (Relative Strength Index) Trend level above red below green CCI (Commodity Channel Index) Trend level above red below green STOCH (Stochastic Oscillator) Gold fork red death fork green W% R (WilliamsPercent Range) Trend level above red bel
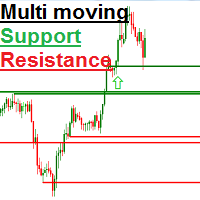
Simple 3 Moving supports and resistance levels (Your Review /comment and feedback is important !! Thanks) Signal UP and Down possibilities created on crossing the multi supports/resistance levels supports all time frames Adjusted inputs for area covered for generating the levels and the shifts needed to cover 3 areas supports /resistances levels for example you may use main parameters in M30 time frames: extern int ShiftFromStart=20; extern int barsCount=20; extern int sequenceShifts=50; in

Control Trading Support And Resistance
Es un indicador independiente del TimeFrame que permite proyectar niveles más relevantes del mercado en función del plazo de tiempo de la operativa. Los colores del indicador están escogidos para diferenciar entre los diferentes tipos de niveles y destacar a los más relevantes. Este indicador permite visualizar en un mismo gráfico los posibles objetivos relevantes que los diferentes traders pueden emplear siguiendo diferentes tipos de operativas en funció
X Trendline
X Trendline- индикатор для определения направления трендового движения
Индикатор X Trendline в своей основе имеет свою уникальную формулу для расчета направления движения цены. Данный индикатор подойдет как для новичка, так и для опытного трейдера. Индикатор можно использовать как отличный фильтр для своей торговой системы. Также можно определять место входа в позицию и выхода из нее. Для тех кто хочет использовать этот индикатор в своем советнике, есть три буфера из которых можно
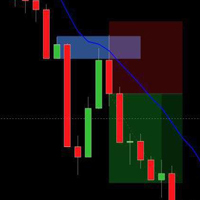
I spent two and a half months checking charts, looking for best variations for FTB trades and adjusting this indicator to get this final version. I think these are best rules to get as many FTB setups as you can. My aim was to make trading more comfortable as I cant imagine myself going through at least 36 tabs and search for FTRs and then again checking FTBs. FTB setup is pretty straight forward and easy to make indicator for so I said to myself why should I bother when I can have indicator to
Note : The slow loading of the indicator issue has been addressed . This new version loads fast and does not slow the platform. Version 1.3 : We have updated the indicator to include an historical bar scanning option . So instead of scanning all bars in the history (which can make the indicator slow sometimes ) , you can select the maximum number of bars it can scan which can increase the performance and make the indicator faster. This indicator scans the 1-3 Trendline pattern . The indicator i
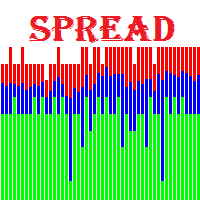
Spreads Monitoring MT4 - мощный инструмент для сбора значений спреда и записи их в файл. Позволяет "ловить" минимальные и максимальные значения спреда, рассчитывает реальное среднее значение спреда у брокера . Преимущества индикатора: Работает на всех таймфреймах; Восстанавливает ранее записанные данные для отображения на графике; Умеет запускать себя на графиках других символов по шаблону текущего графика; Имеет инструменты для удобной работы с данными; Не нагружает терминал. Параметры индикато
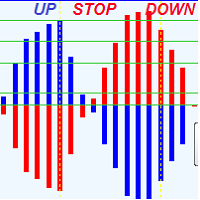
This indicator that shows precise price direction ,and force of this direction, reversals ,added it to any chart and you supress any confusion .
It calculs force of current direction and Predicts price reversals with high degree of accuracy withs its key levels and it is great for scalping , Or swing trading . For any time frame the following behavor is the same : Blue Histogram above 0.0 means that a buyers dominates price movement In other side , Red Histogram Above 0.0 means sellers d

The indicator of stop hunting shows the level zone of Day marketing. Zones are displayed as background rectangles. The length of the rectangle corresponds to the duration of the active trading, and the height to the trading range. For the current trading day, there is still the opportunity to show the extreme prices of each zone. The following parameters can be configured in the indicator: NumberOfDays = 200 - The number of days displayed.
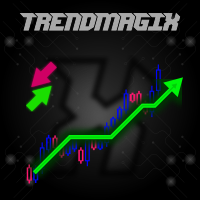
Unique trend trading algorithm with advanced filtering and many features which should become a part of your trading arsenal. This indicator can give you also trading advisors (with take profit target), success rate scanner and much more.
Important information
For additional detailed information you can visit the 747Developments website.
Features Easy to use (just drag and drop to the chart) Possible to use with any trading instrument Possible to use on any time-frame Take profit advisors Succ
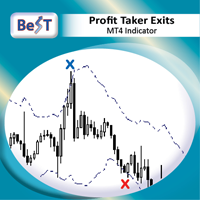
BeST_Profit Taker Exits is a Metatrader Indicator based on the corresponding vital part of Jim Berg's Trading System.It timely locates the most likely points/bars of significant Profit Taking and can be easily used as an add-on to any Trading System/Method . The Indicator consists of 2 Take Profit lines deriving as (MA ± times the ATR) usually the upper one above the prices (for Long Trades) and the lower one below prices (for Short Trades). When the Close (or High by choice) of a bar is above

Eurosmart Pro is a smart indicator of detecting trends, contains two intelligences. first is intelligence detects trends, and filter on the indicator can function to eliminate false signals. This indicator allows you to open trading easily and accurately. all indicator features are easy to use and easy to understand. Trading Rule: Pair : EURUSD, EURJPY Trading Sesion : London and New York Sesion Time Frame : M30/H1 Stop Trading : Sideway Market and High news impact (NFP, ECB) Open BUY : Ca
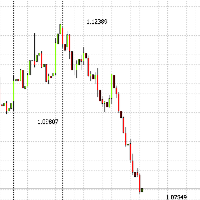
ЗигЗаг с подписью последних трех экстремумов, 1го, 2го и 3го, сам индикатор зигзага следует добавлять на график дополнительно, если это необходимо, так как можно обойтись и без него. Работает на всех инструментах, и таймфреймах, особенно полезен на больших ТФ чтобы сразу видеть 3 последние цены, и не загромождать график излишними индикаторами и линиями. Можно менять - Цвет, Размер шрифта, и Расположение относительно прикрепления цены графика Для того чтобы посл
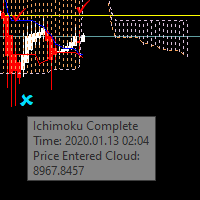
Have you ever tried to trade with the Ichimoku indicator only to wonder whether to stay in or close the trade? You will now know precisely what price is doing so you can choose your strategy. There are many different ways to trade Ichimoku and I'm confident you will find your strategies much easier to implement with the Ichimoku Complete. A bonus is that the parameters are fully adjustable for those trainers who ask you to change the values of the indicator. In this way you can use one strat

На рисунке ниже показан принцип работы индикатора. Это поиск паттерна Price Action.
Свечная модель состоит из двух показателей доминирования быков или медведей. В построении сигнала также участвуют тиковые объемы и объемная дельта.
Индикатор ищет возможные развороты на участке, длина которого задается в параметрах Calculation High/Low
По умолчанию параметр задан, как 50 баров.
Входные параметры Calculation High/low - определение high/low по количеству баров
Этот индикатор показывает последние 4 экстремума зигзага, обозначая их как 0 , A , B , C с подписью цены. Работает на любом торговом инструменте. Можно изменить размер, цвет текста, расположение текста относительно пиковых цен, вы также можете изменить сами параметры зигзага. Сам ZIgZag для рисования линий должен быть дополнительно подключен к графику. Для того чтобы последнее значение всегда отображало последний макс/мин зигзага, поставьте ShiftBars=0 Добавлена функция отрисовки 4 наклонных к
WOLFE WAVE PATTERNs First discovered by Bille Wolfe . The wolfe wave is a 5 wave price action pattern that is formed by supply and demand in a market and the fight to reach equilibrium in the market . The entry spot of the pattern is defined by the breakout of the trend created by wave 1 and wave 3 . This pattern forms in any market where there is supply and demand thus it can also be used to trade commodities and stocks. Wolfe Waves are reversal patterns that usually carry a low risk margin. P

Ska ZigZag BuySell indicator determines the overbought and oversold regions within a trend. The indicator determines the overbought region by the candlestick high and the oversold region by the candlestick low. This indicator only gives signals with arrow and audible alerts each and every time when a new candlestick appear. To utilize the full strategy i recommend using "Ska ZigZag BuySell" together with "Ska ZigZag Line". The Ska ZigZag Line indicator is available for free. NOTE: Indicator is h
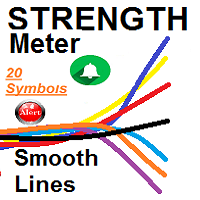
SMOOTH STRENGTH METER INDICATOR (SMOOTH LINE) it draws Currencies TREND Volatility Power / Strength lines : - Detects the 2 highly TRENDED Volatile pairs ( will be the Bold Lines ) - A very Helpful Indicator - It draws smooth lines for up to 20 currencies pairs representing Volatility strength and power - First it indicates the most powerful trended direction pairs : Strongest / Weaker - MAIN FUNCTION :it gives indication of the UP trend most Volatile Line and the DOWN
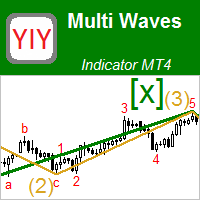
Этот индикатор отображает волновую структуру рынка в виде нескольких волновых уровней, вложенных друг в друга. Для каждого из этих уровней создается автоматическая предварительная (черновая) разметка волн в стиле Эллиотта (123..., ABC ... и т.д.). Эта разметка является полностью автоматической и абсолютно однозначной. Индикатор особенно полезен для начинающих волновых аналитиков, поскольку среди всех возможных вариантов волновой разметки позволяет сразу взять за основу наиболее адекв
In finance , volatility (symbol σ) is the degree of variation of a trading price series over time as measured by the standard deviation of logarithmic returns . Historic volatility measures a time series of past market prices. Implied volatility looks forward in time, being derived from the market price of a market-traded derivative (in particular, an option). In 2000 Yang-Zhang created a volatility measure that handles both opening jumps and drift. It is the sum of the overnight volatilit

Еще одна версия ЗигЗаг с дополнительными фильтрами для отрисовки и нахождения вершин и низин. Хорошо подходит для ручной торговли, так же можно эти вершины и низины использовать для советника и расчета по ним. Так же остались все функции оригинального ЗигЗаг. Дополнительными фильтрами являются AO и Стохастик. Работает на всех инструментах, и таймфреймах.
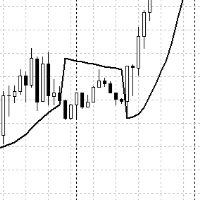
Обычный индикатор Parabolic_Sar, но отображается на графике не точками, а линией, за счет этого есть разность в сигналах, что может сказаться как в лучшую так и в худшую сторону, в любом случае, чем больше фильтров, тем четче вырисовывается картина рынка. Так же в данном индикаторе предусмотрен звуковой сигнал при изменении изгиба параболика и возникновении Сар свечи.

This indicator is produced from the value of two different moving averages calculated with a special formula and the moving average of this value. * This is not just an crossover of two moving averages. You can use this indicator on all time frames, but it is useful for M5 time frame with default parameters. Silver colored line shows the trend; if it is crossing up to zero line trend probably starting at the up direction. You can use crossover silver and red lines to the opposite direction of

FxF is an indicator and shows the possible direction of the trend in the selected time period. If "Lime" line is greater than zero trend is uptrend and "Red" line lower than zero the trend is downtrend in the selected timeframe. You can change bar period and price type on the control panel easily. It can be used for all currencies and time frames. Default settings are: BarPeriod=30, PriceType=MedianPrice.

Осциллятор основан на сходимости данных между объемом и ликвидностью. Рекомендуется использовать его в паре с большим объемом и ликвидностью обмена, например, EURUSD. Предпочтительно в TF 4H или выше. Как использовать:
Когда линии сходятся и пересекаются в OVERPURCHASE, рекомендуется продавать. Когда линии сходятся и пересекаются в SURVEY, рекомендуется покупать.
Любые вопросы, не стесняйтесь обращаться ко мне через чат для вопросов. Если вы считаете, что это подделка, или вы чувствуете, что
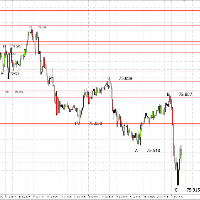
ZZFLET рисует на графике флет, по 10 мин/макс. зигзага после 3 первых, можно менять цвет текста,цвет линий , размер шрифта, толщину линий ограничивающих сам флет. Индикатор подходит в основном как показатель флета на более мелкие ТФ, на более крупные будет как индикатор линий поддержки и сопротивления, отрисовка идет по обычному зигзагу, который при необходимости стоит дополнительно присоединить к графику.
This indicator shows you reversal levels for trade. You can also use it as an exit indicator for your regular trades. It is useful if you use this indicator on H4 charts. There is no input parameters. It is using price actions to generate reversal levels. test it with your regular trade systems and see the difference It can be use multi time frames and multi currencies.

Indicator that indicate where the best point of reverse market.This indicator is a reactive or lagging signal, because the strategy uses a formation of an odd number of bars being the middle bar the highest or lowest in the formation, and the indicator draws when the all bars in the fractal close. However, traders with a pre-existing directional bias will find this indicator extremely useful, picking up early entry points.This indicator is not a boiled-down signals indicator nor a complete tradi
А знаете ли вы, почему MetaTrader Market - лучшее место для продажи торговых стратегий и технических индикаторов? Разработчику у нас не нужно тратить время и силы на рекламу, защиту программ и расчеты с покупателями. Всё это уже сделано.

Вы упускаете торговые возможности:
- Бесплатные приложения для трейдинга
- 8 000+ сигналов для копирования
- Экономические новости для анализа финансовых рынков
Регистрация
Вход
Вы принимаете политику сайта и условия использования
Если у вас нет учетной записи, зарегистрируйтесь