NN8D Volume

4

NN8D Volume is one of the indicators included to NN8D trading system (Nikolsky's Nesting Doll).

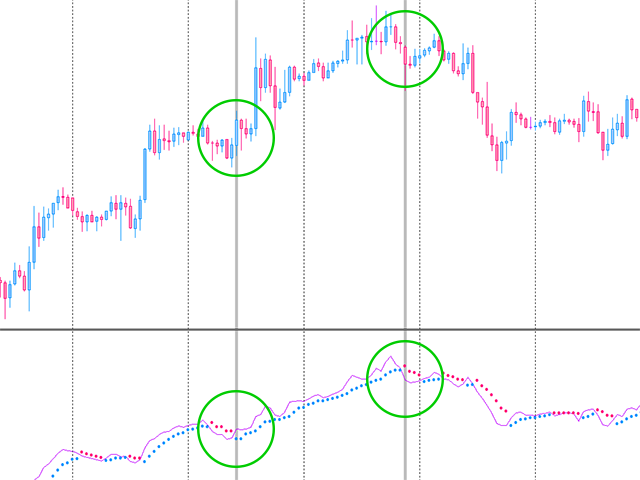
NN8D Volume displays a trend direction sorting out the market noise and keeping trades even during main trend corrections.

Buy checklist:

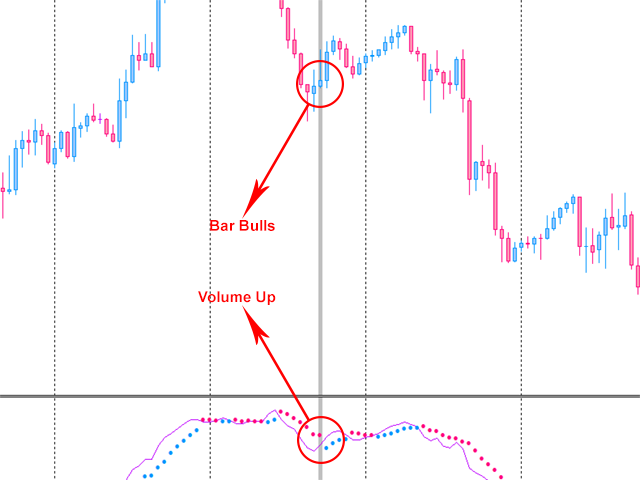
  1. Bulls on the current bar and preferably on the previous one.
  2. NN8D Volume line should go up moving away from Bulls points, showing a bullish trend and increase in volatility.
  3. Current bar - Buy (an open price is below a close one).
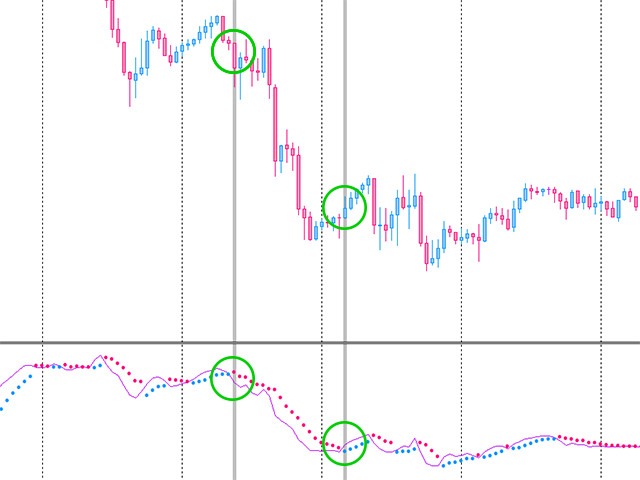
Sell checklist:

  1. Bears on the current bar and preferably on the previous one.
  2. NN8D Volume line should go down moving away from Bears, showing a bearish trend and increase in volatility.
  3. Current bar - Sell (an open price exceeds a close one).

When opening an order, it is advised to combine signals on the checklist from the current and older timeframes. It is recommended to combine signals from M5-H1 timeframes.

Close checklist:

A checklist signal from the current or lower timeframe is received.
It is recommended to close an order by a lower timeframe if the market is highly volatile and a candle on the current timeframe moves against an open order, while there is no an opposite signal on the current timeframe.

Comentários 1
Aravind Kolanupaka
10054
Aravind Kolanupaka 2018.06.17 20:33 
 

Good, but I do not see and added advantage of using this indicator when compared to other oscillators.

Produtos recomendados
Indicator (includes Volume Profile + Order Blocks) - a revolutionary indicator that combines two of the most powerful concepts of modern technical analysis: volume profiles and institutional players' order blocks. This tool allows you to see what is hidden from most traders and gives you a significant advantage in the market. Key benefits of the indicator: Visualization of "smart money": Clearly shows the areas of concentration of large players, highlighting areas with maximum volume in bright
The indicator allows you to trade binary options. The recommended time frame is М1 and the expiration time is 1,2,3 minutes. The indicator suitable for auto and manual trading. A possible signal is specified as a arrows above/under a candle. You should wait until the candle closes! Arrows are not re-painted Trade sessions: TOKYO section (Half-end) Currency pairs: USD/JPY Working time frame: M1 Expiration time: 1,2,3 minutes. The indicator also shows good results when using the martingale strateg
FREE
A technical indicator that displays information about the trading volume in the form of a histogram of distribution by price levels. It is used as an independent indicator that helps to evaluate the current objective situation of the instrument, as well as in the format of integration with other methods of analysis, to confirm or filter when making trading decisions. Key Features: Interactive profile update, real-time work Five modes of histogram calculation The possibility of separating the vol
Hurst Buy and Sell Mt4
Victor Alfonso Molina Botello
Hurst Buy and Sell  This innovative indicator, inspired by xAI Grok intelligence, uses the Hurst exponent to identify the nature of the market and generate buy/sell signals. The EA for this indicator (Hurst Razer PRO EA MT5) is now available, you can see it by clicking here!  https://www.mql5.com/es/market/product/153441?source=Site+Profile+Seller  If you want more signals from the indicator, change the minimum number of bars between consecutive signals. The lower the value, the more signals it
FREE
Rainbow MT4
Jamal El Alama
Rainbow MT4 is a technical indicator based on Moving average with period 34 and very easy to use. When price crosses above MA and MA changes color to green, it’s a signal to buy. When price crosses below MA and MA changes color to red, it’s a signal to sell. The Expert advisor ( Rainbow EA MT4) based on Rainbow MT4 indicator, as you can see in the short video below is now available here .
FREE
Simple Anchored VWAP is a lightweight yet powerful tool designed for traders who want precise volume-weighted levels without complexity. This indicator lets you anchor VWAP from any point on the chart and instantly see how price reacts around institutional volume zones. MT5 Version -  https://www.mql5.com/en/market/product/155321/ Join To Learn Market Depth -   https://www.mql5.com/en/channels/suvashishfx Using VWAP bands and dynamic levels, the tool helps you understand where real buying and s
FREE
Indicador Crypto_Forex "Histograma ReTest Pro" para MT4, sem repintura. - O indicador ReTestPro_Histogram pode ser usado para buscar sinais de entrada na direção da tendência principal após o reteste de um nível S/R forte. - O histograma ReTestPro pode ser apresentado em 2 cores: vermelho para tendência de baixa e verde para tendência de alta. - Ao visualizar colunas consecutivas e estáveis ​​do histograma com a mesma cor, significa que uma nova tendência está em andamento. - O sinal ReTest é
A nova versão torna este indicador uma ferramenta completa para estudo, análise e operação de padrões probabilísticos. Suas funções incluem: Monitor de porcentagem de múltiplos ativos no gráfico. Martingales configuráveis. Vinte e um padrões pré-configurados. Um editor de padrões avançado para armazenar até 5 padrões personalizados. Modo Backtest para testar resultados com relatório de perdas. Filtro de tendência. Filtro de hits. Opção de Ciclos de Martingale. Vários tipos de estratégias e alert
Market Profile 3
Hussien Abdeltwab Hussien Ryad
3 (2)
Market Profile 3 MetaTrader 4 indicator  — is a classic Market Profile implementation that can show the price density over time, outlining the most important price levels, value area, and control value of a given trading session. This indicator can be attached to timeframes between M1 and D1 and will show the Market Profile for daily, weekly, monthly, or even intraday sessions. Lower timeframes offer higher precision. Higher timeframes are recommended for better visibility. It is also possible t
FREE
Limitless MT4
Dmitriy Kashevich
O MT4 ilimitado é um indicador universal que se adequa a todos os comerciantes iniciantes e experientes. funciona em todos os pares de moedas, criptomoedas, ações em bruto MT4 ilimitado - já configurado e não requer configuração adicional E agora a principal coisa Por que o MT4 ilimitado? 1 falta completa de redesenho 2 dois anos de testes pelos melhores especialistas em negociação 3 a precisão dos sinais corretos excede 80% 4 teve bom desempenho nas negociações durante os comunicados d
Pips forex é um sistema de negociação pronto. Este indicador mostra com setas no gráfico quando e em que direção você precisa abrir um pedido. Se a seta estiver verde, abrimos uma transação de compra e, se a seta estiver vermelha, abrimos uma transação de venda. Tudo é muito simples e bastante eficaz. TakeProfit definiu 15-25 pontos. StopLoss definido no nível de pontos. Quando os pontos se movem, cancelamos imediatamente o StopLoss. Prazo recomendado para negociar M1 e M5. Esta é uma estratégi
Smart FVG Indicator MT4 – Detecção Avançada de Fair Value Gap para MetaTrader 4 O Smart FVG Indicator para MetaTrader 4 oferece detecção, monitorização e alertas profissionais de Fair Value Gap (FVG) diretamente nos seus gráficos. Ele combina filtragem baseada em ATR com lógica sensível à estrutura para remover ruído, adaptar‑se à liquidez e manter apenas os desequilíbrios mais relevantes para decisões precisas. Principais vantagens Deteção precisa de FVG: identifica ineficiências reais de pre
FREE
SX Supply Demand Zones accurately identifies and draws high-probability Supply and Demand zones using a sophisticated algorithm. Unlike traditional indicators that clutter your chart, this indicator is designed with a focus on performance and a clean user experience. New Unique Feature: Interactive Legend System What truly sets this indicator apart from everything else is the Interactive Control Legend. You have a professional dashboard directly on your chart that allows you to: Show/Hide: Ins
FREE
MR Volume POC Levels 4
Sergey Khramchenkov
5 (3)
The most important price level in any "Volume profile" is the "Point of Control" . This is the price level with the highest trading volume. It is primarily the level where large players initiate their positions, making it the accumulation/distribution level for the "Smart money" . The idea of the indicator arose after the "MR Volume Profile Rectangles 4" indicator was made. When creating the "MR Volume Profile Rectangles 4" indicator, we spent a lot of time comparing the volumes with those from
This indicator incorporates built-in volume statistics, identifying true liquidity zones based on real-time trading volume and comparing it to the volume of the last 500 candlesticks. Based on the identified results, liquidity zones are plotted on the chart, indicating potential price swings. We typically identify key liquidity zones that have not yet been breached in larger timeframes, then look for suitable entry opportunities in smaller timeframes. When the price touches a key liquidity zone
Deep Insight Candles is an indicator that brings an entirely new perspective to the price chart. It focuses on revealing hidden structures in market movements, uncovering buyer and seller pressure, thus helping traders to better identify key levels, dynamics, and potential reversals. The indicator conveys deeper market insights, allowing traders to make decisions based on a more accurate perception of market sentiment and pressure at specific price levels. This innovative approach transforms the
TMA AI Bands
Monique Ellen Miranda Dos Santos
O indicador TMA AI Bands é baseado na Média Móvel Triangular (TMA) com bandas superior e inferior dinâmicas e setas claras de compra/venda plotadas diretamente no gráfico. Ele possui IA integrada para otimização adaptativa e garante sem repintura, fornecendo sinais precisos de reversão quando o preço toca as bandas. * Pares: funciona com todos os pares de moedas * Timeframes recomendados: D1 / W1 / MN * Variáveis externas configuráveis:   * TimeFrame – período de cálculo   * HalfLength – s
Discover the power of precision and efficiency in your trading with the " Super Auto Fibonacci " MT4 indicator. This cutting-edge tool is meticulously designed to enhance your technical analysis, providing you with invaluable insights to make informed trading decisions. Key Features: Automated Fibonacci Analysis: Say goodbye to the hassle of manual Fibonacci retracement and extension drawing. "Super Auto Fibonacci" instantly identifies and plots Fibonacci levels on your MT4 chart, saving you tim
FREE
Flat Reminder Overview Flat Reminder is a powerful technical analysis tool that identifies and highlights price consolidation zones on your chart. It detects when price action slows down and moves sideways, indicating potential reversal points, continuation setups, or key decision zones in the market. Key Features Consolidation Detection : Automatically identifies flat price zones where market momentum decreases Range Measurement : Calculates and displays the exact range of each consolidation in
FREE
This is a ready-made strategy for binary options! Support/resistance levels are used to form a signal, while a number of built-in indicators are applied to sort out incoming signals. An arrow appears during a signal formation. If the signal is active, then the arrow remains after the close of the bar; if the signal is not strong enough, the arrow disappears. With a small number of signals and a small trading time, you will not need to sit all day at the computer, especially since you can enable
PVSRA method MT4
Volodymyr Hrybachov
Método de negociação PVSRA. O sistema é baseado no cálculo da direção das posições dos grandes players, nos quais eles ganham posições. PVSRA é uma abreviatura: P - Preço (Preço), V - Volume (Volume), S - Suporte (Suporte), R - Resistência (Resistência), A - Análise (Análise). O método PVSRA usa níveis de preços redondos (por exemplo, 1,2000) e níveis intermediários (por exemplo, 1,2250, 1,2750). Consolidação abaixo do nível de rodada é preparação para posições longas, consolidação acima do n
The indicator allows you to trade binary options. The recommended time frame is М1 and the expiration time is 1 minutes. The indicator suitable for auto and manual trading. A possible signal is specified as a arrows above/under a candle. You should wait until the candle closes! Arrows are not re-painted Trade sessions: London and New York section Currency pairs: AUD/CAD Working time frame: M1 Expiration time: 1 minute The indicator also shows good results when using the martingale strategy - "Ma
FREE
Binary Options Assistant (BOA) ICE Signals Indicator provides signals based on gkNextLevel Binary Options Strategy.  Indicators: 2 Bollinger Bands & Stochastic Stop missing trades, stop jumping from chart to chart looking for trade set-ups and get all the signals on 1 chart! U se any of the BOA Signals Indicator with the  Binary Options Assistant (BOA) Multi Currency Dashboard .   All BOA Signal Indicator settings are adjustable to give you more strategy combinations. The signals can be seen
FREE
No mundo acelerado dos mercados financeiros, cada segundo conta e cada decisão pode fazer ou quebrar uma negociação. Apresentando o Indicador Binary Hacker - uma ferramenta inovadora que está pronta para transformar a maneira como os traders analisam os movimentos de preços, um minuto de cada vez. Revelando a precisão na negociação: O Indicador Binary Hacker não é sua ferramenta de negociação comum. Ele funciona como um analisador em tempo real, dissecando cada minuto no gráfico para fornecer ao
Smart Reversal Signal  is a professional indicator for the MetaTrader 4 platform; it has been developed by a group of professional traders. This indicator is designed for Forex and binary options trading. By purchasing this indicator, you will receive: Excellent indicator signals. Free product support. Regular updates. Various notification options: alert, push, emails. You can use it on any financial instrument (Forex, CFD, options) and timeframe. Indicator Parameters Perod - indicator calculat
GTAS FibTdi
Riviera Systems
GTAS FidTdi is a trend indicator using combination of volatility and potential retracement levels. This indicator was created by Bernard Prats Desclaux, proprietary trader and ex-hedge fund manager, founder of E-Winvest. Description The indicator is represented as a red or green envelope above or under prices. How to use Trend detecting When the envelope is green, the trend is bullish. When it is red, the trend is bearish. Trading Once a trade is opened, GTAS FibTdi shows retracement zones wh
FREE
Rule Plotter MT4
Francisco Gomes Da Silva
4.25 (4)
Como Criar um Robô Automatizado de Negociação com Rule Plotter Você já se perguntou como seria poderoso se pudesse automatizar suas estratégias de negociação com apenas alguns clicks do mouse, Imagine ter a liberdade de criar e testar diferentes estratégias de negociação sem a necessidade de mergulhar em códigos complicados. Com o Rule Plotter, essa visão se torna realidade. Aqui vamos explorar como você pode criar seu próprio robô de negociação personalizado usando o Rule Plotter, uma ferrament
FREE
Binary FX Ideal
Yaroslav Varankin
5 (1)
great tool for any trader for both Forex and binary options suitable for any trader no need to configure anything, everything has been perfected by time and experience The tool combines 5 indicators and 3 proprietary strategies works great during flats and trends It indicates a trend reversal at its very beginning, it works well with the trend Trading Recommendations The signal is formulated on the current candle You should enter the trade at the next Possible recount (rare)
High Low Open Close MT4
Alexandre Borela
4.81 (21)
Se você gosta deste projeto, deixe uma revisão de 5 estrelas. Este indicador desenha os preços abertos, altos, baixos e finais para o especificado período e pode ser ajustado para um fuso horário específico. Estes são níveis importantes olhados por muitos institucional e profissional comerciantes e pode ser útil para você saber os lugares onde eles podem ser mais activa. Os períodos disponíveis são: Dia anterior. Semana anterior. Mês anterior. Quarto anterior. Ano anterior. Ou: Dia atual. Seman
FREE
Intraday Secret Levels Pro Intraday Secret Levels Pro é um indicador de nível profissional projetado para destacar níveis intradiários importantes de suporte e resistência , onde o preço reage naturalmente ao longo do dia de negociação. Em vez de gerar sinais de trade, esta ferramenta fornece um framework de leitura claro e estruturado , permitindo que os traders tomem decisões informadas com base no comportamento do preço, nas reações e na estrutura do mercado. O indicador foi desenvolvido para
Os compradores deste produto também adquirem
Indicador Miraculous – Ferramenta 100% Não Repintável para Forex e Opções Binárias Baseada no Quadrado de Nove de Gann Este vídeo apresenta o Indicador Miraculous , uma ferramenta de negociação altamente precisa e poderosa, desenvolvida especificamente para traders de Forex e Opções Binárias . O que torna este indicador único é a sua base no lendário Quadrado de Nove de Gann e na Lei da Vibração de Gann , tornando-o uma das ferramentas de previsão mais precisas disponíveis na negociação moderna.
Precautions for subscribing to indicator This indicator only supports the computer version of MT4 Does not support MT5, mobile phones, tablets The indicator only shows the day's entry arrow The previous history arrow will not be displayed (Live broadcast is for demonstration) The indicator is a trading aid Is not a EA automatic trading No copy trading function The indicator only indicates the entry position No exit (target profit)  The entry stop loss point is set at 30-50 PIPS Or the front hi
Pulse Scalping Line - an indicator for identifying potential pivot points. Based on this indicator, you can build an effective Martingale system. According to our statistics, the indicator gives a maximum of 4 erroneous pivot points in a series. On average, these are 2 pivot points. That is, the indicator shows a reversal, it is erroneous. This means that the second signal of the indicator will be highly accurate. Based on this information, you can build a trading system based on the Martingale
The Hurricane Indicator
Paul Nicholas Clevett
5 (1)
Currently switched to the 4 hour chart - but use other time frames for confirmation. :-)  I change my main time frame based on the market movement at the time. The Hurricane Forex Indicator is a multi time frame indicator that includes such things as Trade Notifications, Trade Calculator, Momentum Indicator, risk reward and much more. We have a free Trade room for our users as well. Please check out the video for full details of how this indicator works as it has over 15 years worth of developme
El indicador "MR BEAST ALERTAS DE LIQUIDEZ" es una herramienta avanzada diseñada para proporcionar señales y alertas sobre la liquidez del mercado basándose en una serie de indicadores técnicos y análisis de tendencias. Ideal para traders que buscan oportunidades de trading en función de la dinámica de precios y los niveles de volatilidad, este indicador ofrece una visualización clara y detallada en la ventana del gráfico de MetaTrader. Características Principales: Canal ATR Adaptativo: Calcula
Rtc ML Ai Predictor MT4
Muhammad Faisal Sagala
Rtc ML Ai | Predictor CORE MACHINE LEARNING ENGINE Adaptive ML Market Predictor – Multi-Bar Trend & Candle Forecast What This Indicator Does This indicator is a  real-time market prediction engine  designed to analyze price behavior and estimate  future market tendencies . Unlike conventional indicators, this system  does not rely on static parameters or historical curve-fitting , but adapts its internal state dynamically during live market operation. Instead of using static rules, the indic
PairMaster Buy Sell Arrow Indicator for MT4 Trade Reversals Like a Pro — Catch Every Swing Point with Precision The PairMaster Buy Sell Arrow Indicator is a powerful MetaTrader 4 tool built to identify high-probability swing trading opportunities . Designed for traders who value accuracy, clarity, and simplicity, PairMaster detects key market turning points and plots intuitive buy and sell arrows directly on your chart. Key Features Accurate Swing Point Detection – Automatically identifies ma
Bomb Bank Signal
Igor Pereira Calil
5 (1)
Bomb Bank Signal: O Seu Indicador de Confiança no MetaTrader 4 O Bomb Bank Signal é um poderoso indicador para MetaTrader 4, projetado para identificar as tendências mais relevantes no mercado financeiro. Se você está buscando uma ferramenta que antecipe movimentos com precisão, o Bomb Bank é o aliado que você precisa. Como Funciona: Este indicador combina três métodos distintos – análise de volumes, fechamentos de vela e tendência simétrica – para detectar e sinalizar oportunidades de compra e
BinaryIndicator
Andrey Spiridonov
BinaryIndicator is a highly accurate indicator for trading binary options. It shows excellent results in scalping. This indicator is based in multifactor analysis of trend indicators, as well as confirmation oscillators, which in the end gives an increased accuracy of signals. Advantages of the indicator Increased accuracy of signals. Excellent results when trading binary options with a short expiration time from M30 to M1 . It works on any timeframes. Works with any trade symbols. Parameters
FFx Engulfing Setup Alerter gives trade suggestions with Entry, Target 1, Target 2 and StopLoss. Below are the different options available: Entry suggestion - pips to be added over the break for the entry 3 different options to calculate the SL - by pips, by ATR multiplier or at the pattern High/Low 3 different options to calculate the 2 TPs - by pips, by ATR multiplier or at Risk/Reward Offset the dashboard - any place on the chart Remove the suggestion once the price reached the SL line Lines
FFx InsideBar Setup Alerter gives trade suggestions with Entry, Target 1, Target 2 and StopLoss. Below are the different options available: Entry suggestion - pips to be added over the break for the entry Minimum candle size - to avoid too close buy/sell entry suggestions 3 different options to calculate the SL - by pips, by ATR multiplier or at the pattern High/Low 3 different options to calculate the 2 TPs - by pips, by ATR multiplier or at Risk/Reward Offset the dashboard - any place on the c
FFx OutsideBar Setup Alerter gives trade suggestions with Entry, Target 1, Target 2 and StopLoss. Below are the different options available: Entry suggestion - pips to be added over the break for the entry. 3 different options to calculate the SL - by pips, by ATR multiplier or at the pattern High/Low. 3 different options to calculate the 2 TPs - by pips, by ATR multiplier or at Risk/Reward. Offset the dashboard - any place on the chart. Remove the suggestion once the price reached the SL line.
FFx PinBar Setup Alerter gives trade suggestions with Entry, Target 1, Target 2 and StopLoss. Below are the different options available: Entry suggestion - pips to be added over the break for the entry Minimum candle size - to avoid too small candles 3 different options to calculate the SL - by pips, by ATR multiplier or at the pattern High/Low 3 different options to calculate the 2 TPs - by pips, by ATR multiplier or at Risk/Reward Offset the dashboard - any place on the chart Remove the sugges
Automatic, live & interactive picture of all trendlines. Assign push, email and sound alerts to the lines of your choice and be informed about price rollback, breakout, rollback after breakout, number of rollbacks, line expiration by double breakout. Correct, drag or delete the lines and interactively tune the line system. https://youtu.be/EJUo9pYiHFA . Chart examples https: //www.mql5.com/en/users/efficientforex Price Interaction Events All events are effective immediately and only after one
The purpose of this new version of the MT4 standard indicator provided in your platform is to display in a sub-window multiple timeframes of the same indicator with its divergences. See the example shown in the picture below. But the display isn't like a simple MTF indicator. This is the real display of the indicator on its timeframe. Here's the options available in the FFx divergences indicator: Select the timeframes to be displayed (M1 to Monthly) Define the width (number of bars) for each tim
The purpose of this new version of the MT4 standard indicator provided in your platform is to display in a sub-window multiple timeframes of the same indicator with its divergences. See the example shown in the picture below. But the display isn't like a simple MTF indicator. This is the real display of the indicator on its timeframe. Here's the options available in the FFx divergences indicator: Select the timeframes to be displayed (M1 to Monthly). Define the width (number of bars) for each ti
The FFx Dashboard MTF alerter will show you on a single chart all the timeframes (M1 to Monthly) with their own status for the indicator. 2 Alert Options: Single timeframe: each selected timeframe alert separately when a signal occurs Multi timeframes: all selected timeframes must agree for an alert to be triggered Both options have an input to select the timeframes to be used for the alert(s). How to Understand the Status: Green/Red square: histogram above/below 0 line Green square + Red bord
The FFx Dashboard MTF alerter will show you on a single chart all the timeframes (M1 to Monthly) with their own status for the indicator. 2 Alert Options: Single timeframe: each selected timeframe alert separately when a signal occurs Multi timeframes: all selected timeframes must agree for an alert to be triggered Both options have an input to select the timeframes to be used for the alert(s). How to understand the status: Green/Red square: RSI above/below 50 line Green square + Red border: R
The FFx Dashboard MTF alerter will show you on a single chart all the timeframes (M1 to Monthly) with their own status for the indicator. 2 Alert Options: Single timeframe: each selected timeframe alert separately when a signal occurs Multi timeframes: all selected timeframes must agree for an alert to be triggered Both options have an input to select the timeframes to be used for the alert(s). How to understand the status: Green/Red square: Stoch above/below 50 line Green square + Red border:
The FFx Dashboard MTF alerter will show you on a single chart all the timeframes (M1 to Monthly) with their own status for the indicator. 2 Alert Options: Single timeframe: each selected timeframe alert separately when a signal occurs Multi timeframes: all selected timeframes must agree for an alert to be triggered Both options have an input to select the timeframes to be used for the alert(s). How to understand the status: Green/Red square: Price above/below Cloud (Kumo) Green square + Red bo
The FFx Dashboard MTF alerter will show you on a single chart all the timeframes (M1 to Monthly) with their own status for the indicator. 2 Alert Options: Single timeframe: each selected timeframe alert separately when a signal occurs Multi timeframes: all selected timeframes must agree for an alert to be triggered Both options have an input to select the timeframes to be used for the alert(s). How to understand the status: Green/Red square: MA pointing Up/Down Green square + Red border: MA po
The FFx Dashboard MTF alerter will show you on a single chart all the timeframes (M1 to Monthly) with their own status for the indicator. 2 Alert Options: Single timeframe: each selected timeframe alert separately when a signal occurs. Multi timeframes: all selected timeframes must agree for an alert to be triggered. Both options have an input to select the timeframes to be used for the alert(s). How to understand the status: Green square: Price above PSAR Red square: Price below PSAR Options
The FFx Dashboard MTF alerter will show you on a single chart all the timeframes (M1 to Monthly) with their own status for the indicator. 2 Alert Options: Single timeframe: each selected timeframe alert separately when a signal occurs Multi timeframes: all selected timeframes must agree for an alert to be triggered Both options have an input to select the timeframes to be used for the alert(s). How to understand the status: Green/Red square: CCI above/below levels (ie. 100/-100) Grey square: C
The FFx Dashboard MTF alerter will show you on a single chart all the timeframes (M1 to Monthly) with their own status for the indicator. 2 Alert Options: Single timeframe: each selected timeframe alert separately when a signal occurs Multi timeframes: all selected timeframes must agree for an alert to be triggered Both options have an input to select the timeframes to be used for the alert(s). How to understand the status: Green/Red square: ADX above level Grey square: ADX below level Red bor
The FFx Dashboard MTF alerter will show you on a single chart all the timeframes (M1 to Monthly) with their own status. 2 Alert Options: Single timeframe: each selected timeframe alert separately when a signal occurs Multi timeframes: all selected timeframes must agree for an alert to be triggered Both options have an input to select the timeframes to be used for the alert(s). How to understand the status: Green/Red square: bullish/bearish candle Options available in the FFx Dashboard Alerter
The [GRAFF] III manual trading system is based on multiple MetaTrader (MT4) indicators. Together, the entire PACK of GRAFF III indicators makes an advanced trading tool. The system consists of over 20 different custom-built indicators which have been carefully selected and tested in the long term to produce strong and efficient trading signals. The particular indicators are based on different mathematical formulas, so the entire system is calibrated to remove false signals from its own indicator
FFx Universal Strength Meter PRO is more than a basic strength meter. Instead of limiting the calculation to price, it can be based on any of the 19 integrated strength modes + 9 timeframes. With the FFx USM, you are able to define any period for any combination of timeframes. For example, you can set the dashboard for the last 10 candles for M15-H1-H4… Full flexibility! Very easy to interpret... It gives a great idea about which currency is weak and which is strong, so you can find the best pai
Mais do autor
NN8D Points
Aleksandr Nikolskii
NN8D Points is one of the indicators included into NN8D ( N ikolsky's N esting D oll) trading system. NN8D Points is an indicator containing multiple tools for analyzing Forex market: candle analysis and area system. Rather than simply averaging by Open, Close, High and Low prices, NN8D Points performs a complex analysis of the current and previous bars by various parameters: bar color; bar body size; bar wicks; bar core (average value between Open and Close, as well as between Lows and Highs);
Filtro:
Aravind Kolanupaka
10054
Aravind Kolanupaka 2018.06.17 20:33 
 

Good, but I do not see and added advantage of using this indicator when compared to other oscillators.

Responder ao comentário