Alpha Swing Levels
- Indicadores
- Versão: 1.11
- Ativações: 5

Alpha Swing Levels draws the swing highs and lows that price has not broken yet, and marks the bar that breaks one. A level appears only after the swing is confirmed and never moves afterwards, so what you see in history is exactly what you would have seen live. No repaint, no redraw.
Most support and resistance tools draw dozens of lines. Alpha Swing Levels does one job: it shows the nearest swing high and swing low that the market has NOT yet traded through, and tells you the moment one breaks.
WHAT YOU SEE ON THE CHART
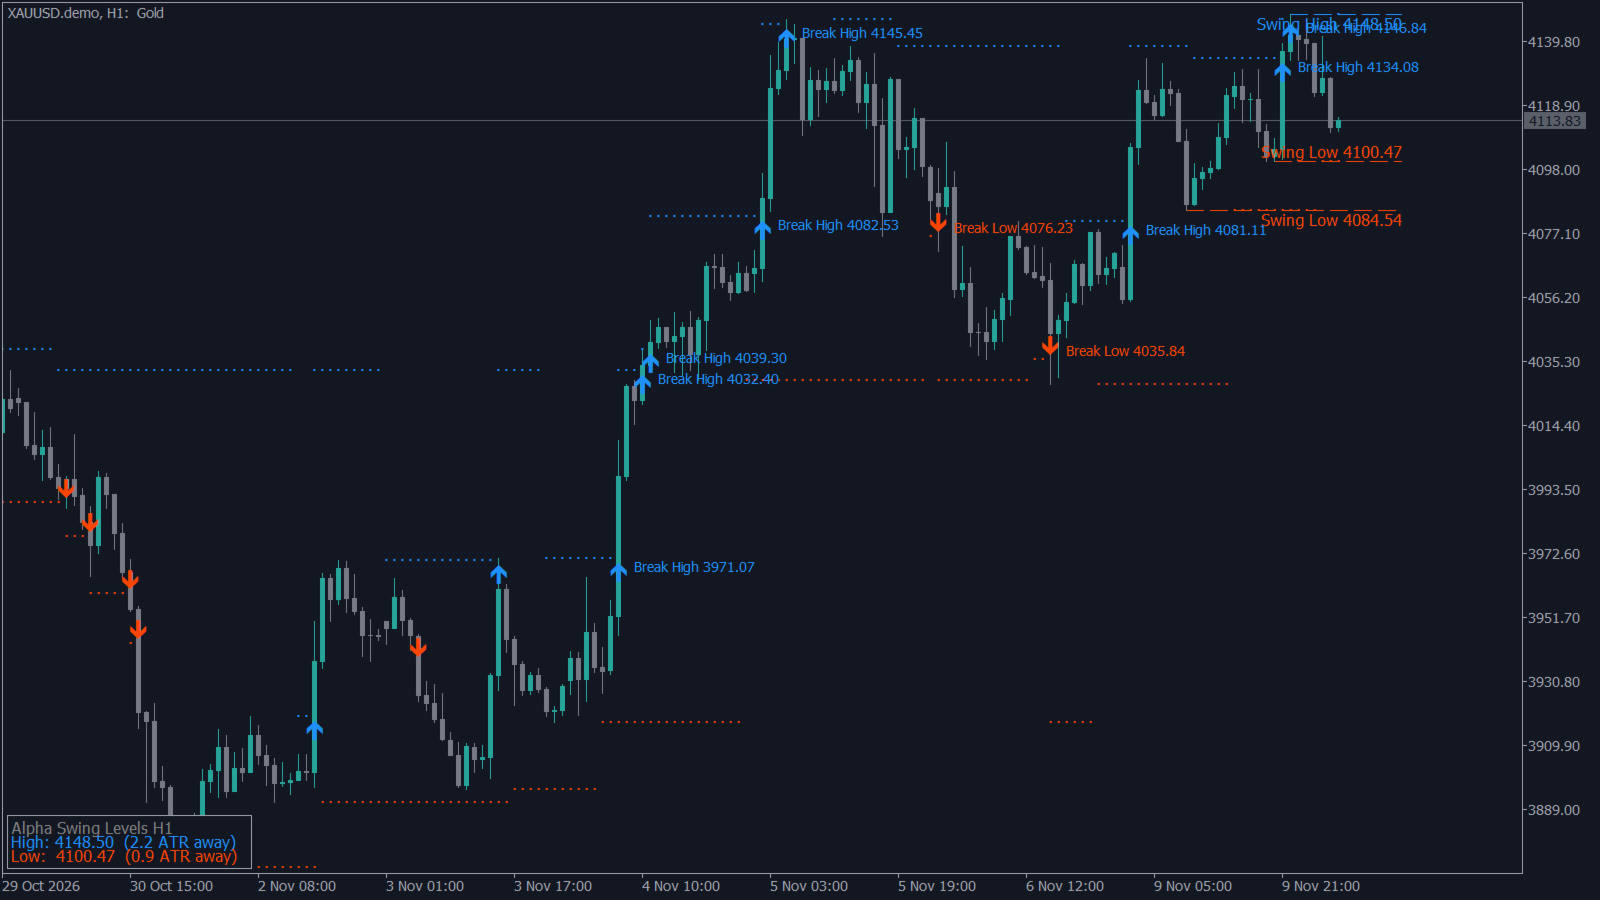
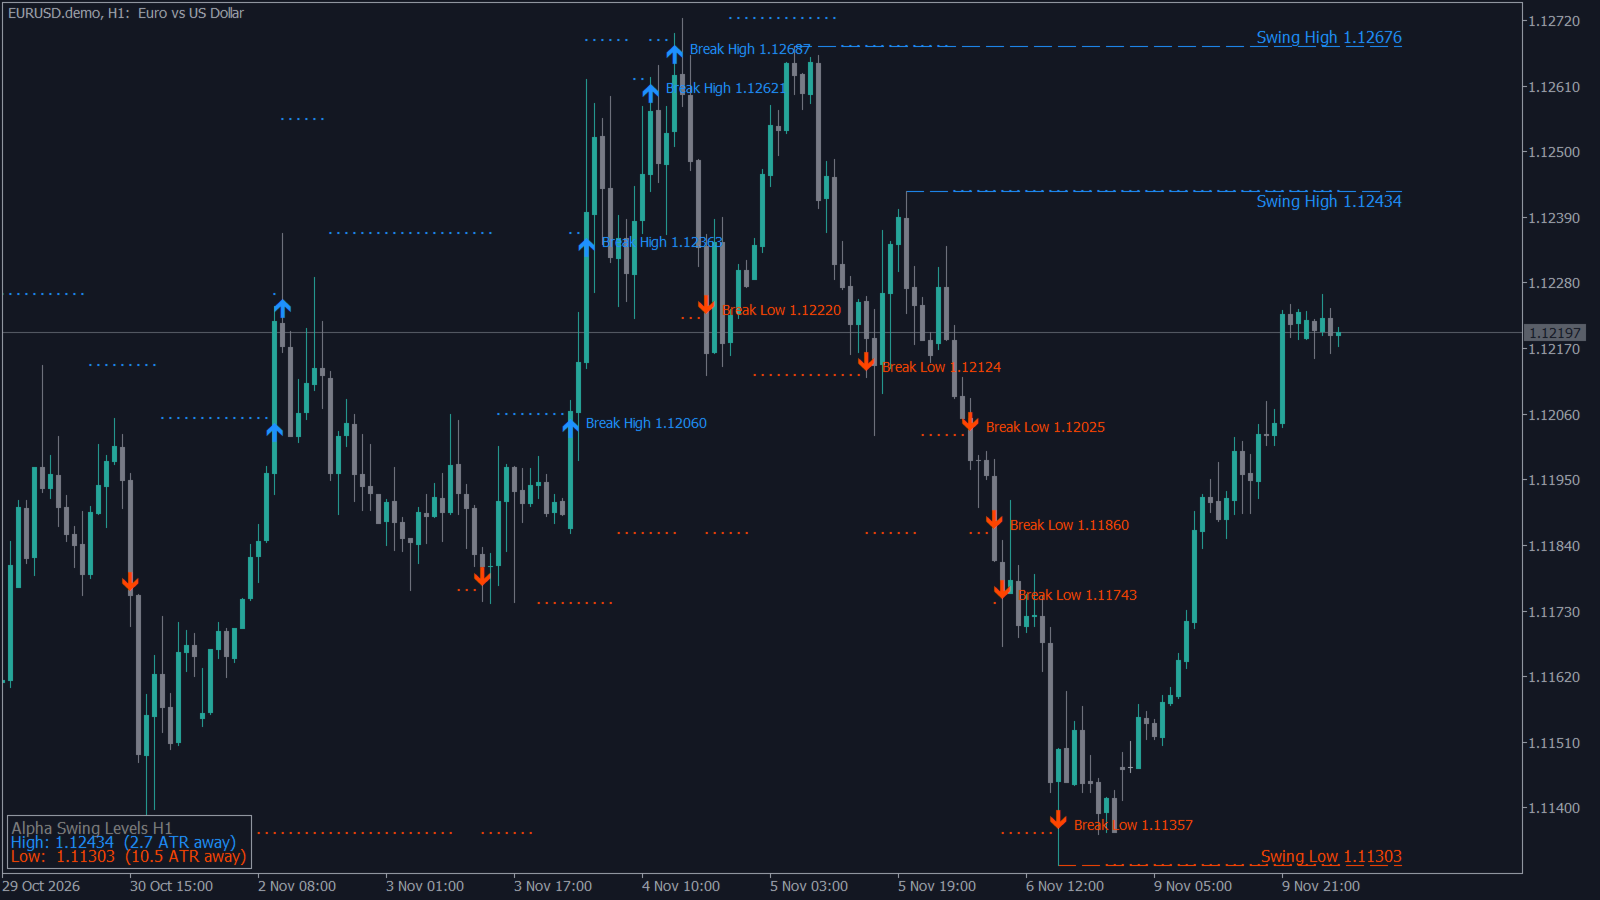
- Dotted line: the nearest unbroken swing high (blue) and swing low (red), bar by bar through history
- Arrow with a label, e.g. "Break High 4032.40": the bar that traded through a level
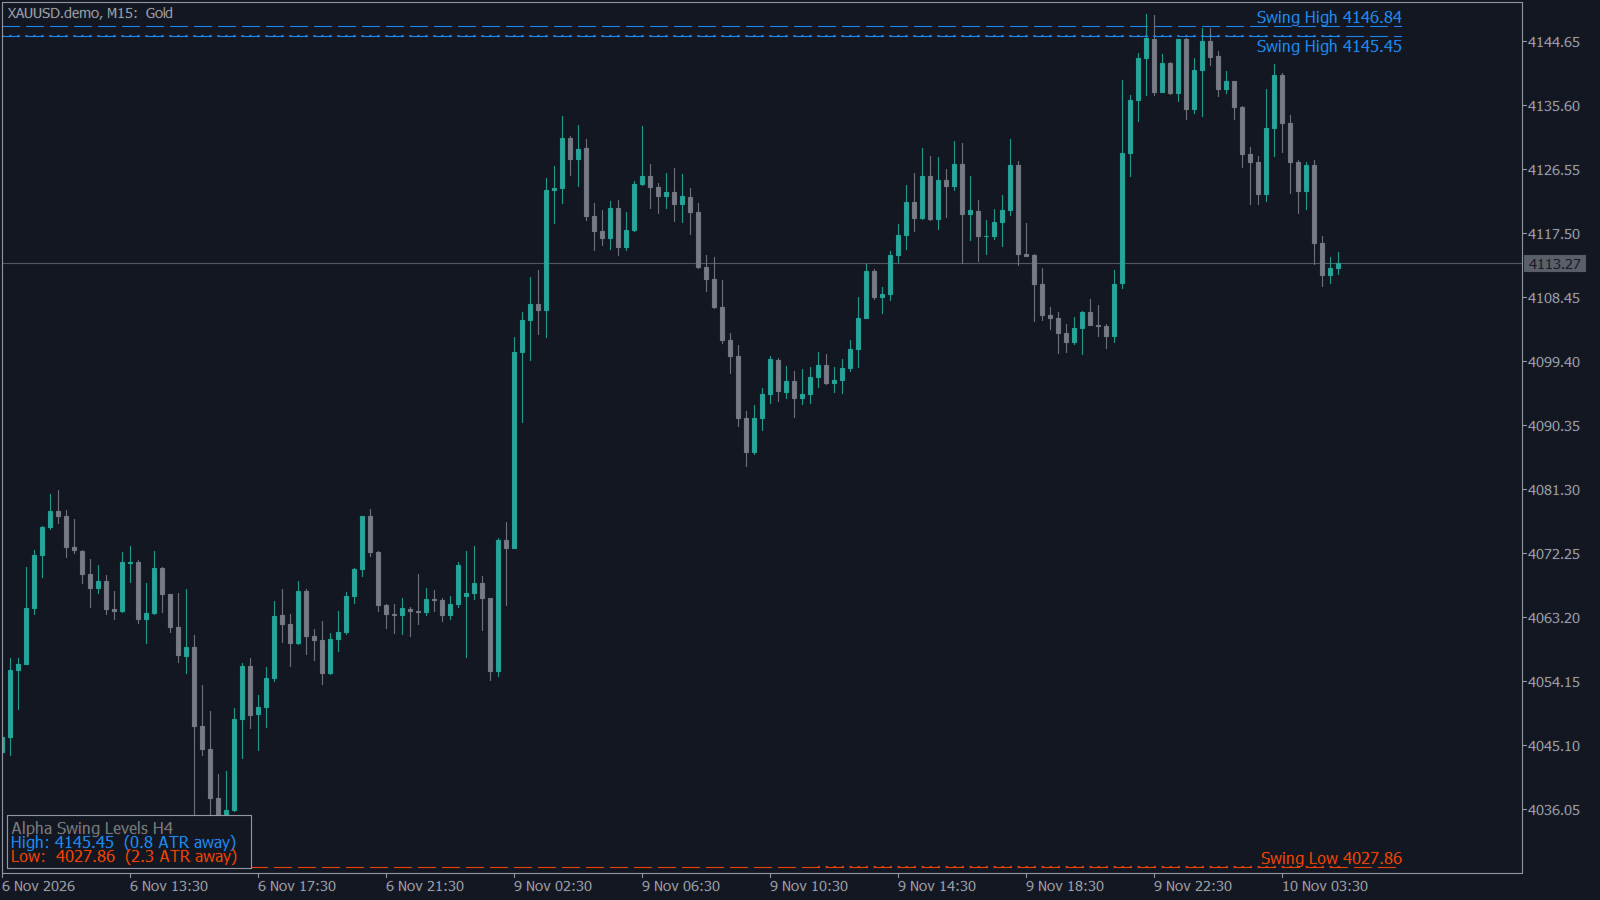
- Dashed lines labelled "Swing High" / "Swing Low": the current unbroken levels
- Status box: distance from price to the nearest levels, measured in ATR
HOW A LEVEL IS MADE
1. A swing high is a bar whose high is above the N bars on each side (N = Swing strength).
2. It is drawn only when the N bars on the right have closed. Before that, nothing is shown.
3. It stays until price trades through it. An exact touch (double top) does not break it.
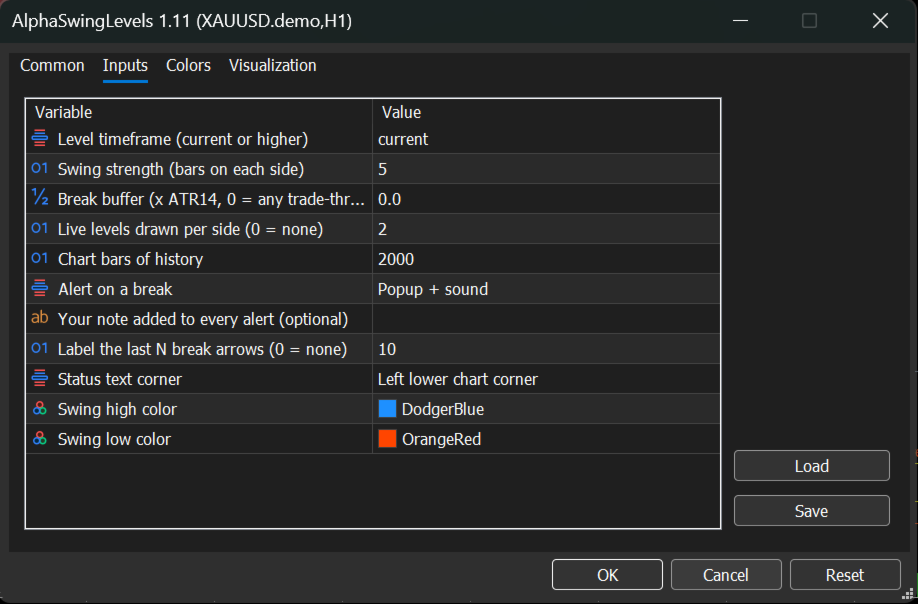
SETTINGS
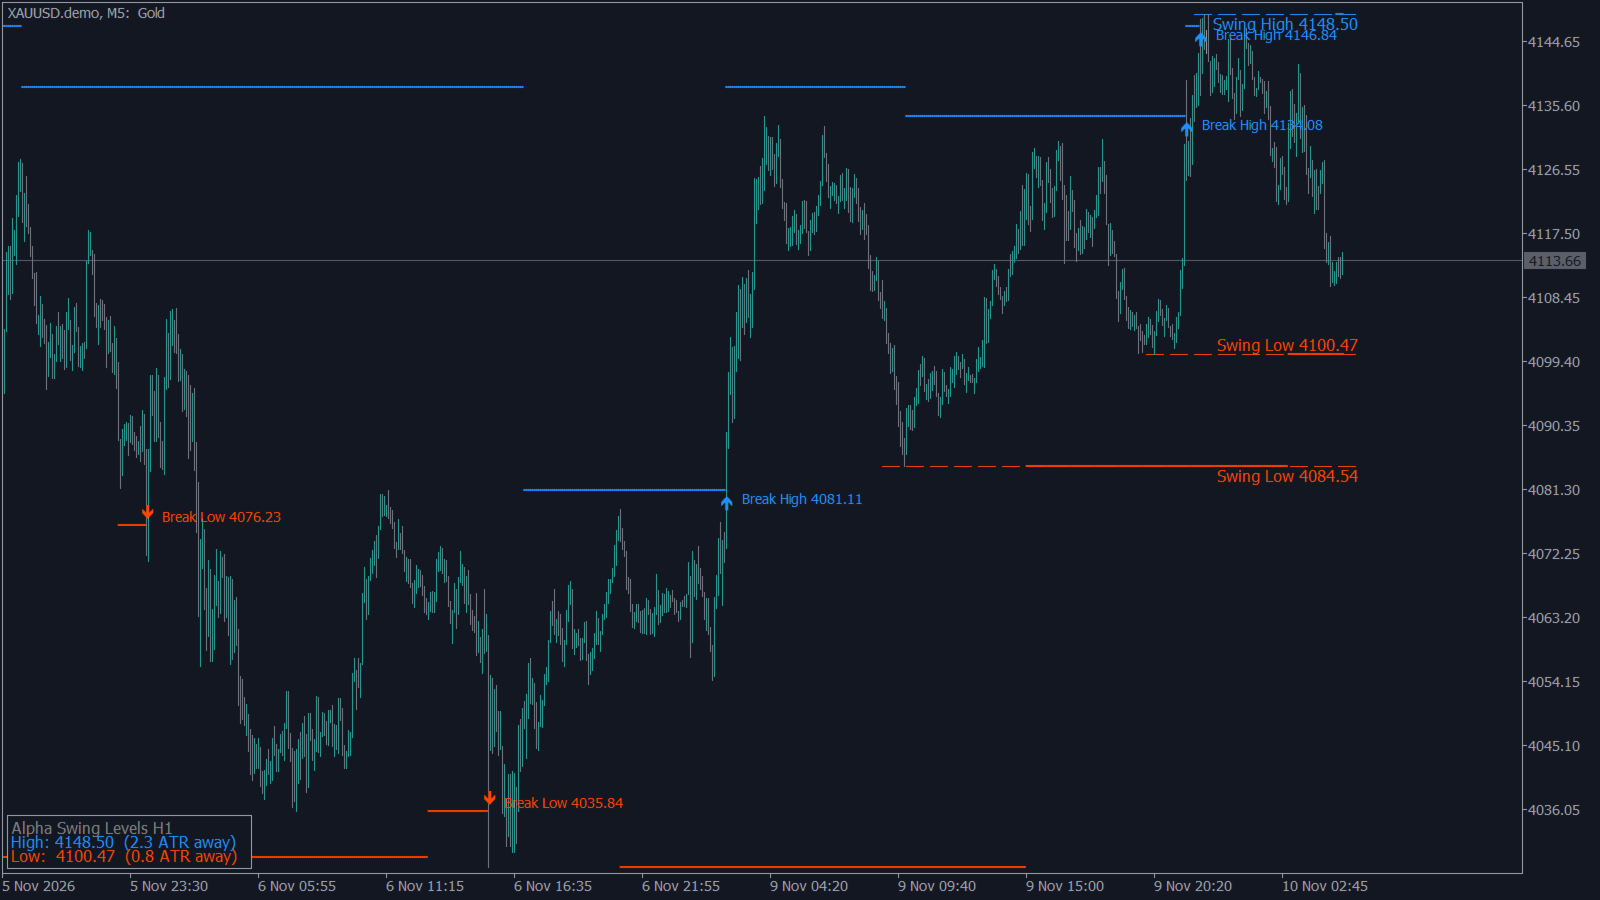
- Level timeframe: the chart timeframe or a higher one (e.g. H1 levels on an M5 chart)
- Swing strength: bars on each side; higher = fewer, stronger levels
- Break buffer (x ATR): price must go this fraction of ATR beyond the level to count as a break
- Live levels per side: how many current levels to draw
- History bars: how far back to draw
- Alerts: off, popup, popup + push to phone, or popup + push + email
Message example: "XAUUSD M5: broke above swing HIGH 4032.40 (H1 level)"
- Alert note: your own text added to every alert
- Arrow labels: label the newest N break arrows (0 = none)
- Status corner: where the status box sits (default bottom left, clear of the one-click panel)
- Colors for highs and lows
HOW TRADERS USE IT
- Stop placement: beyond the nearest unbroken swing low (for a buy) or swing high (for a sell)
- Trailing: move the stop to each new swing level as the trend continues
- Context: how far price is from the nearest support and resistance, in ATR
- Small charts: keep an M1-M15 chart but set Level timeframe = H1, so you only see H1 levels and alerts
WHICH TIMEFRAME
We measured what price did after every break on 2018-2026 data (strength 5, after spread). On H1 and H4 levels, breaks on gold, Bitcoin and USDJPY continued slightly in the break direction on average. On M15 levels there was no follow-through on any of them, and on EURUSD breaks usually came back. So read breaks on H1 or H4 levels.
HONEST NOTE
This is a level tool, not a buy/sell signal system. In our tests, entering on every break arrow was not better than random entries with the same stop and exit. Use the levels for structure, stops and trailing, and take entries from your own method.
FOR EA DEVELOPERS
Four buffers through iCustom: 0 nearest swing high, 1 nearest swing low, 2 break-up arrow (level price), 3 break-down arrow. EMPTY_VALUE when nothing is on that bar. Values on closed bars never change.
Works on any symbol (forex, metals, indices, crypto, stocks) and any timeframe.