Synthetic Data Audit
- Indicadores
- Versão: 1.0
- Ativações: 5

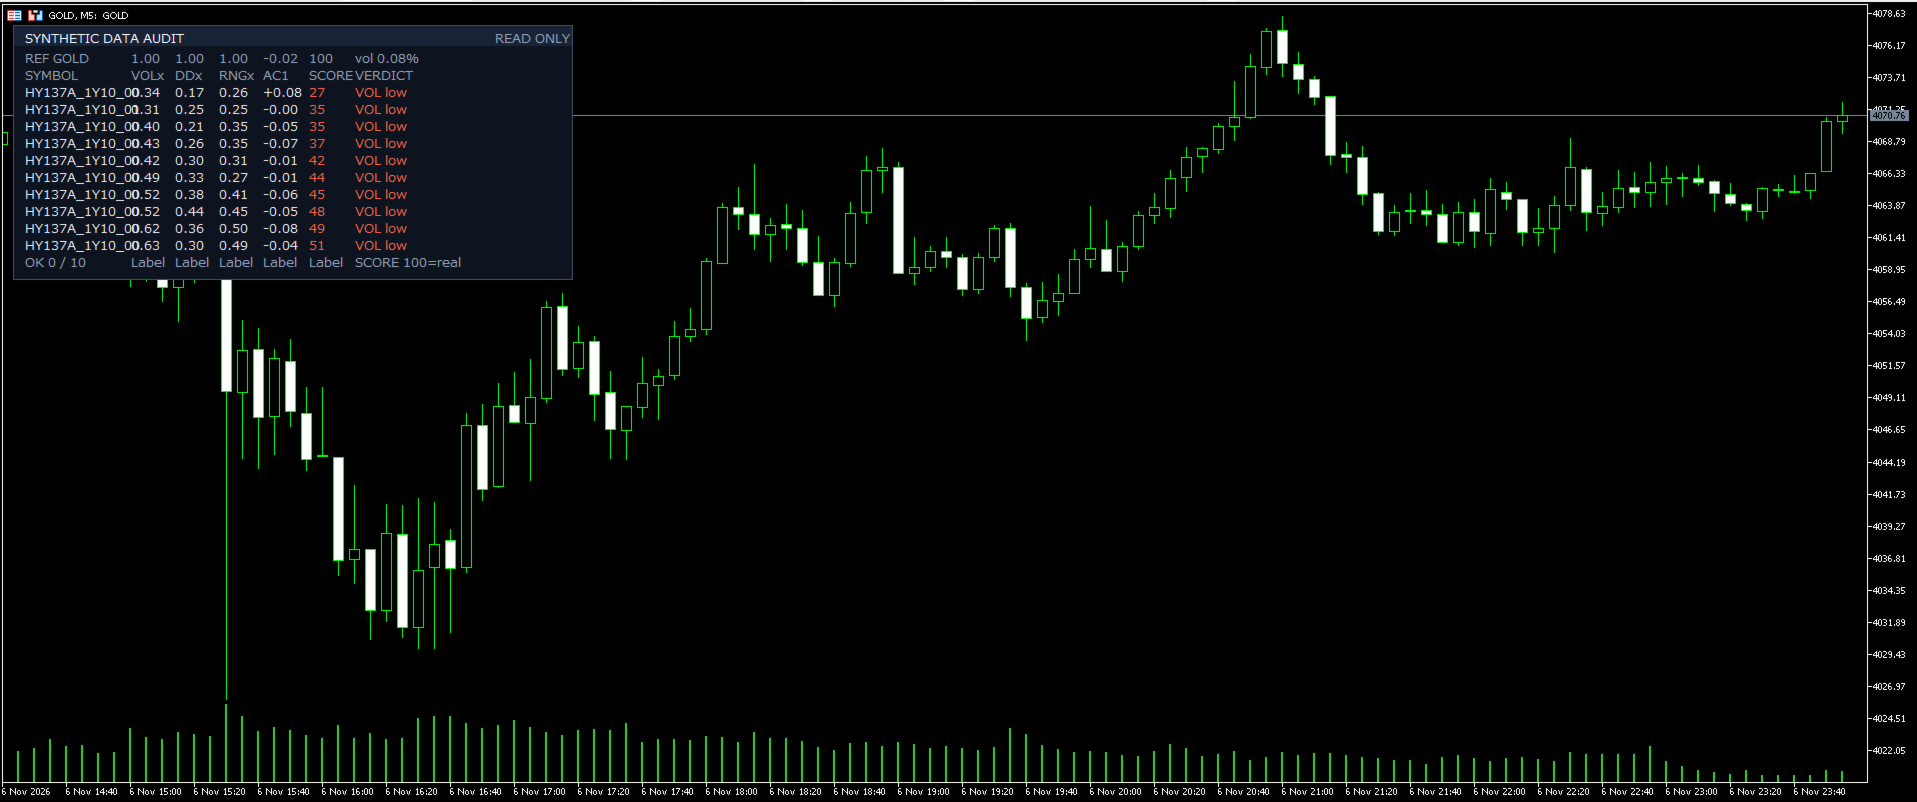
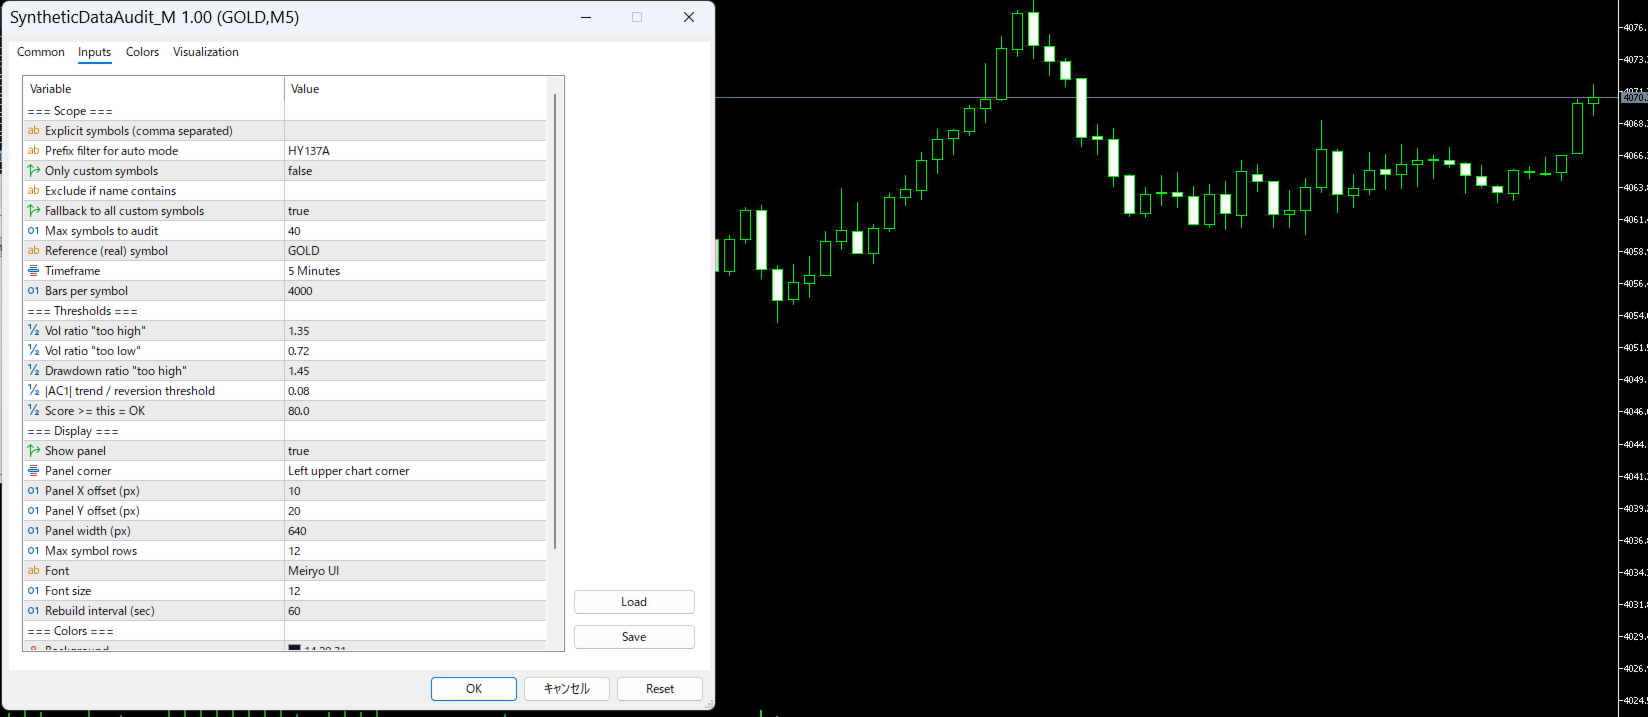
Synthetic Data Audit is a quality check for generated or hand-built symbols. If you create custom symbols, or you backtest on synthetic data, a bad generator produces a chart that looks like a market and statistics that mean nothing. This panel tells you which symbols are plausible and which are not. It does not trade and it does not modify symbols. It reads bars and scores them. WHAT IT SHOWS The reference row (REF) shows the real symbol you compare against. Every other row is one audited symbol: - VOLx: volatility ratio versus the reference (1.00 = same) - DDx: drawdown ratio versus the reference - RNGx: average bar range ratio versus the reference - AC1: first-order autocorrelation of returns. Near zero means little memory; a strongly positive value suggests trending artefacts, a strongly negative value suggests artificial mean reversion. - SCORE: 0 to 100. 100 means statistically indistinguishable from the reference. - VERDICT: the plain-language result for that symbol. The footer shows how many symbols passed (OK n / m) and the legend SCORE 100 = real. WHY IT IS USEFUL A synthetic series that is too smooth, too volatile, or too mean-reverting will pass a visual check and fail in live conditions. Ratios against a real reference plus autocorrelation catch exactly those three failures, and a score makes a list of 40 symbols readable in one glance. INPUTS Symbols - Explicit symbols (comma separated) - Prefix filter for auto mode, only custom symbols, exclude if name contains - Fallback to all custom symbols, max symbols to audit Reference - Reference (real) symbol, timeframe, bars per symbol Test thresholds - Vol ratio "too high" / "too low" - Drawdown ratio "too high" - |AC1| trend / reversion threshold - Score >= this = OK Panel - Show panel, panel corner, X / Y offset, panel width, max symbol rows - Font, font size, rebuild interval Colours - Background, header, border, key text, value text NOTES - Read-only. Never sends orders and never changes a symbol. - Needs enough bars on both the reference and the audited symbols; symbols without data are shown as "-". - The thresholds are inputs, so they can be tuned to your generator instead of the defaults. - Standard chart objects only: no DLLs, no external requests. DISCLAIMER This indicator is an analysis tool. A high score means the statistics are close to the reference, not that the data or any strategy will be profitable. Trading involves risk.