AnchoredVWAP Pro
- Indicadores
- Versão: 2.5
- Atualizado: 13 outubro 2026
- Ativações: 20

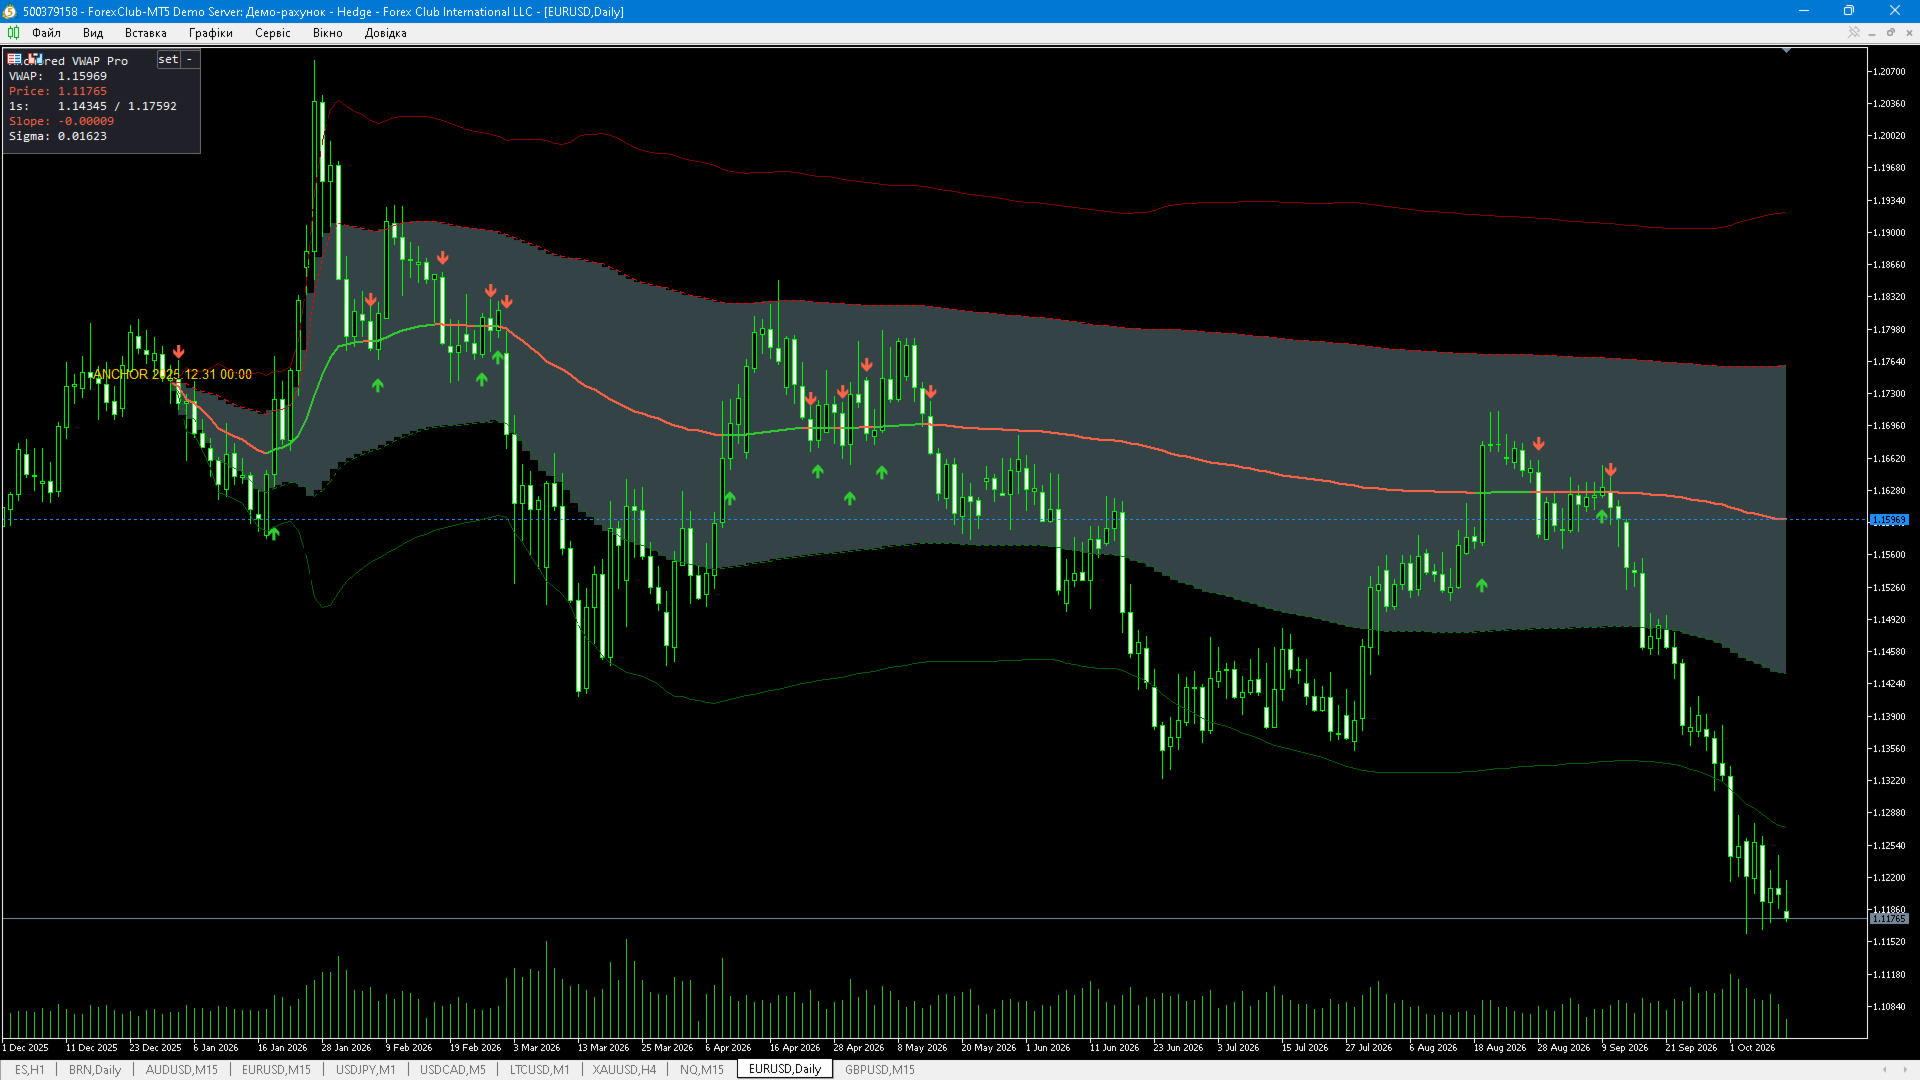
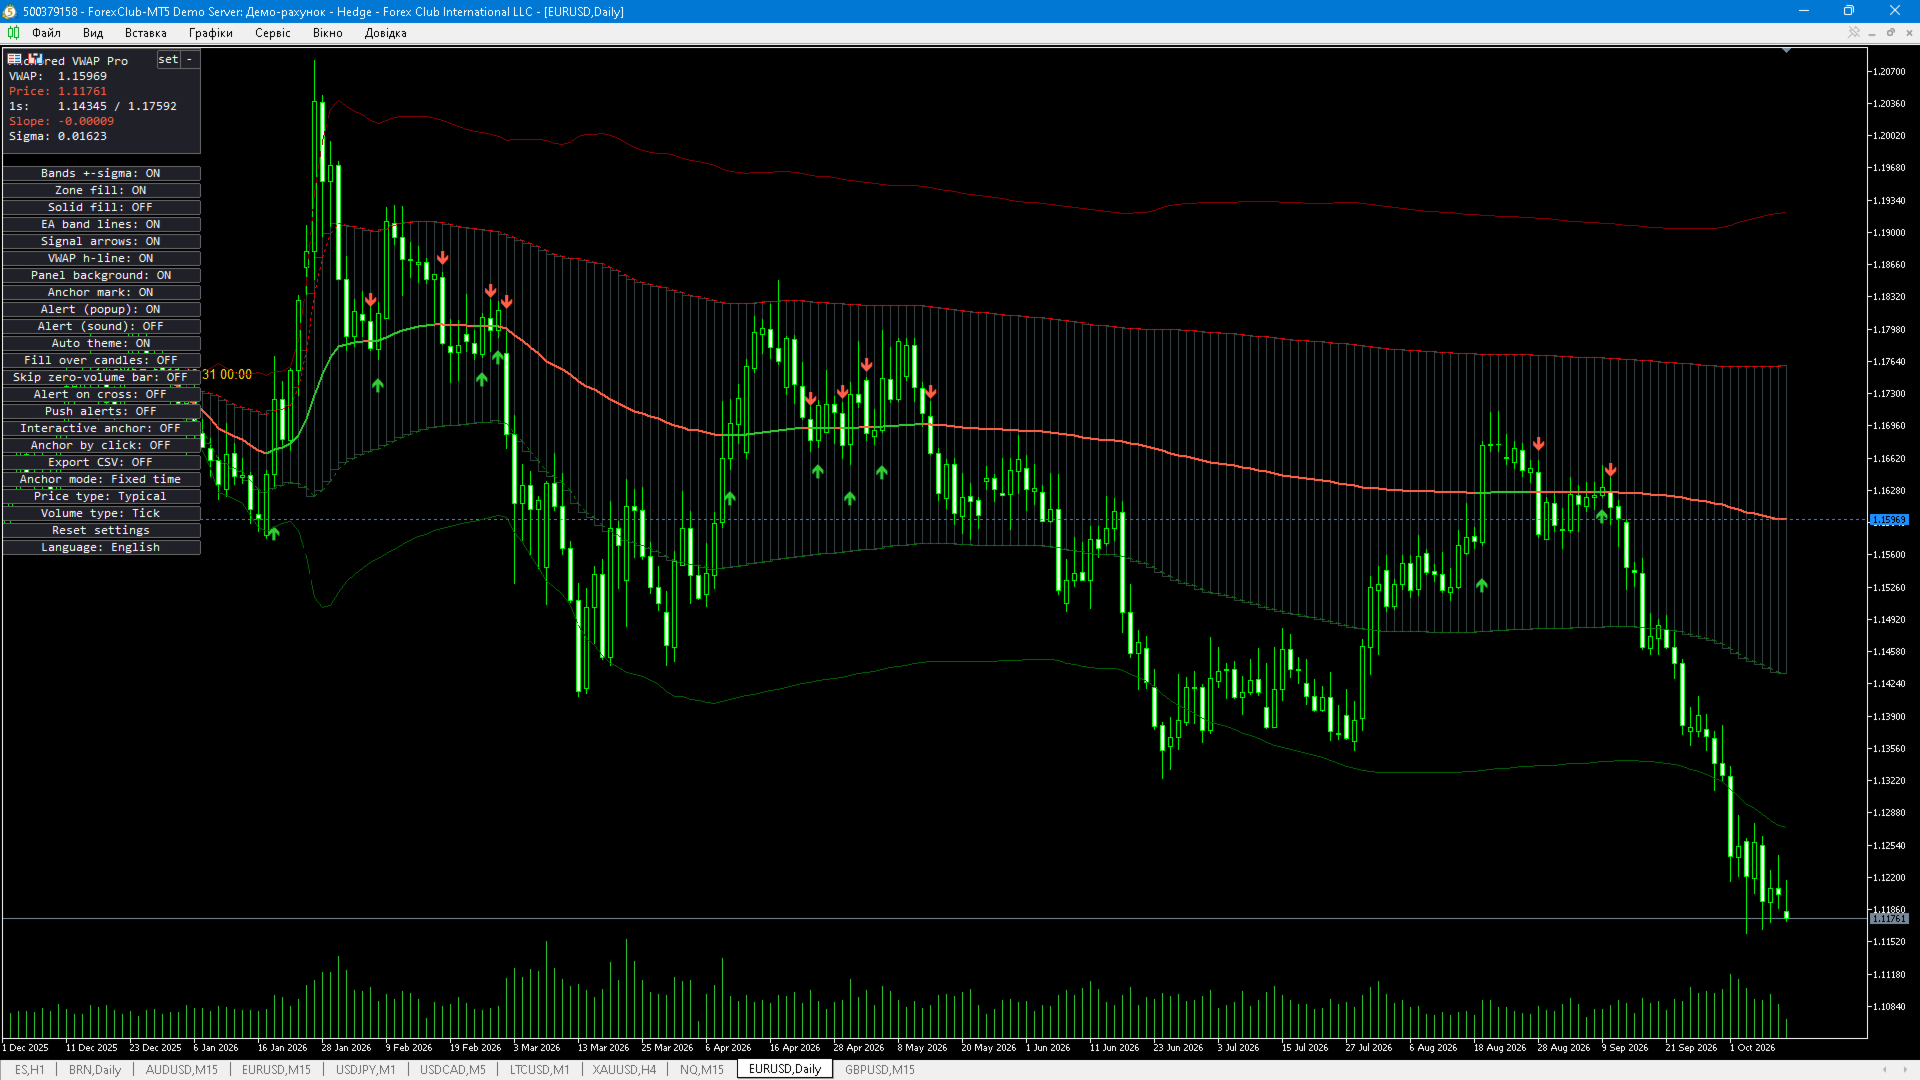
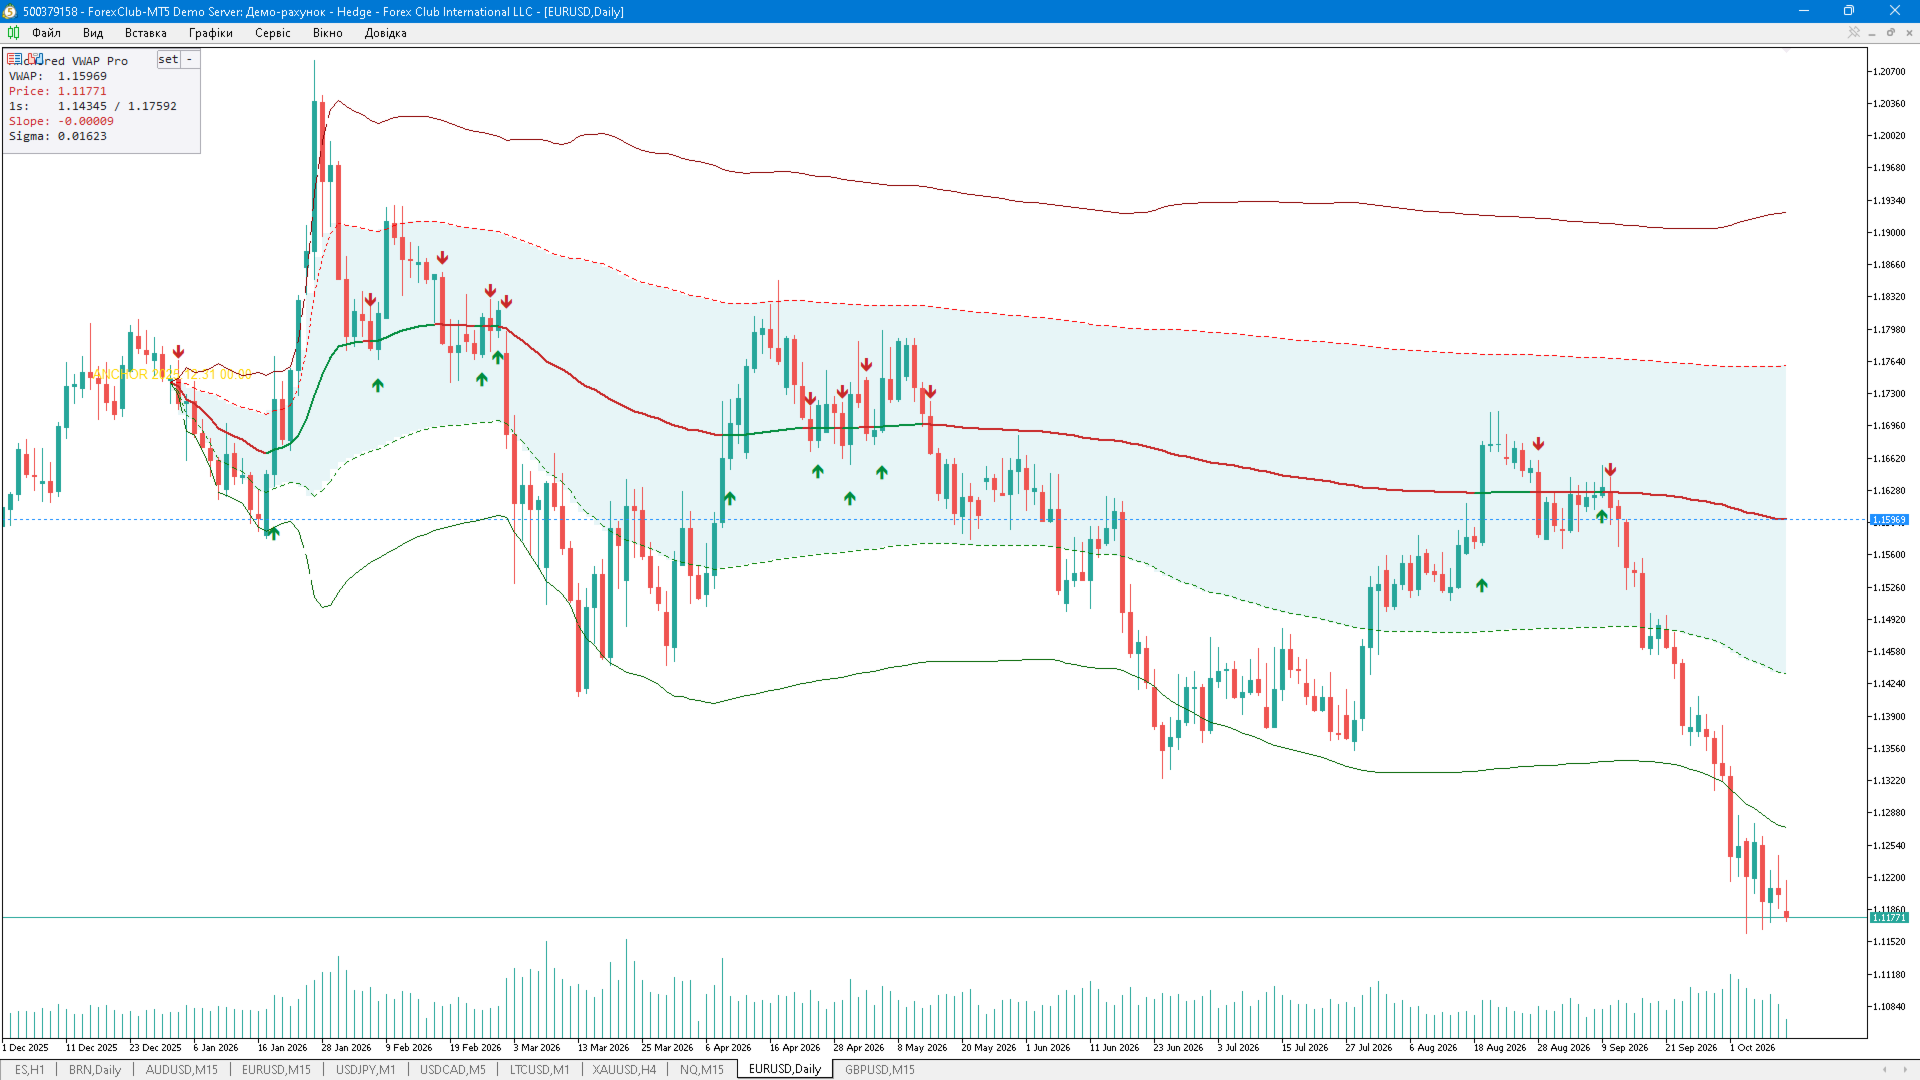
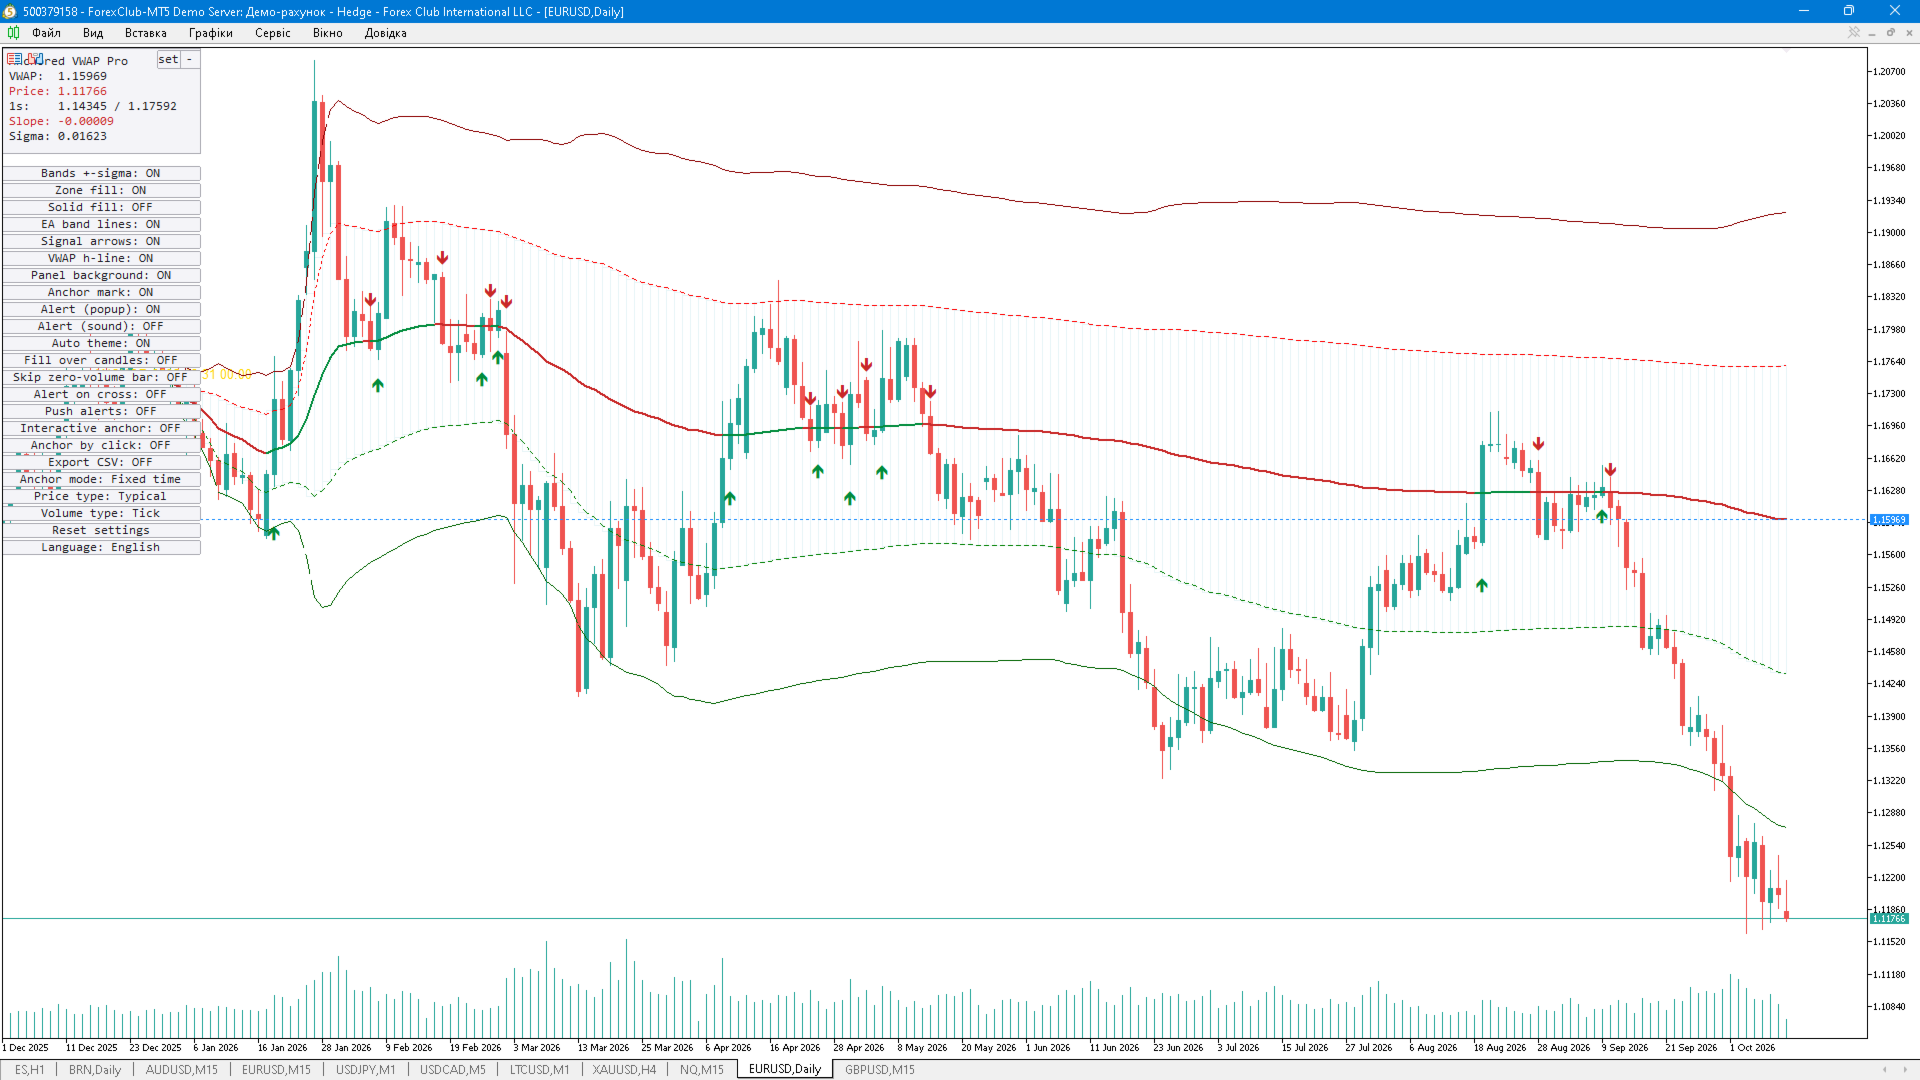
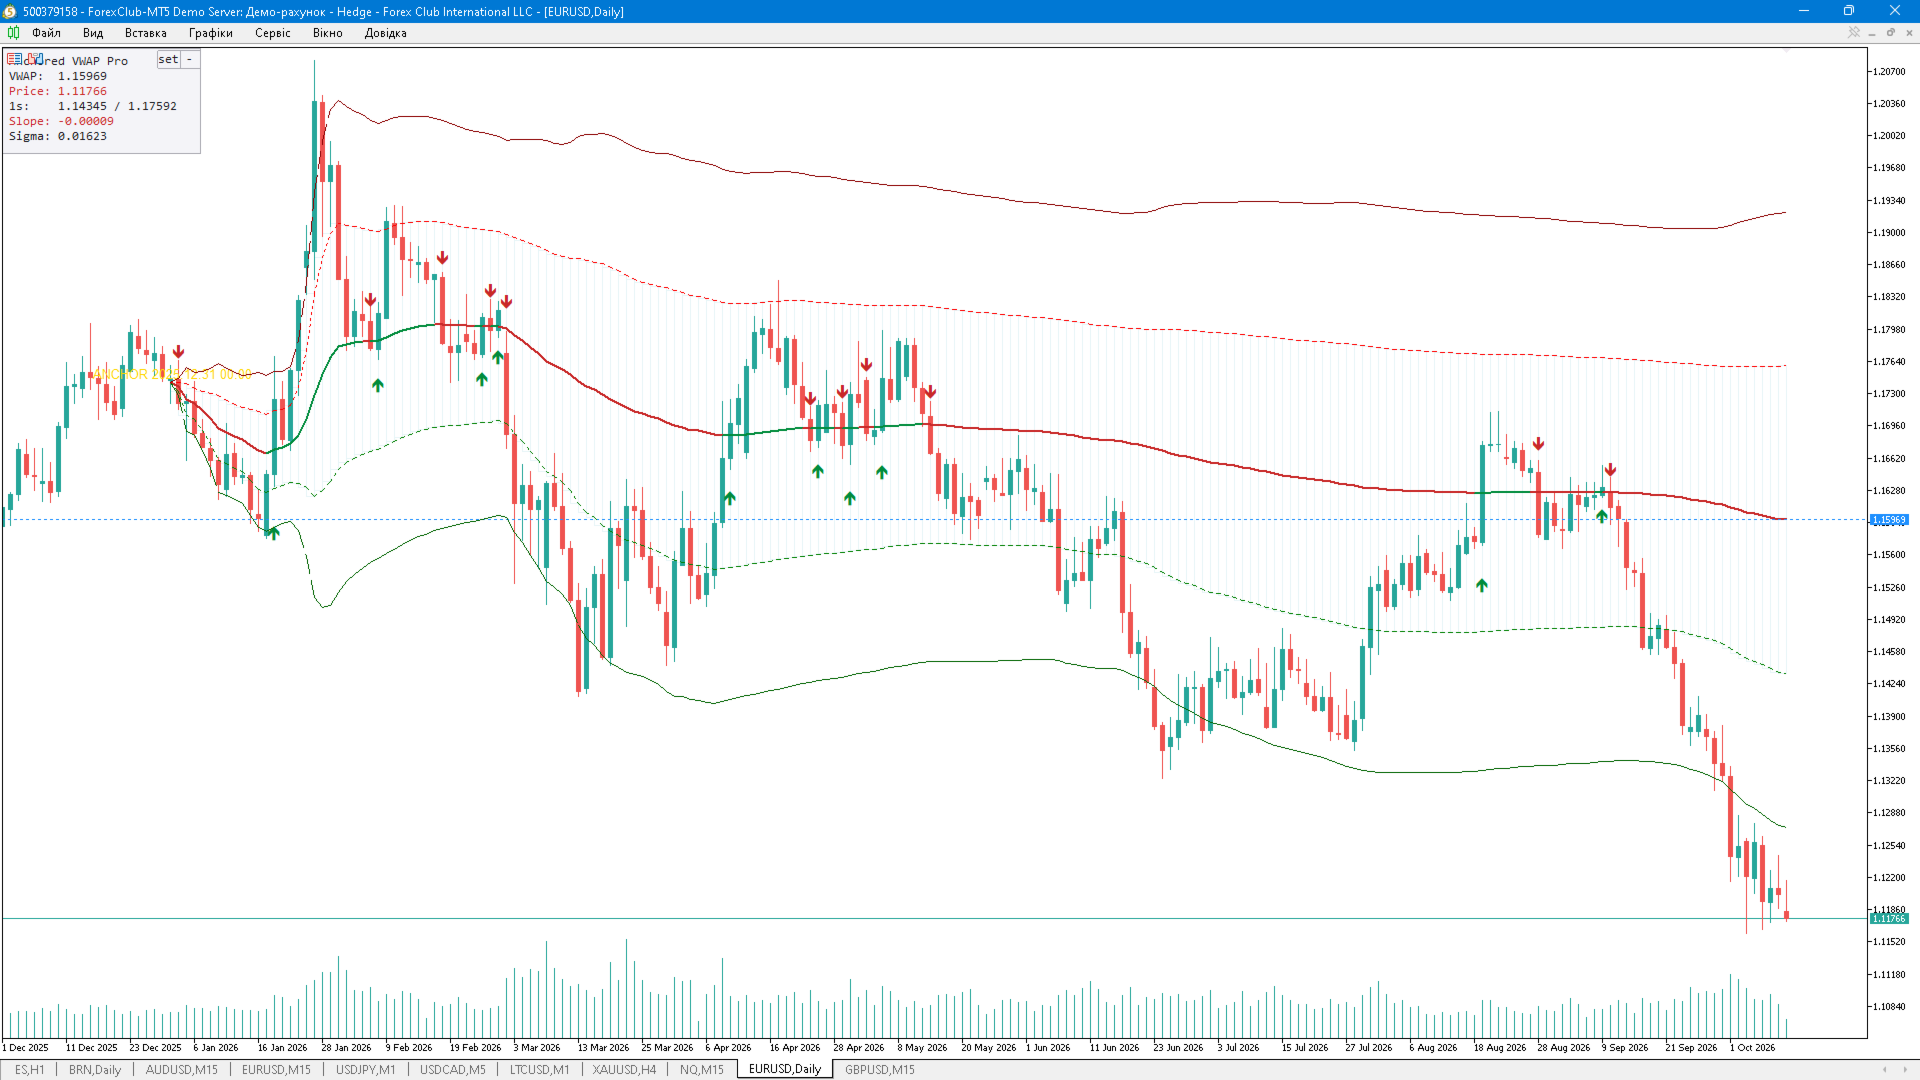
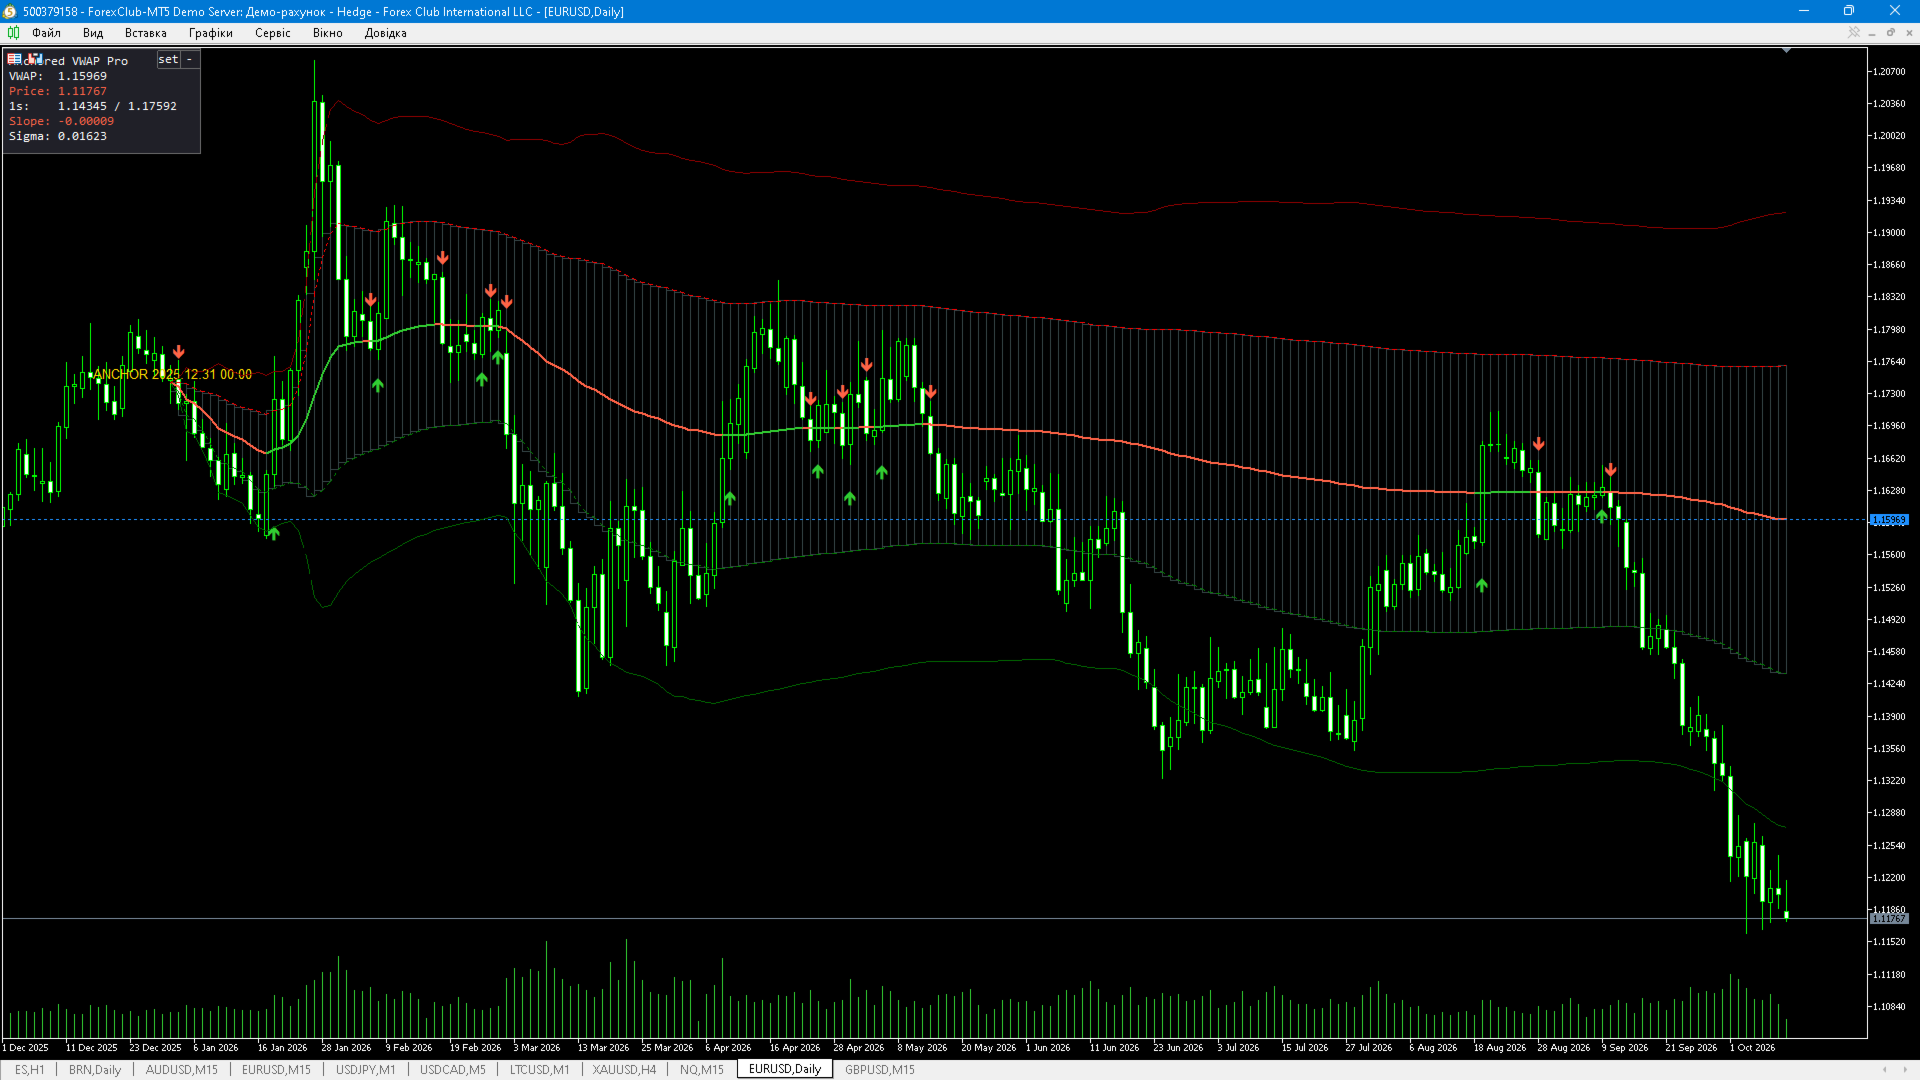
Anchored VWAP Pro — Anchored VWAP with standard deviation bands and an interactive panel SHORT DESCRIPTION (119 chars) Anchored VWAP with ±1σ/±2σ bands, zone fill, extra anchors (PDH, PDL, week, month), signals, alerts, interactive panel. FULL DESCRIPTION Anchored VWAP Pro is a professional implementation of the Anchored Volume Weighted Average Price (AVWAP) with standard deviation bands, zone fill, additional anchored series, signal arrows, alerts and an interactive information panel. Unlike the classic VWAP that resets at the session start, the anchor point is selected by the user: an exact date and time, or the open of the current day, week or month. All statistics are accumulated from the anchor bar forward, so the indicator answers the practical question: what is the average price of all volume traded since this event, and how far has price deviated from it. KEY FEATURES - Anchor modes: fixed date and time, current day open, current week open, current month open. - Anchor bar rule: the bar containing the anchor or the first bar after it. - Price types: Close, Typical (H+L+C)/3, Median (H+L)/2, Weighted (H+L+2C)/4. - Volume types: tick volume or real volume (when the symbol provides it). - Option to skip bars without volume (they are counted with weight 1 instead of volume). - ±1σ and ±2σ bands with configurable multipliers. - ±1σ zone fill in two styles: rectangles (boxes) per candle or boundary lines. - Additional anchored series, each with its own color and line style: VWAP from the previous day high (PDH), from the previous day low (PDL), from the week open and from the month open. - VWAP line coloured by price position: one colour above VWAP, another below. - Signal arrows when the price closes across VWAP (closed bars only). - Alerts: price/VWAP cross, price approaching VWAP by N points, price touching the ±Nσ band. Popup, push notification and sound are supported. - Draggable and collapsible information panel with 23 control rows. - Anchor marker on the chart; the anchor can be set interactively by click or by dragging the marker. - Optional CSV export of the calculated series. - Interface language: English, Russian, Ukrainian. HOW IT WORKS VWAP is the volume weighted mean price from the anchor bar to the current bar: VWAP = Σ(price × volume) / Σ(volume) The dispersion around VWAP is the volume weighted standard deviation: σ = sqrt( Σ(price² × volume) / Σ(volume) − VWAP² ) Bands are plotted as VWAP ± k × σ, where k is set separately for band 1 (default 1.0) and band 2 (default 2.0). Calculation is incremental: only the last bars are recalculated on a new tick, and a full recalculation is performed when the anchor changes, when the day changes, on the first calculation and periodically every N bars (input InpRebaselineBars, default 20000) to avoid floating point drift on very long histories. Repainting: the VWAP value of the current (unfinished) bar changes with every tick, as the formula requires. Signal arrows are formed only on closed bars and are not recalculated afterwards. ADDITIONAL ANCHORED SERIES Each series (PDH, PDL, week open, month open) is calculated by the same formulas and can be enabled independently. They are useful as dynamic reference levels for the previous day's extremes, the weekly and the monthly opening price. INFORMATION PANEL The panel shows the current VWAP, the current price, the position inside the ±1σ zone, the VWAP slope and σ. Below the header there are 23 interactive rows that duplicate the main settings without opening the properties dialog: bands, zone, solid fill, EA-style band lines, signals, VWAP line, panel background, anchor marker, alert popup, alert sound, auto theme, fill over candles, skip bars without volume, cross alert, push notification, interactive mode, click-to-set anchor, CSV export, anchor mode, price type, volume type, reset to inputs, interface language. The panel can be dragged with the mouse (the position is remembered per chart), collapsed into a header, and its state is stored separately for each chart. Input parameters always have priority: if a parameter is changed in the indicator properties dialog, the stored panel state is discarded. SIGNALS An up arrow is drawn when the price closes above VWAP after being at or below it; a down arrow — in the opposite case. Arrows are displayed for the last N bars (input InpSignalBars, default 300) and are formed only on closed bars. ALERTS - Cross: the price crosses VWAP. - Approach: |price − VWAP| ≤ N points (input InpAlertTouchPts). - Band touch: the distance from VWAP reaches the configured Nσ band (input InpAlertSigma, 0 disables it). Alert outputs: popup window, push notification, sound file. Only one alert per bar is sent. INPUTS --- Language --- InpLanguage = English Interface language: English / Russian / Ukrainian --- Anchor --- InpAnchorMode = Fixed date and time Anchor mode: fixed date and time / current day open / current week open / current month open InpAnchorTime = 2026.01.01 00:00 Anchor date and time (for the fixed date and time mode) InpAnchorBar = Bar containing the anchor Anchor bar selection rule: bar containing the anchor / first bar after the anchor --- Price and Volume --- InpPriceType = Typical (H+L+C)/3 Price type: Close / Typical / Median / Weighted InpVolumeType = Tick volume Volume type: tick volume / real volume InpSkipZeroVolume = false Skip bars without volume --- Standard Deviation Bands --- InpShowBands = true Show ±σ bands InpBand1 = 1.0 Band 1 multiplier, sigma InpBand2 = 2.0 Band 2 multiplier, sigma --- Zone Fill --- InpFillZone = true Show ±1σ zone (independent of bands) InpZoneStyle = Rectangles (boxes) per candle Zone style: boxes per candle / boundary lines InpEaBandLines = true Bands as separate line segments (±1σ dotted, ±2σ dashed) InpAutoTheme = true Auto colours matching the chart theme (light/dark) InpFillColor = PowderBlue Fill colour (None — automatic by theme) InpFillOpacity = 30 Fill density, % (100 — solid) InpFillOverCandles = false Fill over candles (false — behind candles) InpFillSolid = false Solid zone fill (false — outline lines only) --- Additional Anchors --- InpUsePrevDayHigh = false VWAP from the previous day high InpUsePrevDayLow = false VWAP from the previous day low InpUseWeekOpen = false VWAP from the week open InpUseMonthOpen = false VWAP from the month open --- Alerts --- InpAlertCross = false Alert on price/VWAP cross InpAlertTouchPts = 0.0 Alert on approach to VWAP, points InpAlertSigma = 0.0 Alert on band touch, sigma (0 — disabled) InpAlertPopup = true Popup window InpAlertPush = false Push notification InpAlertSound = false Sound InpAlertSoundFile = alert.wav Sound file --- Display --- InpShowPanel = true Show information panel InpPanelCorner = Left upper corner Panel corner InpPanelX = 6 X offset InpPanelY = 6 Y offset InpPanelFontSize = 9 Font size InpPanelColor = White Text colour InpPanelDraggable = true Panel: drag with mouse InpPanelCollapsible = true Panel: collapse/expand button InpShowAnchorMark = true Anchor marker on chart InpColorAbove = LimeGreen VWAP colour when price is above InpColorBelow = Tomato VWAP colour when price is below --- Interactivity and Service --- InpInteractive = false Allow anchor dragging InpClickSetAnchor = false Set anchor by click InpExportCSV = false Export values to CSV InpRebaselineBars = 20000 Full recalculation every N bars (0 — disabled) --- Visual Elements --- InpShowSignals = true Show signal arrows InpSignalBars = 300 Mark the last N bars with arrows InpShowVwapLine = true Horizontal line of the current VWAP InpPanelBG = true Panel background InpPanelWidth = 200 Panel width, pixels InpPanelBGColor = 32,32,40 Panel background colour InpPanelBorder = DimGray Panel border colour InpColorUp = LimeGreen Colour of values above VWAP InpColorDown = Tomato Colour of values below VWAP DATA WINDOW AND BUFFER INDEXES (for iCustom) 0 VWAP 1 VWAP colour index 2 Upper 1 sigma 3 Lower 1 sigma 4 Upper 2 sigma 5 Lower 2 sigma 6 VWAP PDH 7 VWAP PDL 8 VWAP Week 9 VWAP Month 10 ±1σ zone upper 11 ±1σ zone lower 12 VWAP slope 13 signal (1 buy, -1 sell, 0 none) CSV EXPORT When enabled, the calculated series are written to MQL5\Files\AVWAP_Pro.csv: time;vwap;upper1;lower1;upper2;lower2;slope;signal INSTALLATION AND USAGE Copy Anchored_VWAP_Pro.mq5 (or the compiled .ex5) to MQL5\Indicators, compile in MetaEditor and attach it to a chart. The indicator works on any symbol and timeframe. For intraday trading, anchors such as the current day open or a significant event time are usually the most informative; for higher timeframes, the week and month open anchors are convenient. The default settings (typical price, tick volume) work on any instrument; on instruments with real volume, the real volume mode can be selected. NOTES - This is an indicator: it does not open, modify or close any orders and does not trade. - Values of the current bar change until it closes; closed bar values and signal arrows are not recalculated. - Bands and zone fill are drawn as chart objects; on very long histories a large number of bars can be displayed, which is why the drawing window is limited to the visible area and one extra screen. - The product is provided for chart analysis. It is not a trading system and no profit is promised. Test the settings on a demo account before using them in real trading.