Dynamic Fibonacci Deviation MT4
- Indicadores
- Versão: 1.10
- Atualizado: 30 julho 2026

Product Overview
Dynamic Fibonacci Deviation is an adaptive Fibonacci levels main chart indicator designed specifically for both MT4 and MT5 platforms. It innovatively combines EMA dynamic midline, standard deviation volatility, and Fibonacci ratios to construct an intelligent support/resistance system that automatically expands and contracts with market volatility. Through overbought/oversold recognition and fall back/bounce signals, this indicator helps traders accurately capture high-probability trading opportunities in mean-reversion markets, while providing comprehensive real-time status monitoring and multi-channel alerts.
Core Features
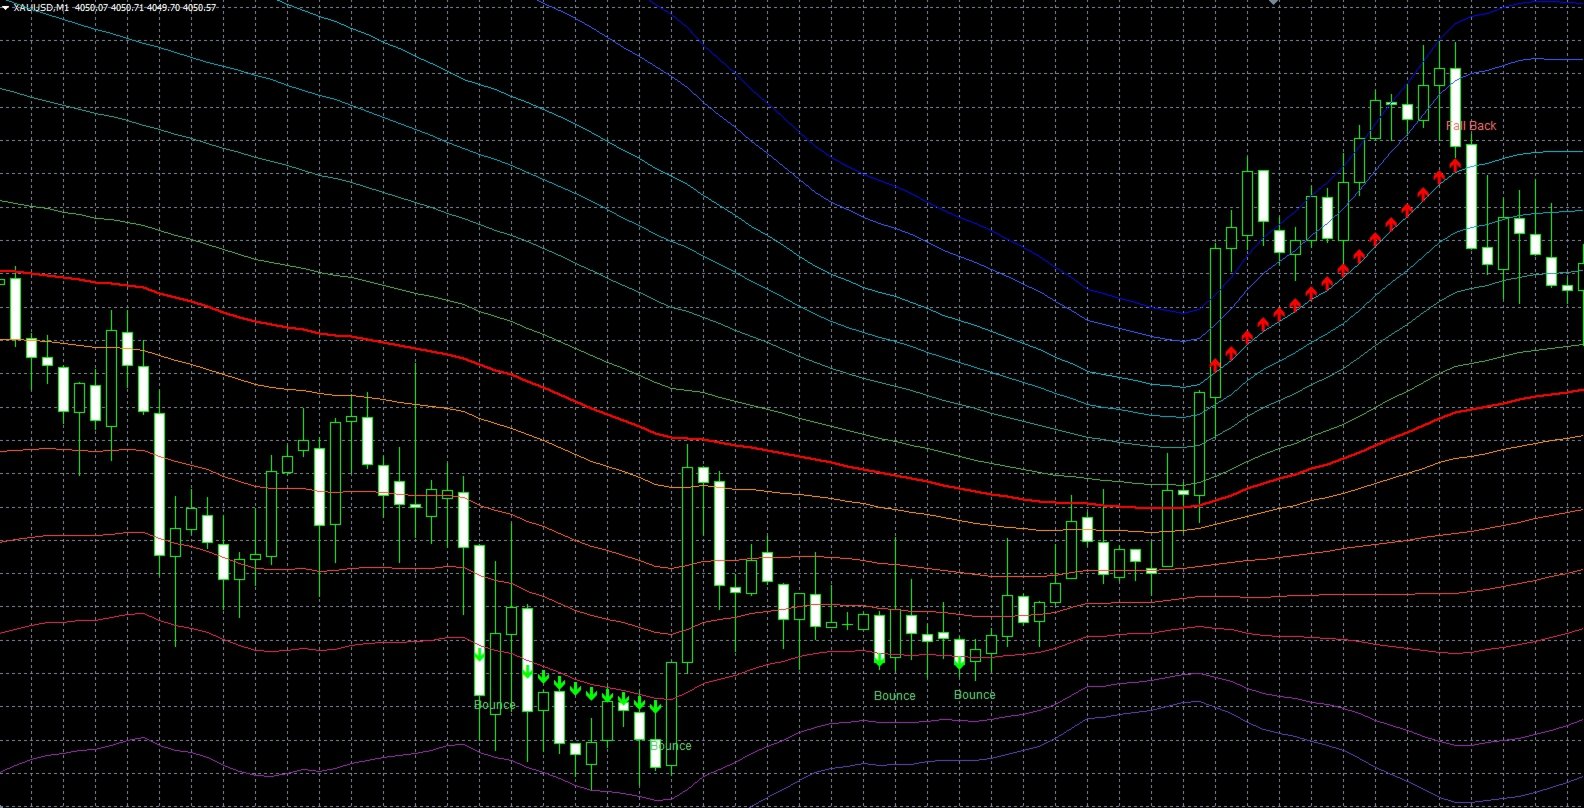
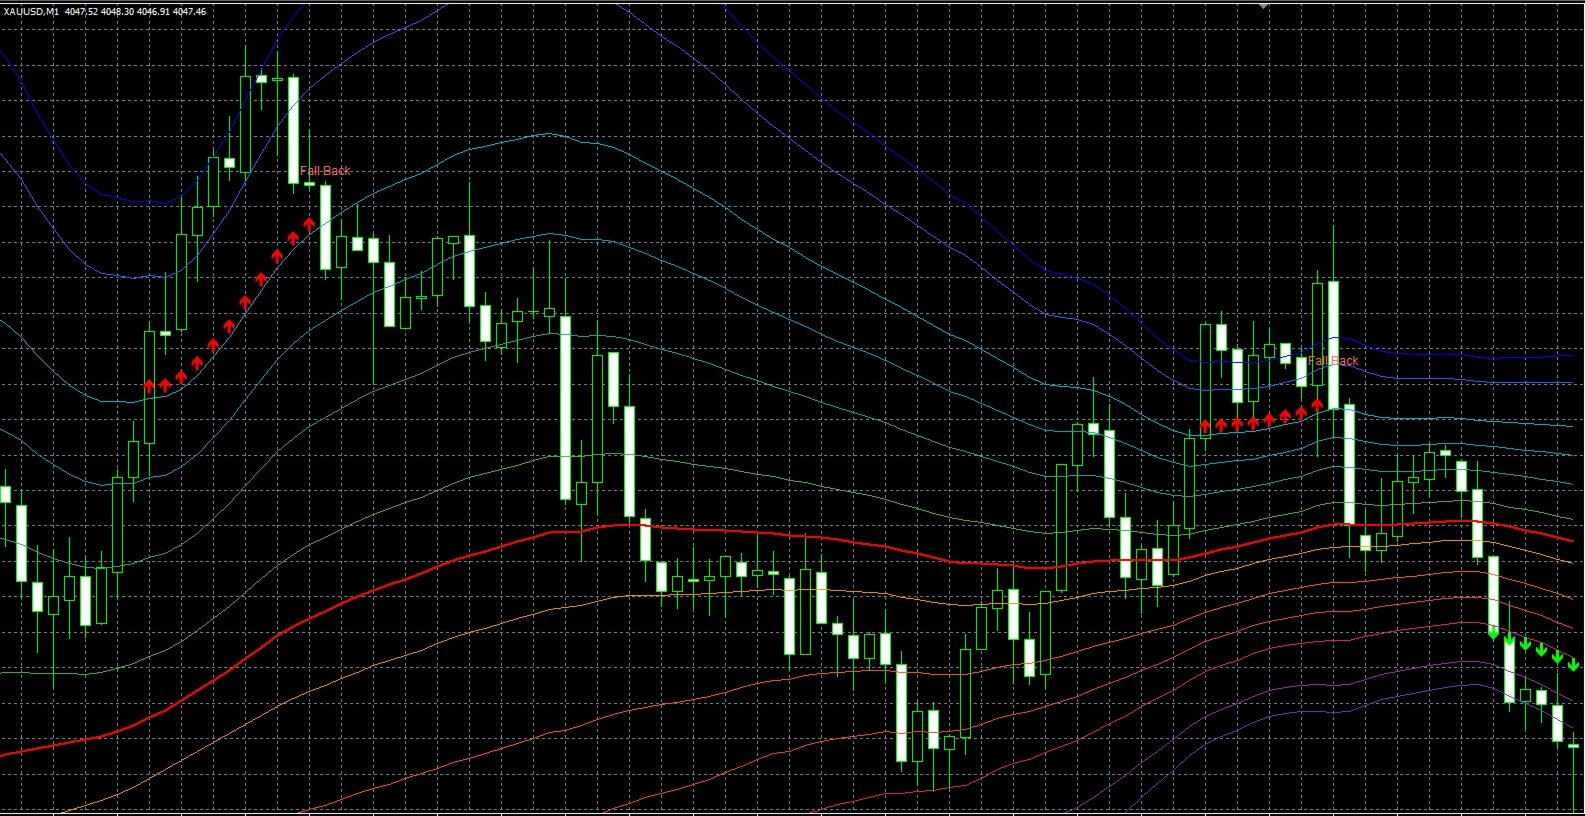
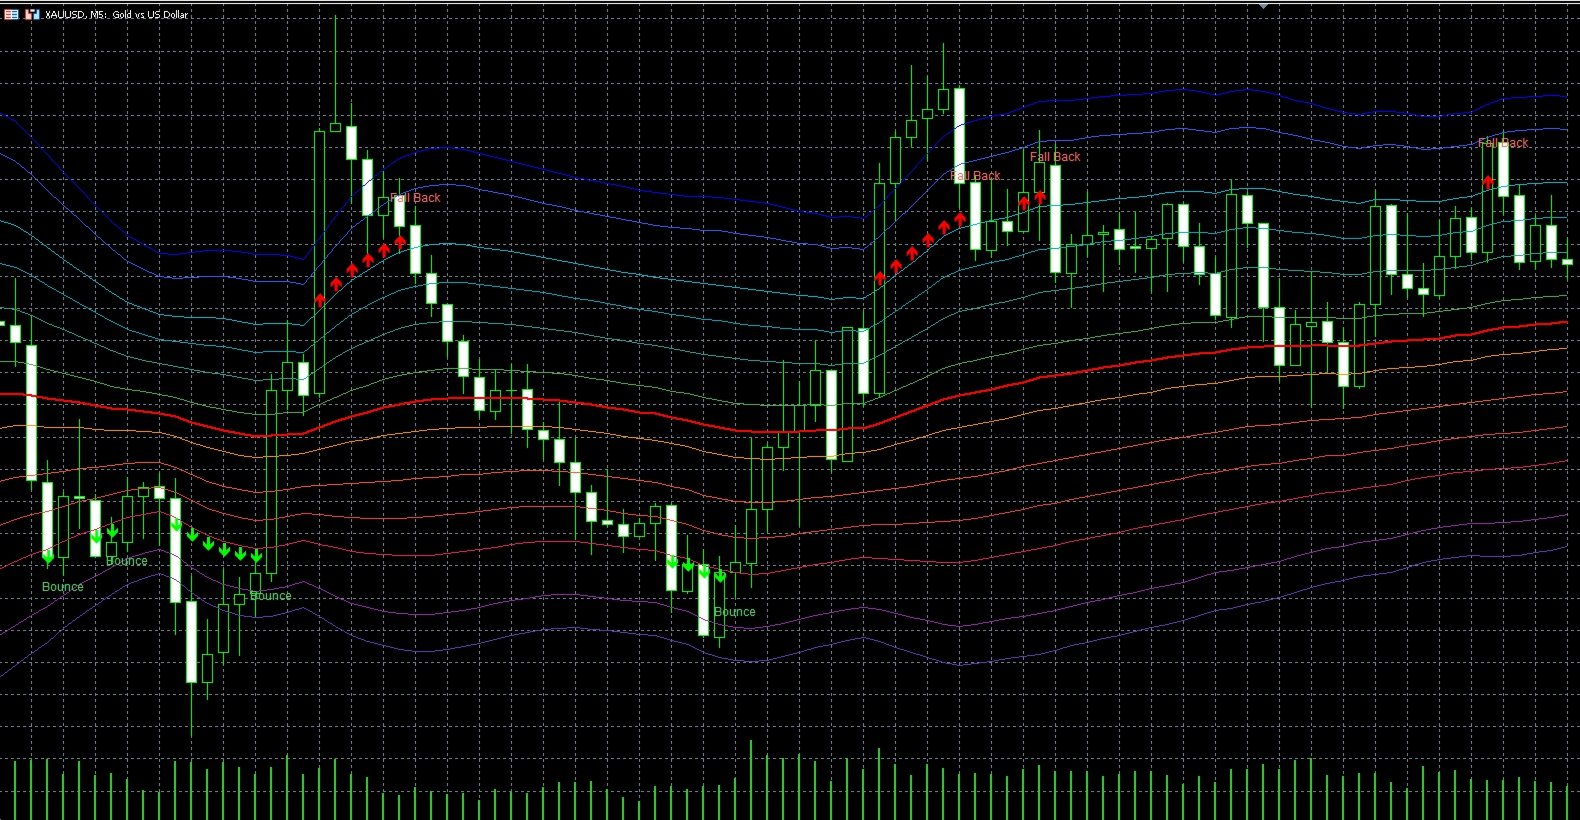
Adaptive Fibonacci Channel & Candle Coloring The system uses EMA as the dynamic midline, combined with standard deviation to calculate current market volatility range, and dynamically adjusts Fibonacci ratios through EMA-smoothed maximum deviation multipliers. Six horizontal lines are drawn above and below the channel, covering classic Fibonacci ratios of 0.191, 0.5, 0.75, 1.0, 1.382, and 1.618, with colors gradually transitioning from green (lower levels) to purple (higher levels), making the price's volatility range instantly recognizable. The right side of the chart shows real-time midline price and standard deviation values. The MT5 version additionally features trend candle coloring, making overbought/oversold states even more intuitive through color changes.
Buy Signals
- Oversold: Triggered when price closes below the lower 4th level line (Dn4, 1.0 standard deviation). This represents price has deviated too far from the mean, entering statistically oversold territory, representing a potential mean-reversion buying opportunity.
- Bounce: Triggered when price recovers from the previous bar's oversold territory (below Dn4) and the current close rises above Dn4. This represents exhaustion of bearish power and the beginning of price reversion to the mean, serving as a clear right-side entry signal.
Sell Signals
- Overbought: Triggered when price closes above the upper 4th level line (Up4, 1.0 standard deviation). This represents price has deviated too far from the mean, entering statistically overbought territory, representing a potential mean-reversion short-selling opportunity.
- Fall Back: Triggered when price falls from the previous bar's overbought territory (above Up4) and the current close drops below Up4. This represents exhaustion of bullish power and the beginning of price reversion to the mean, serving as a clear right-side short-selling or exit signal.
Practical Application
In ranging markets, when price touches Up4 or outer level lines and an Overbought signal appears, it represents price is at a statistical high, and light probe short positions can be considered. If a Fall Back signal subsequently appears, it represents price is beginning to fall back, serving as timing for position addition or short confirmation, with targets aimed at the midline or lower bands.
When price touches Dn4 or outer level lines and an Oversold signal appears, it represents price is at a statistical low, and light probe long positions can be considered. If a Bounce signal subsequently appears, it represents price is beginning to rebound, serving as timing for position addition or long confirmation, with targets aimed at the midline or upper bands.
In strong trending markets, price may run above Up4 or below Dn4 for extended periods. In such cases, mean-reversion strategies should be used cautiously, and it is recommended to filter with trend indicators.
Parameter Guide
Core algorithm parameters: EMA Period defaults to 100, controlling the calculation period for midline and standard deviation (higher values make the channel smoother but slower to react); Text Gap (ATR) defaults to 0.35, dynamically calculating text-to-candle distance based on ATR to ensure clean layouts across all timeframes; Max Lookback Bars defaults to 2000, controlling the maximum historical signal annotation range.
Alert settings: Alert On Bar Close is enabled by default. It is highly recommended to keep this on, triggering alerts only after bar close confirmation to avoid false signals caused by intrabar price fluctuations. Popup and Sound are enabled by default; Push and Email are disabled.
Individual signal alert toggles: The system allows you to independently enable or disable alerts for Overbought, Oversold, Fall Back, and Bounce, catering to personalized trading needs.
Usage Notes
This indicator is suitable for major trading instruments including Forex, Metals, Indices, and Crypto. It is fully compatible with both MT4 and MT5 terminals. It is recommended to use it on M15 and higher timeframes for more stable signals. Fibonacci levels perform exceptionally well on H1 and higher timeframes, making them ideal for swing traders.
It is recommended to combine this indicator with trend indicators or fundamental analysis. No indicator guarantees a 100% win rate; please strictly set stop-losses and manage position risk.
Summary
Dynamic Fibonacci Deviation perfectly encapsulates complex adaptive Fibonacci algorithms and mean-reversion logic. It is not only a visually clear charting tool but also a practical trading system with strict signal filtering, volatility recognition, and comprehensive alerts, suitable for traders at all levels to build their own trading rules.