VP Trading Tools
- Indicadores
- Versão: 1.0
- Ativações: 5

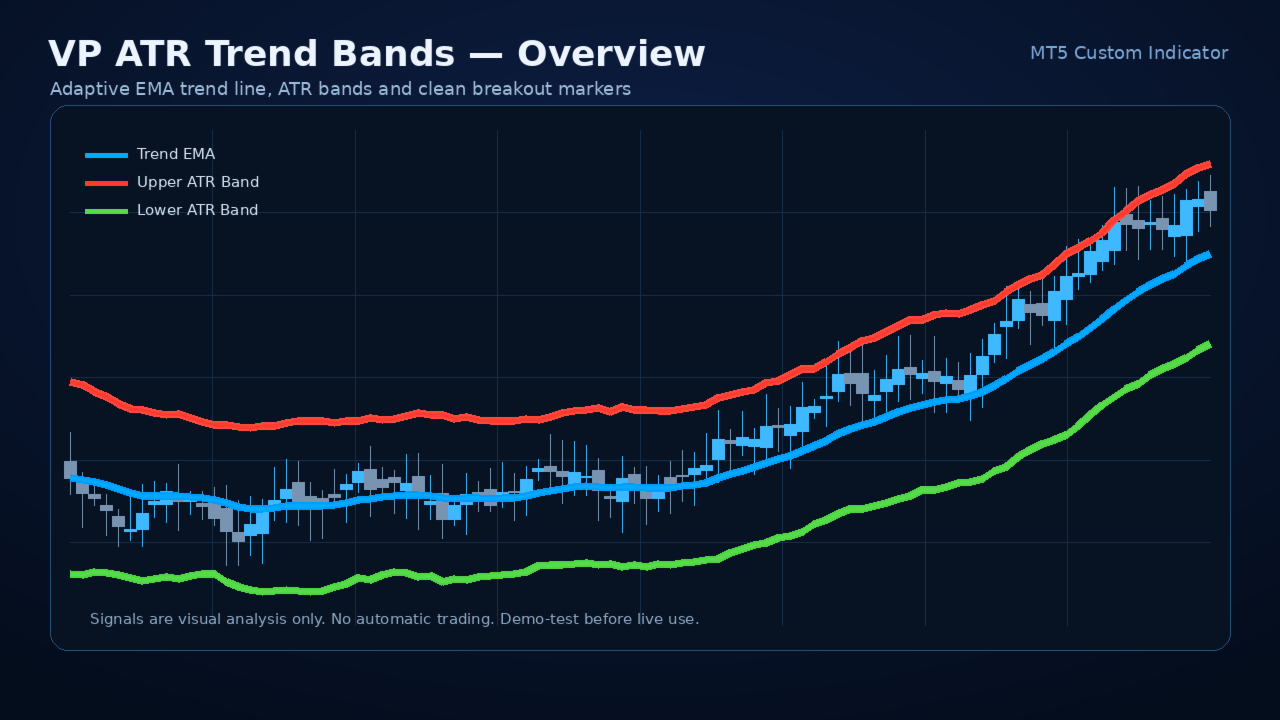
VP ATR Trend Bands is a clean MetaTrader 5 custom indicator designed to visualize trend direction, volatility expansion, and potential breakout zones using an EMA-based trend line and ATR-based upper and lower bands. The indicator displays a central Exponential Moving Average line, two dynamic volatility bands, and optional breakout arrows when price closes beyond the ATR envelope. It is built for traders who want a simple, lightweight, non-trading chart tool for market structure reading, trend-following analysis, volatility awareness, and visual signal confirmation.
Main Product Description
VP ATR Trend Bands is a professional MetaTrader 5 indicator that combines two widely used technical concepts: trend smoothing and volatility measurement. The central line is based on an Exponential Moving Average, while the upper and lower bands are calculated with the Average True Range. Together, these elements create a practical visual channel that adapts to market movement.
The purpose of the indicator is not to predict the future or replace a complete trading plan. Its purpose is to make the current chart environment easier to read. When price moves above the upper ATR band, the market may be showing strong bullish pressure or a volatility breakout. When price moves below the lower ATR band, the market may be showing strong bearish pressure or downside volatility expansion. When price stays near the middle trend line, the market may be consolidating, correcting, or moving in a more balanced condition.
VP ATR Trend Bands is intentionally simple. It does not open trades. It does not close trades. It does not use martingale, grid, hedging, recovery logic, account access, DLL calls, file operations, or external web requests. It is a chart-based technical indicator designed to support decision-making, not to make decisions automatically.
This makes the indicator suitable for traders who prefer manual analysis, discretionary confirmation, strategy building, education, chart review, and visual backtesting. It can be used on Forex, indices, commodities, metals, crypto CFDs, stocks, and any other symbol supported by the MetaTrader 5 terminal, provided that the broker offers enough price history for the selected timeframe.
Core Idea
The core idea of VP ATR Trend Bands is simple:
1. Use EMA to identify the active trend baseline.
2. Use ATR to estimate current market volatility.
3. Create upper and lower bands around the EMA.
4. Display visual breakout arrows when price closes beyond the bands.
5. Help the trader identify strong movement, volatility expansion, and possible trend continuation zones.
Many traders use moving averages to identify trend direction, but a moving average alone does not describe volatility. A market may move above or below an average simply because normal volatility expands. ATR helps solve this by measuring the recent average trading range. By adding and subtracting an ATR value from the EMA, the indicator creates an adaptive envelope around price.
When volatility increases, the bands widen. When volatility decreases, the bands contract. This allows the indicator to adjust visually to different market conditions instead of using fixed-distance bands that may be too narrow during volatile sessions or too wide during quiet sessions.
Indicator Components
1. Trend EMA
The Trend EMA is the main trend reference line. It is displayed as a smooth blue line. The default period is 50, but it can be adjusted according to the trader's style. A smaller EMA period makes the line more responsive. A larger EMA period makes the line smoother and slower.
2. Upper ATR Band
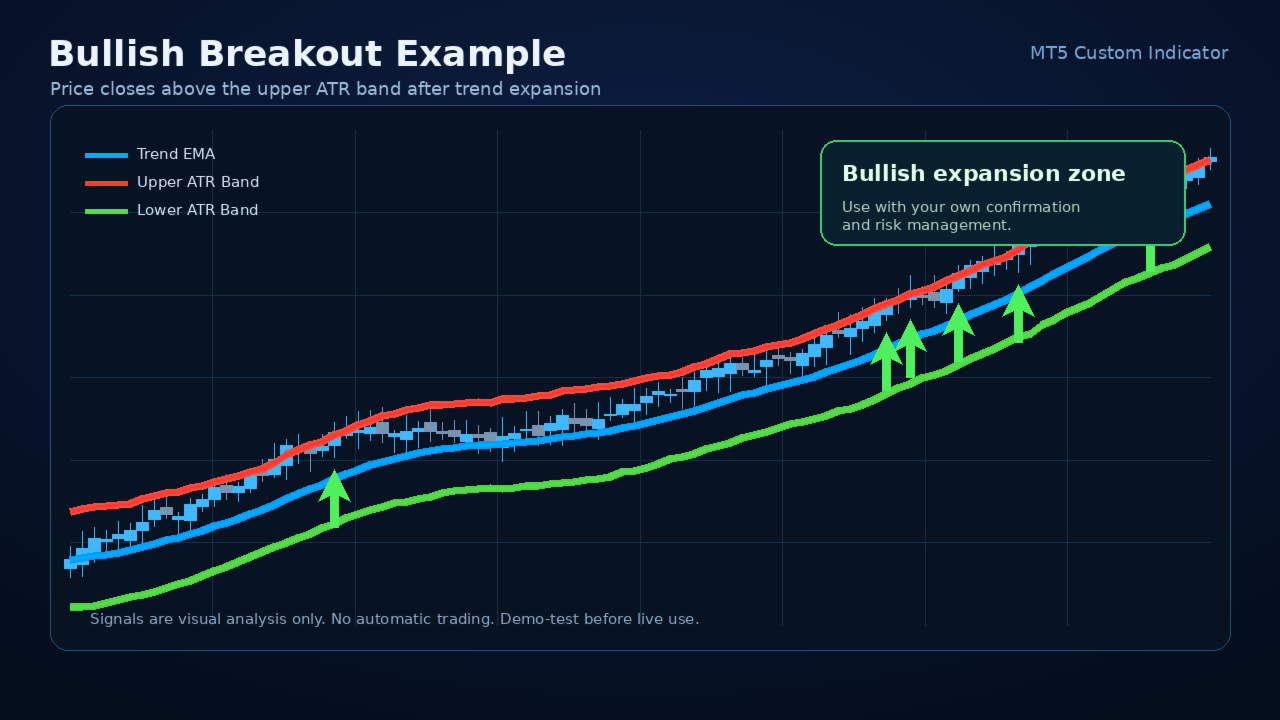
The upper band is calculated above the EMA using the ATR multiplier. It represents a volatility-adjusted upper boundary. When price closes above this band, the market may be showing strong bullish movement, momentum expansion, or a possible breakout condition.
3. Lower ATR Band
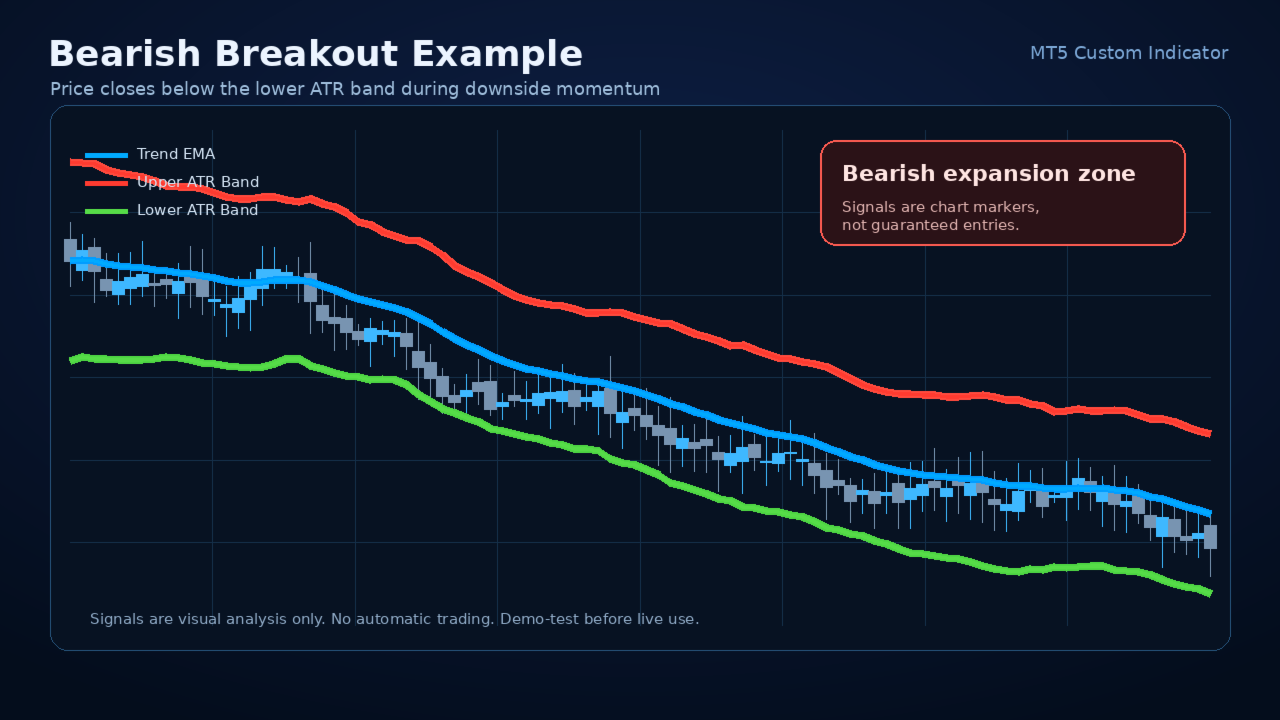
The lower band is calculated below the EMA using the ATR multiplier. It represents a volatility-adjusted lower boundary. When price closes below this band, the market may be showing strong bearish movement, downside expansion, or a possible bearish breakout condition.
4. Buy Signal Arrow
The optional buy arrow appears when price closes above the upper band after previously being at or below the upper band. This helps highlight the first breakout event instead of marking every candle that stays outside the band.
5. Sell Signal Arrow
The optional sell arrow appears when price closes below the lower band after previously being at or above the lower band. This helps identify the first downside breakout event after the market leaves the previous band zone.
Important: arrows are signals for visual analysis only. They are not financial advice and they should not be used as standalone entry instructions. Always confirm signals using your own trading method, risk rules, market context, and broker conditions.
Key Features
- Clean EMA and ATR band structure.
- Dynamic volatility bands that adapt to changing market range.
- Optional buy and sell arrows.
- Input validation for safer operation.
- Lightweight design for normal chart use.
- Works on MetaTrader 5.
- Designed as an indicator, not an Expert Advisor.
- Does not execute trades.
- Does not modify account positions.
- Does not use DLL imports.
- Does not use external web requests.
- Does not use file operations.
- Can be used on multiple symbols and timeframes.
- Useful for manual traders, strategy testers, educators, and analysts.
- Simple enough for beginners, flexible enough for experienced traders.
- Suitable for trend-following, breakout analysis, volatility observation, and chart review.
- Includes alert option for breakout signals.
- Built around common, transparent technical analysis concepts.
How the Indicator Works
The indicator first calculates an Exponential Moving Average using the selected applied price. It then calculates the Average True Range using the selected ATR period. The ATR value is multiplied by the ATR multiplier. The result is added to the EMA to form the upper band and subtracted from the EMA to form the lower band.
The calculation can be described conceptually as:
Trend Line = EMA(Applied Price, EMA Period)
Upper Band = Trend Line + ATR × Multiplier
Lower Band = Trend Line - ATR × Multiplier
A buy arrow is generated when the current candle closes above the upper band and the previous candle was not already above the upper band. A sell arrow is generated when the current candle closes below the lower band and the previous candle was not already below the lower band.
This approach highlights fresh band breakouts rather than continuously painting repeated arrows on every candle outside the band.
Why Use ATR Bands?
ATR is a popular volatility measurement tool because it focuses on the size of recent market movement. A fixed-distance channel does not adapt well to different volatility environments. A market may be quiet during one session and highly active during another. ATR-based bands help the channel expand and contract with changing conditions.
This makes VP ATR Trend Bands useful for observing when price is moving beyond its recent volatility envelope. A breakout beyond the upper or lower band may indicate increased momentum, a shift in behavior, or a trend continuation attempt. However, like every technical indicator, it can also produce false signals during choppy or unstable markets.
Suggested Use Cases
Trend Continuation Analysis
When price is above the EMA and breaks above the upper band, the market may be entering a stronger bullish phase. Traders can use this as one possible confirmation in a broader trend-following approach.
Bearish Continuation Analysis
When price is below the EMA and breaks below the lower band, the market may be entering a stronger bearish phase. Traders can use this as one possible confirmation in a broader bearish trend-following method.
Volatility Expansion Detection
The distance between the bands shows how volatility changes over time. Wider bands suggest larger recent ranges. Narrower bands suggest lower recent volatility.
Chart Filtering
The EMA line can be used as a general trend filter. Some traders may prefer long-only ideas when price is above the EMA and short-only ideas when price is below the EMA.
Breakout Confirmation
The arrows can highlight candles that close beyond the volatility envelope. This can help traders quickly find potential breakout moments during chart review.
Manual Strategy Building
The indicator can be combined with support and resistance, price action, session timing, market structure, higher timeframe bias, or other confirmation tools.
Educational Use
Because the indicator uses clear and familiar concepts, it can help new traders understand the relationship between trend, volatility, and breakout behavior.
Input Parameters
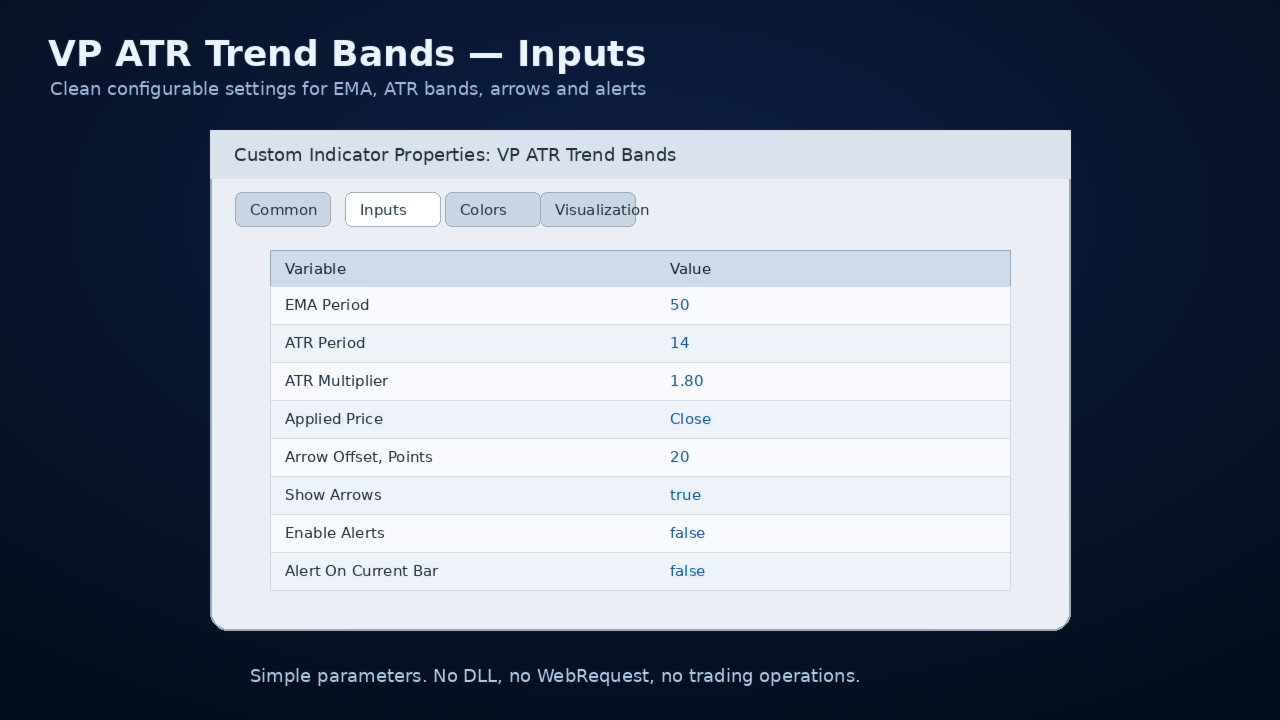
EMA Period
Default: 50
The EMA period controls the smoothness of the central trend line. Lower values make the line react faster to price. Higher values make it smoother and slower.
ATR Period
Default: 14
The ATR period controls how volatility is measured. Lower values make the ATR react faster to recent changes. Higher values smooth the ATR calculation.
ATR Multiplier
Default: 1.80
The ATR multiplier controls the distance between the EMA and the upper/lower bands. A lower multiplier creates tighter bands and more signals. A higher multiplier creates wider bands and fewer signals.
Applied Price
Default: Close
The price type used for the EMA calculation. Traders can choose Close, Open, High, Low, Median, Typical, Weighted, or other MetaTrader-supported applied prices.
Arrow Offset, Points
Default: 20
Controls the visual distance of arrows from the candle high or low. This is only a display setting and does not affect signal logic.
Show Arrows
Default: true
Turns buy and sell arrows on or off.
Enable Alerts
Default: false
Turns popup alerts on or off.
Alert on Current Bar
Default: false
If false, alerts are based on the closed candle. If true, alerts can trigger on the current forming candle. For most traders, closed-bar alerts are usually more stable because the current candle may change before it closes.
Recommended Starting Settings
The default settings are designed as a balanced starting point:
EMA Period: 50
ATR Period: 14
ATR Multiplier: 1.80
Applied Price: Close
Show Arrows: true
Alerts: false
Possible Adjustments
For faster signals:
- Use a smaller EMA period such as 20 or 34.
- Use a smaller ATR multiplier such as 1.2 to 1.5.
- Be aware that faster settings may increase false signals.
For smoother signals:
- Use a larger EMA period such as 100 or 200.
- Use a larger ATR multiplier such as 2.0 to 3.0.
- Be aware that smoother settings may generate fewer and later signals.
For scalping-style chart reading:
- Try shorter timeframes with conservative confirmation.
- Use signals only with spread, session, and volatility awareness.
- Avoid relying on one indicator alone.
For swing analysis:
- Try H1, H4, or Daily timeframes.
- Use higher timeframe direction as a filter.
- Combine with support/resistance or market structure.
Important Usage Notes
VP ATR Trend Bands is a technical analysis tool. It is not a trading system by itself. It does not guarantee accurate entries, profitable trades, or future results. It should be used together with a complete trading plan.
Markets can change quickly. A band breakout may continue strongly or reverse immediately. False breakouts are common, especially during news, low liquidity, abnormal spreads, and sideways conditions.
Always test the indicator on a demo account before using it in live trading. Review it across different symbols, timeframes, and market conditions. Adjust the settings to match your strategy and risk tolerance.
Trading carries risk. Past chart behavior does not guarantee future performance.
What This Indicator Does Not Do
- It does not open trades.
- It does not close trades.
- It does not manage stop loss or take profit.
- It does not calculate position size.
- It does not guarantee profit.
- It does not avoid all false signals.
- It does not predict news events.
- It does not replace risk management.
- It does not replace trader judgment.
Signal Interpretation
Buy Arrow
A buy arrow appears when price closes above the upper ATR band after not being above it on the previous bar. This may suggest bullish momentum expansion. It can be used as a possible alert to inspect the chart for long-side opportunities.
Sell Arrow
A sell arrow appears when price closes below the lower ATR band after not being below it on the previous bar. This may suggest bearish momentum expansion. It can be used as a possible alert to inspect the chart for short-side opportunities.
No Arrow
No arrow means there is no new breakout condition according to the current settings. Price may still be trending, ranging, or consolidating.
Band Width
Wide bands suggest higher recent volatility. Narrow bands suggest lower recent volatility. Sudden expansion may indicate a change in market behavior.
EMA Position
Price above the EMA may support a bullish bias. Price below the EMA may support a bearish bias. Price crossing back and forth around the EMA may suggest a ranging or uncertain condition.
Example Workflow for Manual Traders
1. Select your symbol and timeframe.
2. Apply VP ATR Trend Bands to the chart.
3. Start with default settings.
4. Identify the general direction using the EMA.
5. Observe whether bands are expanding or contracting.
6. Wait for a closed candle breakout beyond the upper or lower band.
7. Use the arrow only as a notification, not as an automatic entry.
8. Confirm with your own method, such as support/resistance, candle structure, session timing, volume, higher timeframe bias, or risk/reward.
9. Decide whether the setup fits your plan.
10. Manage risk according to your own rules.
Possible Combination Ideas
VP ATR Trend Bands can be combined with:
- Support and resistance.
- Trendlines.
- Market structure.
- Higher timeframe direction.
- Candlestick confirmation.
- Breakout and retest logic.
- Session filters.
- Volume indicators.
- Momentum oscillators.
- Risk/reward planning.
- Economic calendar awareness.
However, adding too many tools may create confusion. A simple chart with a clear process is often more useful than a crowded chart with many conflicting signals.
Who This Indicator Is For
VP ATR Trend Bands may be useful for:
- Manual traders who want a clean trend and volatility channel.
- Traders who like EMA-based trend reading.
- Traders who use ATR in their analysis.
- Traders who want breakout alerts without automatic trading.
- Traders who review charts visually.
- Traders who build their own systems.
- Traders who need a simple educational tool.
- Traders who prefer transparent logic instead of black-box indicators.
Who This Indicator Is Not For
This indicator may not be suitable for users who expect:
- Automatic trading.
- Guaranteed profit.
- Full money management.
- A complete trading robot.
- A signal service.
- A no-loss system.
- A news prediction tool.
- A replacement for learning and testing.
Installation
1. Download the product from the MQL5 Market.
2. Open MetaTrader 5.
3. Go to Navigator.
4. Find the indicator in the Market or purchased products section.
5. Attach it to a chart.
6. Adjust the inputs if needed.
7. Start with default settings and observe behavior on historical candles.
Recommended Testing Process
Before using any indicator in live conditions:
1. Test on a demo account.
2. Review historical signals.
3. Compare different timeframes.
4. Try different ATR multipliers.
5. Observe how it behaves during trending markets.
6. Observe how it behaves during ranging markets.
7. Check spread and session conditions.
8. Build written rules before making live decisions.
9. Use conservative risk management.
10. Do not rely on one signal alone.
FAQ
Does VP ATR Trend Bands trade automatically?
No. It is a custom indicator. It provides visual lines and optional arrows, but it does not open, close, or manage trades.
Does it repaint?
The indicator uses current chart data and standard MetaTrader indicator calculations. Arrows based on a closed candle are more stable. If alert-on-current-bar behavior is enabled, current candle conditions may change before the candle closes. For more conservative use, keep alerts based on closed candles.
Can I use it on any symbol?
It can be attached to any symbol supported by MetaTrader 5, as long as there is enough price history available. Different symbols have different volatility behavior, so settings may need adjustment.
Can I use it on any timeframe?
Yes, it can be used on multiple timeframes. Lower timeframes may produce more signals and more noise. Higher timeframes may produce fewer but often more stable signals.
Is it suitable for beginners?
Yes, the visual layout is simple. However, beginners should learn basic risk management and test the indicator on demo before using it with real funds.
Does it guarantee profit?
No. No indicator can guarantee profit. The market is uncertain, and trading involves risk.
What is the best setting?
There is no universal best setting. The default is a balanced starting point. Settings should be tested according to symbol, timeframe, trading style, and market conditions.
Why do bands become wider or narrower?
Bands are based on ATR. When recent price ranges increase, ATR increases and the bands widen. When recent ranges decrease, ATR decreases and the bands narrow.
Why do I get fewer arrows with a higher multiplier?
A higher ATR multiplier moves the bands farther from the EMA, so price needs a stronger move to break outside them.
Why do I get more arrows with a lower multiplier?
A lower ATR multiplier places the bands closer to the EMA, so price can break them more often.
Can I use it with Expert Advisors?
The indicator itself is designed for visual chart use. Advanced users may be able to read its buffers in custom tools, but any automation should be tested carefully.
Suggested Product Screenshots
Screenshot 1:
A clean chart showing the EMA line, upper band, lower band, and several breakout arrows.
Screenshot 2:
A trending market example where price moves above the upper band and continues in the trend direction.
Screenshot 3:
A sideways market example showing why confirmation and risk management are important.
Screenshot 4:
Input settings window showing EMA period, ATR period, multiplier, arrows, and alerts.
Screenshot 5:
A zoomed-in view of buy and sell arrow placement.
Suggested Short Marketing Text
Identify trend direction, volatility expansion, and breakout zones with a clean EMA + ATR band indicator for MetaTrader 5.
Alternative Short Description
VP ATR Trend Bands helps traders visualize an EMA trend baseline, adaptive ATR volatility bands, and optional breakout arrows directly on the chart.
Recommended Tags
ATR, EMA, Trend, Bands, Volatility, Breakout, Indicator, MetaTrader 5, MT5, Trend Following, Manual Trading, Technical Analysis
Risk Disclaimer
Trading financial markets involves risk. VP ATR Trend Bands is a technical analysis indicator and does not guarantee profits or eliminate losses. Signals may be false, delayed, or unsuitable for some market conditions. Always test on a demo account first and use proper risk management. The indicator is not financial advice and should not be used as the only basis for trading decisions.
Support Message Template
Thank you for using VP ATR Trend Bands. If you have questions, please describe your symbol, timeframe, broker server time, indicator settings, and attach a screenshot if possible. This information helps provide faster and more accurate support.
Update Notes Template
Version 1.00:
- Initial release.
- EMA trend line.
- ATR upper and lower bands.
- Optional buy/sell arrows.
- Optional popup alerts.
- Input validation.
- Lightweight indicator structure.
Long Form Sales Description
VP ATR Trend Bands was created for traders who want a clean, practical, and visually clear way to understand trend and volatility on the chart. Many traders use moving averages because they are easy to read, but a moving average alone does not show whether the market is quiet, expanding, or moving with unusual strength. The addition of ATR bands helps place the moving average in a volatility context.
When price is moving normally, it often remains near the central trend area. When volatility expands, price may push outside the band area. These moments can be important because they may show where momentum is increasing or where the market is leaving a previous balance zone. The indicator highlights these conditions visually without making the chart overly complicated.
The central EMA gives a smooth directional reference. The ATR bands create an adaptive boundary around that reference. The arrows identify first breakout events according to the selected settings. Together, these features create a compact and readable tool that can support many different trading approaches.
A trader may use the indicator for trend continuation setups, breakout confirmation, pullback analysis, or volatility awareness. For example, if price is above the EMA and breaks above the upper band, the trader may inspect the chart for bullish continuation. If price is below the EMA and breaks below the lower band, the trader may inspect the chart for bearish continuation. If price keeps crossing the EMA and triggering mixed conditions, the trader may decide the market is too choppy and avoid trading.
The indicator is especially useful for users who want visual clarity. It does not overload the chart with complex panels, dashboards, or excessive labels. It focuses on the most important information: trend line, upper volatility boundary, lower volatility boundary, and breakout markers.
Because it does not trade automatically, the user remains in control. This is important for traders who prefer to make their own decisions instead of relying on a black-box system. The indicator gives information. The trader decides how to use that information.
VP ATR Trend Bands can also be useful for strategy development. A user can test different combinations of EMA period, ATR period, and ATR multiplier to see how the bands respond to different instruments and timeframes. A scalper may prefer faster settings. A swing trader may prefer slower settings. A conservative user may prefer wider bands and fewer signals. An aggressive user may prefer tighter bands and more frequent signals.
The indicator is also suitable for educational purposes. It helps demonstrate the difference between trend and volatility. A market can be above a moving average but still lack strong volatility expansion. A market can touch a band without continuing. A market can break a band during a strong move and then quickly reverse. Observing these patterns helps traders understand that no indicator should be used without context.
For best results, use VP ATR Trend Bands with a structured process. Do not enter trades only because an arrow appears. Instead, ask useful questions: Is the market trending? Is the breakout aligned with higher timeframe direction? Is there enough room before major support or resistance? Is the spread acceptable? Is there important news nearby? Does the setup offer a reasonable risk-to-reward ratio? Does the trade match the written plan?
This professional approach is much more effective than treating any indicator as a magic signal generator. VP ATR Trend Bands is designed to support this kind of disciplined chart analysis.
Main Product Description
VP ATR Trend Bands is a professional MetaTrader 5 indicator that combines two widely used technical concepts: trend smoothing and volatility measurement. The central line is based on an Exponential Moving Average, while the upper and lower bands are calculated with the Average True Range. Together, these elements create a practical visual channel that adapts to market movement.
The purpose of the indicator is not to predict the future or replace a complete trading plan. Its purpose is to make the current chart environment easier to read. When price moves above the upper ATR band, the market may be showing strong bullish pressure or a volatility breakout. When price moves below the lower ATR band, the market may be showing strong bearish pressure or downside volatility expansion. When price stays near the middle trend line, the market may be consolidating, correcting, or moving in a more balanced condition.
VP ATR Trend Bands is intentionally simple. It does not open trades. It does not close trades. It does not use martingale, grid, hedging, recovery logic, account access, DLL calls, file operations, or external web requests. It is a chart-based technical indicator designed to support decision-making, not to make decisions automatically.
This makes the indicator suitable for traders who prefer manual analysis, discretionary confirmation, strategy building, education, chart review, and visual backtesting. It can be used on Forex, indices, commodities, metals, crypto CFDs, stocks, and any other symbol supported by the MetaTrader 5 terminal, provided that the broker offers enough price history for the selected timeframe.
Core Idea
The core idea of VP ATR Trend Bands is simple:
1. Use EMA to identify the active trend baseline.
2. Use ATR to estimate current market volatility.
3. Create upper and lower bands around the EMA.
4. Display visual breakout arrows when price closes beyond the bands.
5. Help the trader identify strong movement, volatility expansion, and possible trend continuation zones.
Many traders use moving averages to identify trend direction, but a moving average alone does not describe volatility. A market may move above or below an average simply because normal volatility expands. ATR helps solve this by measuring the recent average trading range. By adding and subtracting an ATR value from the EMA, the indicator creates an adaptive envelope around price.
When volatility increases, the bands widen. When volatility decreases, the bands contract. This allows the indicator to adjust visually to different market conditions instead of using fixed-distance bands that may be too narrow during volatile sessions or too wide during quiet sessions.
Indicator Components
1. Trend EMA
The Trend EMA is the main trend reference line. It is displayed as a smooth blue line. The default period is 50, but it can be adjusted according to the trader's style. A smaller EMA period makes the line more responsive. A larger EMA period makes the line smoother and slower.
2. Upper ATR Band
The upper band is calculated above the EMA using the ATR multiplier. It represents a volatility-adjusted upper boundary. When price closes above this band, the market may be showing strong bullish movement, momentum expansion, or a possible breakout condition.
3. Lower ATR Band
The lower band is calculated below the EMA using the ATR multiplier. It represents a volatility-adjusted lower boundary. When price closes below this band, the market may be showing strong bearish movement, downside expansion, or a possible bearish breakout condition.
4. Buy Signal Arrow
The optional buy arrow appears when price closes above the upper band after previously being at or below the upper band. This helps highlight the first breakout event instead of marking every candle that stays outside the band.
5. Sell Signal Arrow
The optional sell arrow appears when price closes below the lower band after previously being at or above the lower band. This helps identify the first downside breakout event after the market leaves the previous band zone.
Important: arrows are signals for visual analysis only. They are not financial advice and they should not be used as standalone entry instructions. Always confirm signals using your own trading method, risk rules, market context, and broker conditions.
Key Features
- Clean EMA and ATR band structure.
- Dynamic volatility bands that adapt to changing market range.
- Optional buy and sell arrows.
- Input validation for safer operation.
- Lightweight design for normal chart use.
- Works on MetaTrader 5.
- Designed as an indicator, not an Expert Advisor.
- Does not execute trades.
- Does not modify account positions.
- Does not use DLL imports.
- Does not use external web requests.
- Does not use file operations.
- Can be used on multiple symbols and timeframes.
- Useful for manual traders, strategy testers, educators, and analysts.
- Simple enough for beginners, flexible enough for experienced traders.
- Suitable for trend-following, breakout analysis, volatility observation, and chart review.
- Includes alert option for breakout signals.
- Built around common, transparent technical analysis concepts.
How the Indicator Works
The indicator first calculates an Exponential Moving Average using the selected applied price. It then calculates the Average True Range using the selected ATR period. The ATR value is multiplied by the ATR multiplier. The result is added to the EMA to form the upper band and subtracted from the EMA to form the lower band.
The calculation can be described conceptually as:
Trend Line = EMA(Applied Price, EMA Period)
Upper Band = Trend Line + ATR × Multiplier
Lower Band = Trend Line - ATR × Multiplier
A buy arrow is generated when the current candle closes above the upper band and the previous candle was not already above the upper band. A sell arrow is generated when the current candle closes below the lower band and the previous candle was not already below the lower band.
This approach highlights fresh band breakouts rather than continuously painting repeated arrows on every candle outside the band.
Why Use ATR Bands?
ATR is a popular volatility measurement tool because it focuses on the size of recent market movement. A fixed-distance channel does not adapt well to different volatility environments. A market may be quiet during one session and highly active during another. ATR-based bands help the channel expand and contract with changing conditions.
This makes VP ATR Trend Bands useful for observing when price is moving beyond its recent volatility envelope. A breakout beyond the upper or lower band may indicate increased momentum, a shift in behavior, or a trend continuation attempt. However, like every technical indicator, it can also produce false signals during choppy or unstable markets.
Suggested Use Cases
Trend Continuation Analysis
When price is above the EMA and breaks above the upper band, the market may be entering a stronger bullish phase. Traders can use this as one possible confirmation in a broader trend-following approach.
Bearish Continuation Analysis
When price is below the EMA and breaks below the lower band, the market may be entering a stronger bearish phase. Traders can use this as one possible confirmation in a broader bearish trend-following method.
Volatility Expansion Detection
The distance between the bands shows how volatility changes over time. Wider bands suggest larger recent ranges. Narrower bands suggest lower recent volatility.
Chart Filtering
The EMA line can be used as a general trend filter. Some traders may prefer long-only ideas when price is above the EMA and short-only ideas when price is below the EMA.
Breakout Confirmation
The arrows can highlight candles that close beyond the volatility envelope. This can help traders quickly find potential breakout moments during chart review.
Manual Strategy Building
The indicator can be combined with support and resistance, price action, session timing, market structure, higher timeframe bias, or other confirmation tools.
Educational Use
Because the indicator uses clear and familiar concepts, it can help new traders understand the relationship between trend, volatility, and breakout behavior.
Input Parameters
EMA Period
Default: 50
The EMA period controls the smoothness of the central trend line. Lower values make the line react faster to price. Higher values make it smoother and slower.
ATR Period
Default: 14
The ATR period controls how volatility is measured. Lower values make the ATR react faster to recent changes. Higher values smooth the ATR calculation.
ATR Multiplier
Default: 1.80
The ATR multiplier controls the distance between the EMA and the upper/lower bands. A lower multiplier creates tighter bands and more signals. A higher multiplier creates wider bands and fewer signals.
Applied Price
Default: Close
The price type used for the EMA calculation. Traders can choose Close, Open, High, Low, Median, Typical, Weighted, or other MetaTrader-supported applied prices.
Arrow Offset, Points
Default: 20
Controls the visual distance of arrows from the candle high or low. This is only a display setting and does not affect signal logic.
Show Arrows
Default: true
Turns buy and sell arrows on or off.
Enable Alerts
Default: false
Turns popup alerts on or off.
Alert on Current Bar
Default: false
If false, alerts are based on the closed candle. If true, alerts can trigger on the current forming candle. For most traders, closed-bar alerts are usually more stable because the current candle may change before it closes.
Recommended Starting Settings
The default settings are designed as a balanced starting point:
EMA Period: 50
ATR Period: 14
ATR Multiplier: 1.80
Applied Price: Close
Show Arrows: true
Alerts: false
Possible Adjustments
For faster signals:
- Use a smaller EMA period such as 20 or 34.
- Use a smaller ATR multiplier such as 1.2 to 1.5.
- Be aware that faster settings may increase false signals.
For smoother signals:
- Use a larger EMA period such as 100 or 200.
- Use a larger ATR multiplier such as 2.0 to 3.0.
- Be aware that smoother settings may generate fewer and later signals.
For scalping-style chart reading:
- Try shorter timeframes with conservative confirmation.
- Use signals only with spread, session, and volatility awareness.
- Avoid relying on one indicator alone.
For swing analysis:
- Try H1, H4, or Daily timeframes.
- Use higher timeframe direction as a filter.
- Combine with support/resistance or market structure.
Important Usage Notes
VP ATR Trend Bands is a technical analysis tool. It is not a trading system by itself. It does not guarantee accurate entries, profitable trades, or future results. It should be used together with a complete trading plan.
Markets can change quickly. A band breakout may continue strongly or reverse immediately. False breakouts are common, especially during news, low liquidity, abnormal spreads, and sideways conditions.
Always test the indicator on a demo account before using it in live trading. Review it across different symbols, timeframes, and market conditions. Adjust the settings to match your strategy and risk tolerance.
Trading carries risk. Past chart behavior does not guarantee future performance.
What This Indicator Does Not Do
- It does not open trades.
- It does not close trades.
- It does not manage stop loss or take profit.
- It does not calculate position size.
- It does not guarantee profit.
- It does not avoid all false signals.
- It does not predict news events.
- It does not replace risk management.
- It does not replace trader judgment.
Signal Interpretation
Buy Arrow
A buy arrow appears when price closes above the upper ATR band after not being above it on the previous bar. This may suggest bullish momentum expansion. It can be used as a possible alert to inspect the chart for long-side opportunities.
Sell Arrow
A sell arrow appears when price closes below the lower ATR band after not being below it on the previous bar. This may suggest bearish momentum expansion. It can be used as a possible alert to inspect the chart for short-side opportunities.
No Arrow
No arrow means there is no new breakout condition according to the current settings. Price may still be trending, ranging, or consolidating.
Band Width
Wide bands suggest higher recent volatility. Narrow bands suggest lower recent volatility. Sudden expansion may indicate a change in market behavior.
EMA Position
Price above the EMA may support a bullish bias. Price below the EMA may support a bearish bias. Price crossing back and forth around the EMA may suggest a ranging or uncertain condition.
Example Workflow for Manual Traders
1. Select your symbol and timeframe.
2. Apply VP ATR Trend Bands to the chart.
3. Start with default settings.
4. Identify the general direction using the EMA.
5. Observe whether bands are expanding or contracting.
6. Wait for a closed candle breakout beyond the upper or lower band.
7. Use the arrow only as a notification, not as an automatic entry.
8. Confirm with your own method, such as support/resistance, candle structure, session timing, volume, higher timeframe bias, or risk/reward.
9. Decide whether the setup fits your plan.
10. Manage risk according to your own rules.
Possible Combination Ideas
VP ATR Trend Bands can be combined with:
- Support and resistance.
- Trendlines.
- Market structure.
- Higher timeframe direction.
- Candlestick confirmation.
- Breakout and retest logic.
- Session filters.
- Volume indicators.
- Momentum oscillators.
- Risk/reward planning.
- Economic calendar awareness.
However, adding too many tools may create confusion. A simple chart with a clear process is often more useful than a crowded chart with many conflicting signals.
Who This Indicator Is For
VP ATR Trend Bands may be useful for:
- Manual traders who want a clean trend and volatility channel.
- Traders who like EMA-based trend reading.
- Traders who use ATR in their analysis.
- Traders who want breakout alerts without automatic trading.
- Traders who review charts visually.
- Traders who build their own systems.
- Traders who need a simple educational tool.
- Traders who prefer transparent logic instead of black-box indicators.
Who This Indicator Is Not For
This indicator may not be suitable for users who expect:
- Automatic trading.
- Guaranteed profit.
- Full money management.
- A complete trading robot.
- A signal service.
- A no-loss system.
- A news prediction tool.
- A replacement for learning and testing.
Installation
1. Download the product from the MQL5 Market.
2. Open MetaTrader 5.
3. Go to Navigator.
4. Find the indicator in the Market or purchased products section.
5. Attach it to a chart.
6. Adjust the inputs if needed.
7. Start with default settings and observe behavior on historical candles.
Recommended Testing Process
Before using any indicator in live conditions:
1. Test on a demo account.
2. Review historical signals.
3. Compare different timeframes.
4. Try different ATR multipliers.
5. Observe how it behaves during trending markets.
6. Observe how it behaves during ranging markets.
7. Check spread and session conditions.
8. Build written rules before making live decisions.
9. Use conservative risk management.
10. Do not rely on one signal alone.
FAQ
Does VP ATR Trend Bands trade automatically?
No. It is a custom indicator. It provides visual lines and optional arrows, but it does not open, close, or manage trades.
Does it repaint?
The indicator uses current chart data and standard MetaTrader indicator calculations. Arrows based on a closed candle are more stable. If alert-on-current-bar behavior is enabled, current candle conditions may change before the candle closes. For more conservative use, keep alerts based on closed candles.
Can I use it on any symbol?
It can be attached to any symbol supported by MetaTrader 5, as long as there is enough price history available. Different symbols have different volatility behavior, so settings may need adjustment.
Can I use it on any timeframe?
Yes, it can be used on multiple timeframes. Lower timeframes may produce more signals and more noise. Higher timeframes may produce fewer but often more stable signals.
Is it suitable for beginners?
Yes, the visual layout is simple. However, beginners should learn basic risk management and test the indicator on demo before using it with real funds.
Does it guarantee profit?
No. No indicator can guarantee profit. The market is uncertain, and trading involves risk.
What is the best setting?
There is no universal best setting. The default is a balanced starting point. Settings should be tested according to symbol, timeframe, trading style, and market conditions.
Why do bands become wider or narrower?
Bands are based on ATR. When recent price ranges increase, ATR increases and the bands widen. When recent ranges decrease, ATR decreases and the bands narrow.
Why do I get fewer arrows with a higher multiplier?
A higher ATR multiplier moves the bands farther from the EMA, so price needs a stronger move to break outside them.
Why do I get more arrows with a lower multiplier?
A lower ATR multiplier places the bands closer to the EMA, so price can break them more often.
Can I use it with Expert Advisors?
The indicator itself is designed for visual chart use. Advanced users may be able to read its buffers in custom tools, but any automation should be tested carefully.
Suggested Product Screenshots
Screenshot 1:
A clean chart showing the EMA line, upper band, lower band, and several breakout arrows.
Screenshot 2:
A trending market example where price moves above the upper band and continues in the trend direction.
Screenshot 3:
A sideways market example showing why confirmation and risk management are important.
Screenshot 4:
Input settings window showing EMA period, ATR period, multiplier, arrows, and alerts.
Screenshot 5:
A zoomed-in view of buy and sell arrow placement.
Suggested Short Marketing Text
Identify trend direction, volatility expansion, and breakout zones with a clean EMA + ATR band indicator for MetaTrader 5.
Alternative Short Description
VP ATR Trend Bands helps traders visualize an EMA trend baseline, adaptive ATR volatility bands, and optional breakout arrows directly on the chart.
Recommended Tags
ATR, EMA, Trend, Bands, Volatility, Breakout, Indicator, MetaTrader 5, MT5, Trend Following, Manual Trading, Technical Analysis
Risk Disclaimer
Trading financial markets involves risk. VP ATR Trend Bands is a technical analysis indicator and does not guarantee profits or eliminate losses. Signals may be false, delayed, or unsuitable for some market conditions. Always test on a demo account first and use proper risk management. The indicator is not financial advice and should not be used as the only basis for trading decisions.
Support Message Template
Thank you for using VP ATR Trend Bands. If you have questions, please describe your symbol, timeframe, broker server time, indicator settings, and attach a screenshot if possible. This information helps provide faster and more accurate support.
Update Notes Template
Version 1.00:
- Initial release.
- EMA trend line.
- ATR upper and lower bands.
- Optional buy/sell arrows.
- Optional popup alerts.
- Input validation.
- Lightweight indicator structure.
Long Form Sales Description
VP ATR Trend Bands was created for traders who want a clean, practical, and visually clear way to understand trend and volatility on the chart. Many traders use moving averages because they are easy to read, but a moving average alone does not show whether the market is quiet, expanding, or moving with unusual strength. The addition of ATR bands helps place the moving average in a volatility context.
When price is moving normally, it often remains near the central trend area. When volatility expands, price may push outside the band area. These moments can be important because they may show where momentum is increasing or where the market is leaving a previous balance zone. The indicator highlights these conditions visually without making the chart overly complicated.
The central EMA gives a smooth directional reference. The ATR bands create an adaptive boundary around that reference. The arrows identify first breakout events according to the selected settings. Together, these features create a compact and readable tool that can support many different trading approaches.
A trader may use the indicator for trend continuation setups, breakout confirmation, pullback analysis, or volatility awareness. For example, if price is above the EMA and breaks above the upper band, the trader may inspect the chart for bullish continuation. If price is below the EMA and breaks below the lower band, the trader may inspect the chart for bearish continuation. If price keeps crossing the EMA and triggering mixed conditions, the trader may decide the market is too choppy and avoid trading.
The indicator is especially useful for users who want visual clarity. It does not overload the chart with complex panels, dashboards, or excessive labels. It focuses on the most important information: trend line, upper volatility boundary, lower volatility boundary, and breakout markers.
Because it does not trade automatically, the user remains in control. This is important for traders who prefer to make their own decisions instead of relying on a black-box system. The indicator gives information. The trader decides how to use that information.
VP ATR Trend Bands can also be useful for strategy development. A user can test different combinations of EMA period, ATR period, and ATR multiplier to see how the bands respond to different instruments and timeframes. A scalper may prefer faster settings. A swing trader may prefer slower settings. A conservative user may prefer wider bands and fewer signals. An aggressive user may prefer tighter bands and more frequent signals.
The indicator is also suitable for educational purposes. It helps demonstrate the difference between trend and volatility. A market can be above a moving average but still lack strong volatility expansion. A market can touch a band without continuing. A market can break a band during a strong move and then quickly reverse. Observing these patterns helps traders understand that no indicator should be used without context.
For best results, use VP ATR Trend Bands with a structured process. Do not enter trades only because an arrow appears. Instead, ask useful questions: Is the market trending? Is the breakout aligned with higher timeframe direction? Is there enough room before major support or resistance? Is the spread acceptable? Is there important news nearby? Does the setup offer a reasonable risk-to-reward ratio? Does the trade match the written plan?
This professional approach is much more effective than treating any indicator as a magic signal generator. VP ATR Trend Bands is designed to support this kind of disciplined chart analysis.