Triangular energy bubble
- Indicadores
- Versão: 1.45
- Ativações: 5
# Triangle Volume Bubble Pro
### Main Force Bull/Short Volume × Order Flow Analysis × Gold M1 Dedicated
A main force volume analysis indicator for MT5, specifically designed for short-term traders of XAUUSD gold (1-minute chart).
Through three core algorithms—"Volume + Order Flow + Average Cost of Large Bull/Short Traders"—it instantly identifies the direction of major market players, helping traders understand more quickly:
* Is the main force accumulating or distributing?
* Are large bullish traders starting to dominate the market?
* Are bearish forces starting to weaken?
* Where are the average cost zones for large traders?
* Where are support and resistance levels likely to form?
* Should the current strategy be bullish or bearish?
---
## Why are average traders often stopped out?
Because you only see the "price".
But what truly drives the market are:
* Major player trading volume
* Large investor fund flows
* Imbalance between long and short orders
* Instantaneous market liquidity
The "Triangular Volume Bubble" chart directly visualizes this previously invisible information on the chart.
You no longer need to guess.
The chart will tell you directly what the major players are doing.
---
# Core Function Introduction
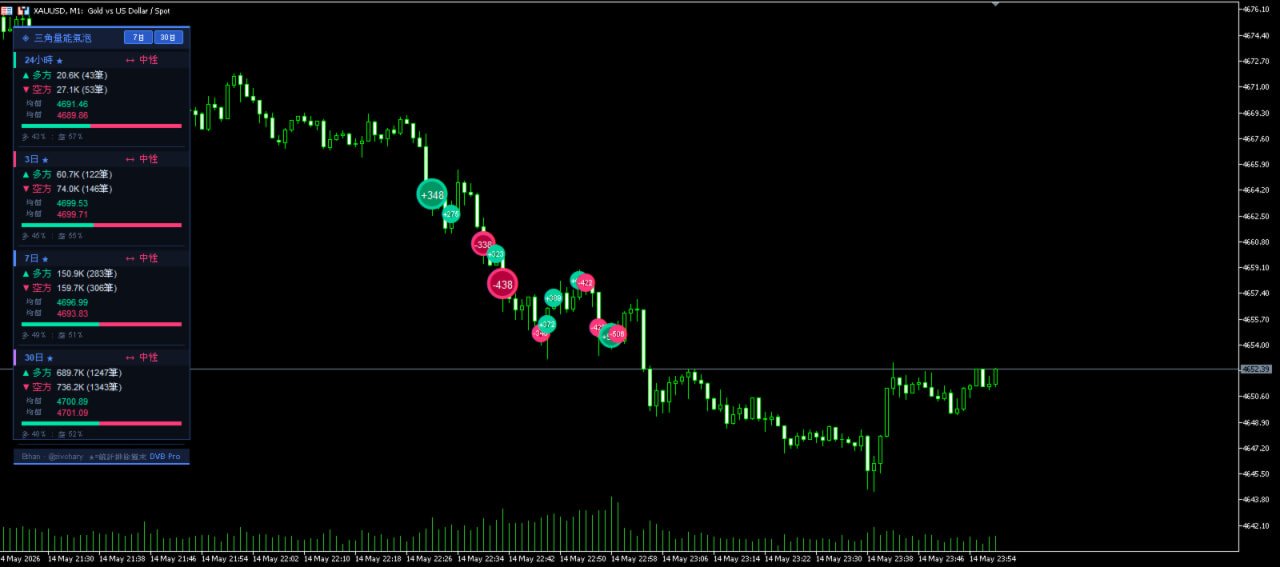
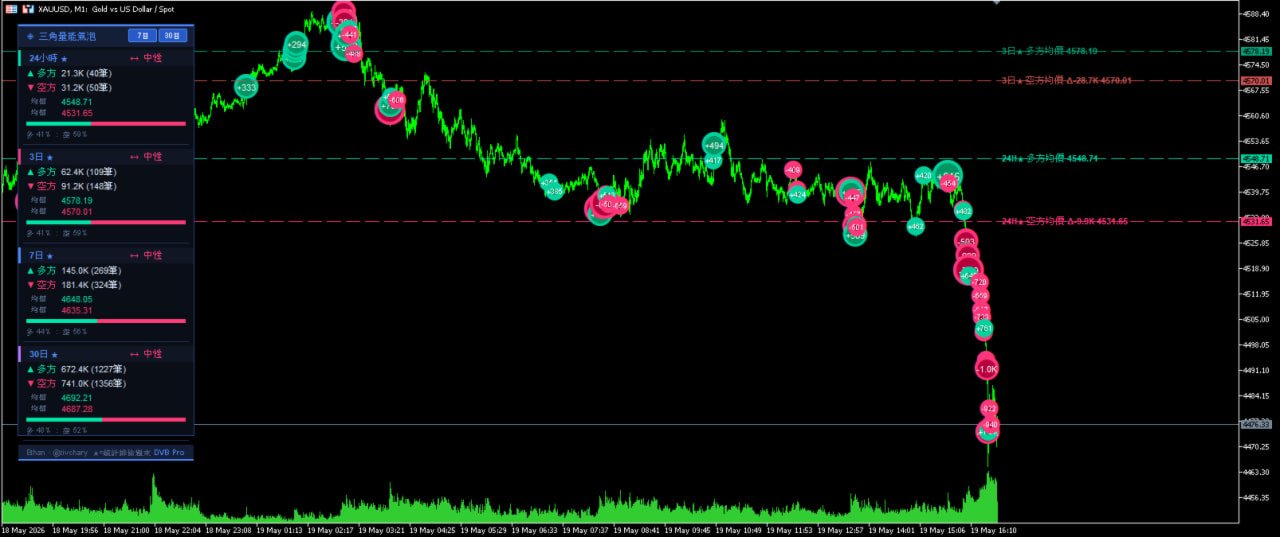
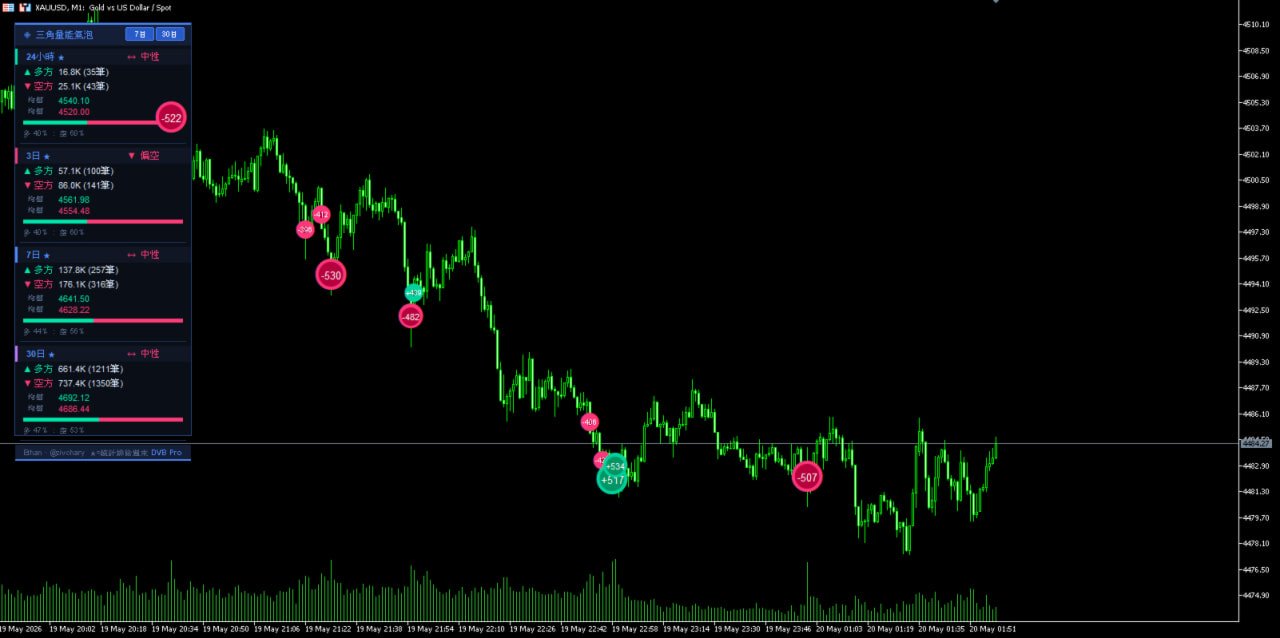
## ① Major Player Volume Bubble Detection
Through a special order flow algorithm, the trading volume of large investors in the market is displayed as "volume bubbles."
### Green Bubbles
Represent:
* Buying activity by major players
* Active buying by major players
* Increased buying volume
### Red Bubbles
Represent:
* Selling activity by major players
* Active selling by major players
* Increased selling volume
The larger the bubble, the more:
* Higher trading volume
* Stronger institutional funds
Higher market influence
You can see at a glance:
* Where major players are entering the market
* Where large investors are engaging in wash trading
* Where a trend is starting to emerge
---
# ② Average Cost Line of Major Buyers and Sellers
This is one of the most powerful core functions of this indicator.
The system will automatically calculate:
* Average transaction cost of major buyers
* Average transaction cost of major sellers
and display it on the chart as:
* Average cost line of buyers
* Average cost line of sellers
---
## Why is this important?
Because:
### Main Force Cost = True Market Defense Zone
When the price approaches:
* Long-side cost zone → Easy to find support and rebound
* Short-side cost zone → Easy to find resistance and decline
You're no longer just looking at moving averages.
What you see is:
> "The position where a large amount of capital is truly entering the market"
This is the real key to the market.
---
# ③ Judging the Main Force's Long/Short Advantage
The system will calculate in real time:
* Long-side main force trading volume
* Short-side main force trading volume
And automatically analyze: Which side currently holds the advantage.
---
## Example:
When:
* Long position volume > Short position volume
The system will determine:
✅ Bullish forces have the upper hand
✅ Inclined towards buying
✅ Pullbacks are likely to form support
Conversely:
* Short position volume > Long position volume
This means:
❌ Bearish forces are suppressing the market
❌ Inclined towards selling
❌ Rebounds are likely to be driven down by selling pressure
---
# ④ Multi-period volume overview
In addition to the current M1 chart,
the system will also simultaneously collect:
* 24-hour
* 3-day
* 7-day
* 30-day
Main force bullish and bearish volume data.
This allows you to see more than just short-term trends,
and grasp:
* Medium-term trend
* Main force direction
* Market sentiment changes
Avoid counter-trend trading.
---
# Gold M1 Optimized Indicator
This indicator is specifically designed for:
## XAUUSD Gold M1
with algorithm tuning.
Because the gold market:
* High volatility
* High liquidity
Frequent market manipulation by major players
General indicators are prone to:
* Delay
* False signals
* Stop-loss triggers
The Triangle Volume Bubble indicator specifically enhances:
✅ Real-time volume response
✅ Detection of abnormal trading activity by major players
✅ Short-term order flow analysis
✅ Rapid direction switching determination
Especially suitable for:
* Short-term gold trading
* Day trading
* Ultra-short-term scalping
* Identifying swing reversal points
---
# Which traders are suitable for?
This indicator is ideal for:
### ✔ Gold traders
### ✔ MT5 users
### ✔ Day traders
### ✔ SMC/ICT traders
### ✔ Order flow traders
### ✔ Naked candlestick chart traders
### ✔ Those who want to understand the direction of major players
---
# What will you gain?
After using the "Triangle Volume Bubble," you can:
✅ Determine market direction faster
✅ Understand whether major players are entering the market
✅ Avoid chasing the trend
✅ Find high-probability entry points
✅ Improve entry and exit quality
✅ Reduce ineffective trades
✅ Increase trading confidence
---
# Not a magic indicator, but an "information advantage"
Most people in the market look at:
* RSI
* MACD
* Moving averages
But what major players really look at is:
* Trading volume
* Liquidity
* Order flow
* Large investor costs
The "Triangle Volume Bubble" lays this information out directly for you.
When you start to see the major players, your trading mindset will be completely different.
---
# Product Features Summary
### 🔺 Triangle Volume Algorithm
Accurately identifies the buying and selling volume of major players.
### 🫧 Major Player Volume Bubble
Visual display of large investor transactions.
### 🎯 Average Cost Line for Both Long and Short Positions
Identify true support and resistance levels.
### 📊 Multi-Period Volume Analysis
Grasp the overall market trend.
### ⚡ Gold M1 Exclusive Optimization
Designed specifically for short-term trading.
---
# Understand the Main Force's Direction at a Glance
## Making Trading More Than Just Guessing.
### Triangle Volume Bubble Pro
#### You can now see what the main forces are doing.
This policy is in place to prevent misuse and is therefore limited to one year, at which time a new version upgrade will be provided. The policy expires on May 1, 2027.