Institutional Flow Detector Mt5
- Indicadores
- Versão: 1.0
- Ativações: 5

Institutional Flow Detector (IFD)
Stop reacting to price. Start reading the market the way institutions do.
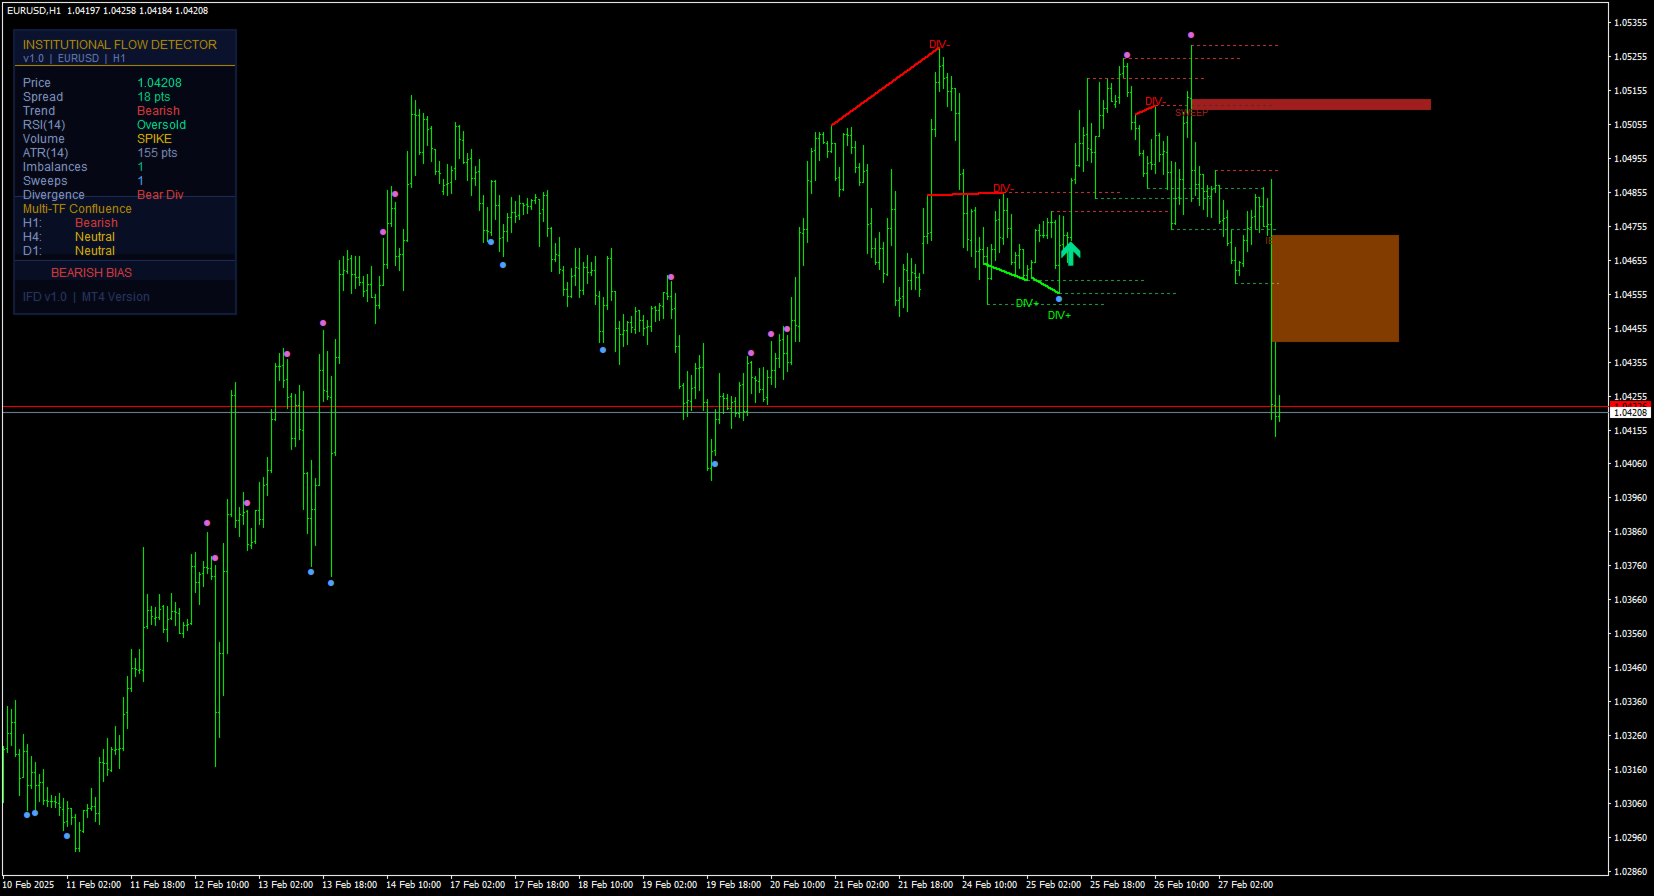
Institutional Flow Detector is a professional-grade Smart Money indicator that detects the structural footprints of institutional order flow and converts them into clear, scored Buy/Sell arrows on your chart. Five independent detection modules score their alignment in real time — and a four-layer filter system ensures that only high-probability, trend-aligned setups ever produce a signal.
Every arrow is evaluated on a closed bar. Nothing repaints.
Why IFD Is Different
Most retail indicators tell you what price already did. IFD tells you why it moved — by tracking the mechanisms that institutional participants use to accumulate and distribute positions.
Large players systematically hunt stop-losses clustered beyond swing highs and lows, absorb orders inside price imbalances, and leave measurable volume signatures behind. IFD detects all five of these footprints simultaneously, weights their confluence into a transparent score, and filters out counter-trend noise before painting an arrow.
The Five Detection Modules
🔵 Liquidity Sweep Detection
Scans recent swing highs and lows, then identifies candles where price pierced a structural level and closed back inside — the classic institutional stop-hunt. Every confirmed sweep is marked with a zone at the swept price level. A sweep near your signal adds +2 to the confluence score.
🟩 Imbalance Zones (Fair Value Gaps)
Detects unfilled three-candle price gaps left by impulsive institutional moves. Open zones are drawn as semi-transparent rectangles and automatically removed when price fills them. Being near an active FVG adds +2 to the score.
📊 Volume Delta Analysis
Maintains a rolling volume moving average. Bars where volume exceeds the average by a configurable multiplier are flagged as high-participation events. Volume spikes add +1 to the score and can be set as a hard requirement.
📉 RSI Divergence
Finds classic bullish and bearish divergence between price pivots and RSI. Confirmed divergences are drawn as dashed trendlines labeled DIV+ / DIV–. Active divergence adds +2 to the score.
🔀 Multi-Timeframe Confluence
Reads EMA alignment and price position on three separate timeframes simultaneously. Each aligned timeframe contributes +1 to the score, for a maximum of +3 from this module alone.
Input Parameters
Signal Settings
| Parameter | Default | Description |
|---|---|---|
| Sweep Lookback | 20 bars | Bars scanned to identify swing highs and lows |
| Sweep Penetration | 0.3× ATR | Minimum wick depth past the swing level |
| Imbalance Min Size | 0.5× ATR | Smallest qualifying Fair Value Gap |
| Auto-Fill Zones | On | Remove imbalance zones when price fills them |
| Volume Lookback | 14 bars | Rolling window for the volume moving average |
| Volume Spike × | 1.5 | Multiplier above MA to classify a volume spike |
| RSI Period | 14 | Period for RSI used in divergence detection |
| Divergence Lookback | 30 bars | Bars scanned for divergence pivot pairs |
| MTF TF1 / TF2 / TF3 | H1 / H4 / D1 | Three timeframes for confluence scoring |
| EMA Fast / Slow | 20 / 50 | EMA periods applied on current and all MTF charts |
| Min Score | 10 | Confluence threshold to paint a signal arrow (max 15) |
| Require Sweep | Off | Hard filter: block signals without a prior sweep |
| Require Volume | Off | Hard filter: block signals without a volume spike |
Trend Filter Settings
| Parameter | Default | Description |
|---|---|---|
| HTF Trend Filter | On | Enable counter-trend signal blocker |
| HTF Timeframe | D1 | Timeframe used for trend direction check |
| HTF EMA Period | 50 | EMA period on the higher timeframe |
| ADX Filter | On | Enable ranging-market signal blocker |
| ADX Period | 14 | ADX calculation period |
| ADX Minimum Level | 20.0 | Signals blocked when ADX is below this value |
| Body Filter | On | Enable minimum candle body size requirement |
| Body Min (ATR ×) | 0.20 | Minimum body as a proportion of ATR |
| Cooldown Filter | On | Enable same-direction signal cooldown |
| Cooldown Bars | 5 | Minimum bars between same-direction arrows |
Alert Settings
| Parameter | Default | Description |
|---|---|---|
| Alert Popup | On | Pop-up dialog on signal arrow |
| Alert Email | Off | Email on signal arrow |
| Alert Push | Off | Mobile push notification on signal arrow |
| Alert Once Per Bar | On | Suppress duplicate alerts on the same bar |
| Detailed Message | On | List all triggered factors in the alert text |
| Alert On Pattern | On | Notify when a candle pattern is detected |
| Alert On Divergence | On | Notify when a divergence trendline is drawn |
| Alert On Sweep | On | Notify when a liquidity sweep is confirmed |
| Alert On Zone Retest | On | Notify when price re-enters an active FVG zone |