Trading Time Window

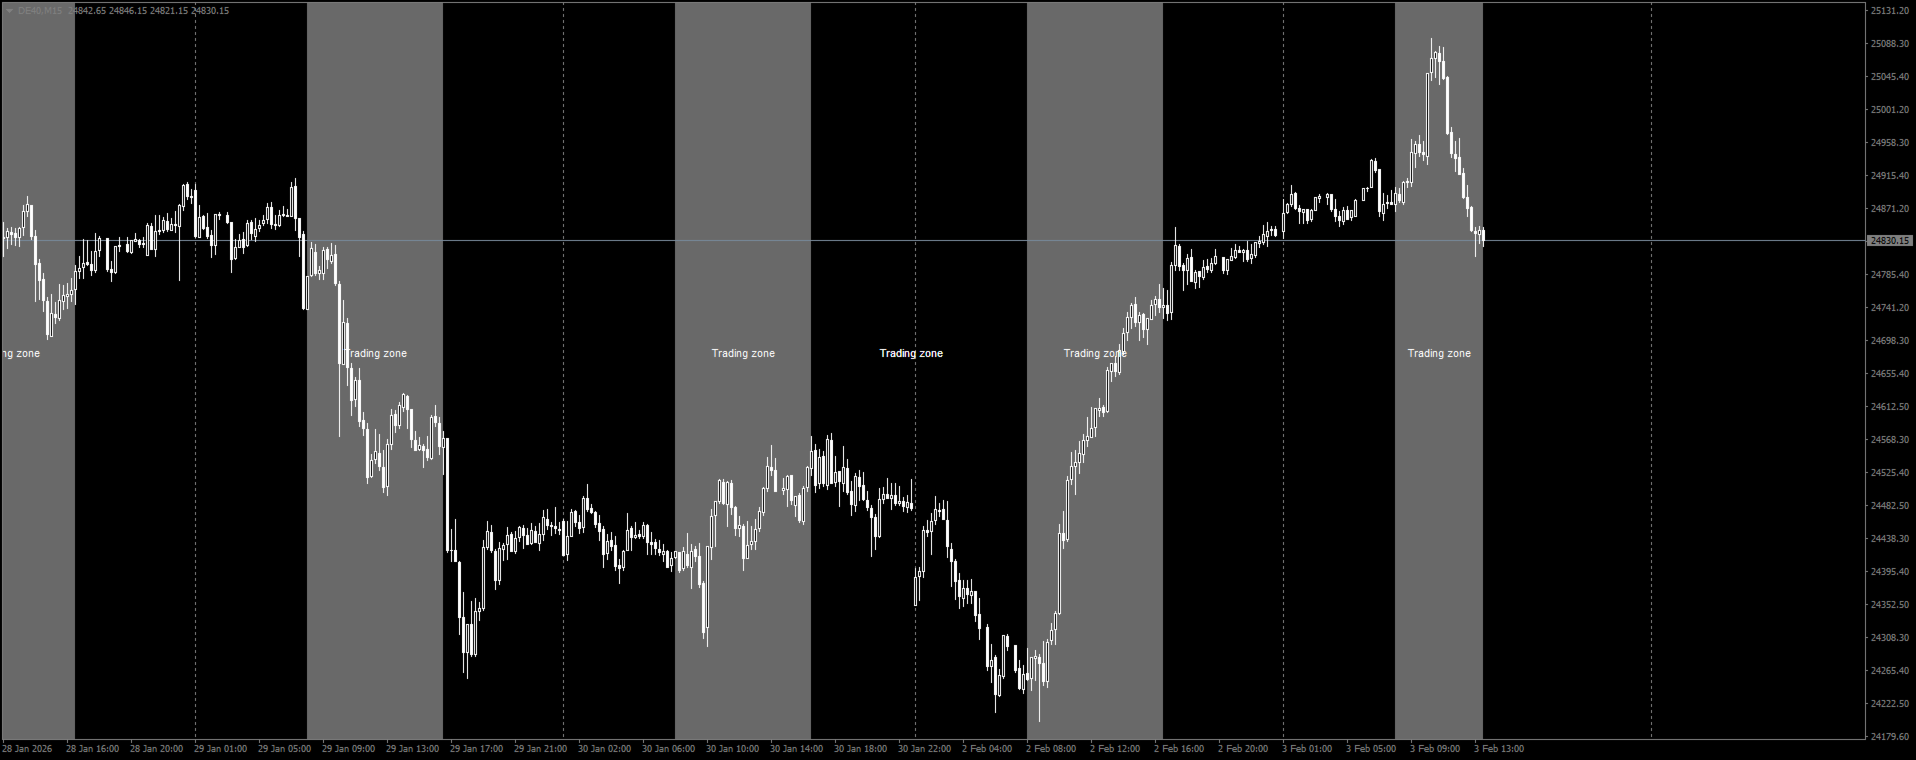
Trading Window Rectangle Visualizes your custom daily trading time window directly on the chart as a clean rectangle frame.

Key features:

  • Marks any user-defined session (e.g. London, NY morning, your personal strategy hours)
  • Draws rectangle for the selected time range each day
  • Shows unfinished rectangle for the current day in real time
  • Draws historical windows for the last N days (adjustable)
  • Minimalist & non-intrusive — rectangle stays in background

Perfect for:

  • Session-based traders
  • Time-filtered strategies
  • Avoiding low-liquidity hours
  • Quick visual reference of active trading periods

Settings:

  • Start & End time (HH:MM)
  • Show/hide label + custom text
  • Number of days back to display
  • Rectangle color 

Lightweight, no repainting, works on any timeframe and symbol.


Produtos recomendados
Pin Bars
Yury Emeliyanov
5 (4)
Objectivo principal: "Pin Bars" destina-se a detectar automaticamente barras de pinos nos gráficos dos mercados financeiros. Uma barra de pinos é uma vela com um corpo característico e uma cauda longa, que pode sinalizar uma reversão ou correção de tendência. Como funciona: o indicador analisa cada vela no gráfico, determinando o tamanho do corpo, cauda e nariz da vela. Quando uma barra de pinos correspondente a parâmetros predefinidos é detectada, o indicador marca-a no gráfico com uma seta p
FREE
Basic Harmonic Pattern
Mehran Sepah Mansoor
4.58 (59)
Este indicador identifica os padrões harmónicos mais populares que prevêem os pontos de inversão do mercado. Estes padrões harmónicos são formações de preços que se repetem constantemente no mercado forex e sugerem possíveis movimentos de preços futuros / Versão MT5 gratuita Além disso, este indicador tem um sinal de entrada no mercado incorporado, bem como vários take profits e stop losses. Deve-se notar que, embora o indicador de padrão harmónico possa fornecer sinais de compra / venda por s
FREE
Improved Fractals
Denis Glaz
4.5 (2)
This is a modified Fractals indicator. It works similar the original Bill Williams' indicator, and is additionally enhanced with the possibility to change the top radius, in contrast to the standard radius of 2 bar. Simply put, the indicator checks the top and if it is the minimum/maximum in this radius, such a top is marked by an arrow. Advantages Adjustable radius. Use for drawing support and resistance levels. Use for drawing trend channels. Use within the classical Bill Williams' strategy or
FREE
The Support & Resistance Breakout Indicator with Smart Alerts a utomatically identifies key support and resistance levels using fractal detection, and receive instant breakout signals enhanced by RSI/CCI confirmation filters. This versatile tool includes   push notifications, email alerts, pop-up alerts, and sound alerts  so you never miss a trading opportunity. Key Features: Dynamic Level Detection  – Draws real-time support and resistance based on market fractals. Breakout Arrows  – Clear vis
FREE
Wise Men Indicator demo
Bohdan Kasyanenko
3 (2)
The indicator displays signals according to the strategy of Bill Williams on the chart. Demo version of the indicator has the same features as the paid, except that it can work only on a demo account . Signal "First Wise Man" is formed when there is a divergent bar with angulation.  Bullish divergent bar - with lower minimum and closing price in the upper half. Bearish divergent bar - higher maximum and the closing price at the bottom half. Angulation is formed when all three lines of Alligator
FREE
ST Engulfing
Curtis Daniel Jr -
Engulfing candlestick patterns are   comprised of two bars on a price chart. They are used to indicate a market reversal. The second candlestick will be much larger than the first, so that it completely covers or 'engulfs' the length of the previous bar. By combining this with the ability to look at trend direction this indicator eliminates a lot of false signals that are normally generated if no overall trend is taken into consideration
FREE
Necessary for traders: tools and indicators Waves automatically calculate indicators, channel trend trading Perfect trend-wave automatic calculation channel calculation , MT4 Perfect trend-wave automatic calculation channel calculation , MT5 Local Trading copying Easy And Fast Copy , MT4 Easy And Fast Copy , MT5 Local Trading copying For DEMO Easy And Fast Copy , MT4 DEMO Easy And Fast Copy , MT5 DEMO The homeopathic indicator is also called the CCI indicator. The CCI indicator was proposed
FREE
Добрый День, всем привет, здравствуйте. Я. трейдер, 20 лет опыта, Вадим Сергеевич Лепехо. Создал этот индикатор на базе уже готового стрелочного индикатора (arrrows_template). Решил с вами поделиться  с наработками. Данный индикатор рисует стрелки по стратегии: "Тринитти". Индикатор выдает сигнал на вход когда rsi ниже 50; AO ниже 0; и Price ниже MA9-ход делаем вниз.  Индикатор выдает сигнал на вход когда rsi выше 50; AO выше 0; и Price выше MA9-ход делаем вверх. Предлагаю на демо-счете протести
FREE
RSI Extreme Zone
Alexander Chertnik
4.4 (5)
The indicator highlights the value in "over Sold" and "over Bought" zones. in addition, arrow indicates the return of the value from the extreme zone. Indicator can be easily customized by the user including change of colors, with, levels and arrows. Combination with other market signals and analysis is necessary and provides more stable results. Alert is also available for user.
FREE
ReviewCandleChart is a unique product that can verify past price fluctuations using candlestick charts. This indicator accurately reproduces market price fluctuations in the past and can make trading decisions (entries, profits, loss cut) many times so that you can learn the trading faster. ReviewCandleCahrt is the best indicator to improve trading skills. ReviewCandleCahrt caters to both beginners and advanced traders. Advantages of the indicator This Indicator for verifying price fluctuation
FREE
Chart Time
Isaac Montesinos Valdes
5 (1)
Chart Time Indicator is very simple and easy, but it can be very important to control the time before opening any manual trade. This indicator shows the time on the chart between 3 different options. Input parameters Show Time : Select all the time options that you want to see. Local Time (Personal Computer Time), Server Time (Broker Time) or GMT Time. Recommendations: Use only one Chart Time Indicator for each chart.
FREE
CandleStick Countdown – Indicador de Contagem Regressiva do Tempo Restante da Vela CandleStick Countdown é um indicador simples e prático para MT4 que exibe uma contagem regressiva em tempo real de quantos minutos e segundos faltam para o fechamento da vela atual. Ajuda a melhorar a precisão no timing das operações e é amplamente utilizado por traders. Principais Funções Exibe o tempo restante da vela atual no formato “minutos:segundos” Exibido como texto no gráfico para alta visibilidade Posiçã
FREE
PZ Three Drives
PZ TRADING SLU
5 (2)
This indicator finds Three Drives patterns. The Three Drives pattern is a 6-point reversal pattern characterised by a series of higher highs or lower lows that complete at a 127% or 161.8% Fibonacci extension. It signals that the market is exhausted and a reversal can happen. [ Installation Guide | Update Guide | Troubleshooting | FAQ | All Products  |  Get Help ] Customizable pattern sizes Customizable colors and sizes Customizable breakout periods Customizable 1-2-3 and 0-A-B ratios It impl
FREE
Heiken Ashi Button
Lee Teik Hong
4.75 (4)
Heiken Ashi Button Heiken-Ashi , often spelled Heikin-Ashi, is a Japanese word that means "Average Bar." The Heiken-Ashi approach can be used in conjunction with candlestick charts to spot market trends and forecast future prices. It's useful for making candlestick charts easier to read and analysing patterns. Traders can use Heiken-Ashi charts to determine when to stay in trades while the trend continues and close trades when the trend reverses. The majority of earnings are made when markets a
FREE
Candle GAP
Thushara Dissanayake
3 (1)
O indicador   Candle GAP   é uma ferramenta essencial para os traders que utilizam   Gap Trading Strategies   , pois identifica automaticamente os gaps das velas para cada dia da semana. Uma lacuna refere-se a uma diferença de nível de preço entre o fechamento e a abertura de dois dias consecutivos. Este indicador reconhece quatro tipos de padrões de gap: Comum, Breakaway, Continuação e Exaustão. Ao incorporar este indicador em qualquer gráfico, os traders podem validar seus sinais e aprimorar s
FREE
Show Pips
Roman Podpora
4.26 (58)
Este indicador de informação será útil para quem quer estar sempre atento à situação atual da conta. O indicador exibe dados como lucro em pontos, porcentagem e moeda, bem como o spread do par atual e o tempo até o fechamento da barra no período atual. VERSÃO MT5 -   Indicadores mais úteis Existem várias opções para colocar a linha de informação no gráfico: À direita do preço (corre atrás do preço); Como comentário (no canto superior esquerdo do gráfico); No canto selecionado da tela. Também é
FREE
Fractal Divergence Channel is based on the fractal divergence patterns , representing them in the form of a channel with the borders changing the moment the next pattern appears. The upper border of the channel corresponds to the upper part of the last found bearish fractal divergence pattern. The lower border of the channel is the lower part of the last found bullish pattern (see screenshot 1). Compared to the FractalDivergence_Patterns indicator, the channel version has the same parameters wit
FREE
QuantumAlert Stoch Navigator is a free indicator available for MT4/MT5 platforms, its work is to provide "alerts" when the market is inside "overbought and oversold" regions in the form of "buy or sell" signals. This indicator comes with many customization options mentioned in the parameter section below, user can customise these parameters as needful. Join our   MQL5 group , where we share important news and updates. You are also welcome to join our private channel as well, contact me for the p
FREE
Extremum Reverse Bar
Yurij Izyumov
2.8 (5)
This indicator has been created for finding the probable reversal points of the symbol price. A small candlestick reversal pattern is used it its operation in conjunction with a filter of extremums. The indicator is not redrawn! If the extremum filter is disabled, the indicator shows all points that have a pattern. If the extremum filter is enabled, the condition works – if the history Previous bars 1 candles back contains higher candles and they are farther than the Previous bars 2 candle, such
FREE
The free version of the Hi Low Last Day MT4 indicator . The Hi Low Levels Last Day MT4 indicator shows the high and low of the last trading day . The ability to change the color of the lines is available . Try the full version of the Hi Low Last Day MT4 indicator , in which additional indicator features are available : Displaying the minimum and maximum of the second last day Displaying the minimum and maximum of the previous week Sound alert when crossing max . and min . levels Selecting an arb
FREE
Nós paramos de criar ferramentas pequenas para o MT4. Nosso foco é o MT5. Somente ferramentas realmente úteis serão desenvolvidas para o MT4. New Candle Alert é um simples indicador que notifica você quando uma nova vela é formada. Você pode especificar a mensagem de notificação que irá aparecer para você. Versão para MT5:  https://www.mql5.com/pt/market/product/37986 Espero que goste. Qualquer dúvida ou sugestão por favor notifique no privado ou nos comentários.
FREE
The indicator allows you to trade binary options. The recommended time frame is М1 and the expiration time is 1 minute. The indicator suitable for auto and manual trading. A possible signal is specified as a arrows above/under a candle. You should wait until the candle closes! Arrows are not re-painted Trade sessions: LONDON and NEWYORK section Currency pairs: GRB/USD Working time frame: M1 Expiration time: 1 minute. The indicator also shows good results when using the martingale strategy - "Mar
FREE
MASi Three Screens
Aleksey Terentev
5 (2)
MASi Three Screens is based on the trading strategy by Dr. Alexander Elder. This indicator is a collection of algorithms. Algorithms are based on the analysis of charts of several timeframes. You can apply any of the provided algorithms. List of versions of algorithms:     ThreeScreens v1.0 - A simple implementation, with analysis of the MACD line;     ThreeScreens v1.1 - A simple implementation, with analysis of the MACD histogram;     ThreeScreens v1.2 - Combines the first two algorithms in
FREE
Free automatic Fibonacci is an indicator that automatically plots a Fibonacci retracement based on the number of bars you select on the BarsToScan setting in the indicator. The Fibonacci is automatically updated in real time as new highest and lowest values appears amongst the selected bars. You can select which level values to be displayed in the indicator settings. You can also select the color of the levels thus enabling the trader to be able to attach the indicator several times with differe
FREE
IMP The Panel presents a number of indicators in abbreviated form: 2 oscillators, 2 trend and 1 volume indicator. Location -  upper left corner. Indicators values and colors can be customized by the user. Combined with other market analysis, can greatly improve trading results. This Indicator is a suitable tool for beginners and professional traders as one. Metta Trader 4 Indicator Version _1.0
FREE
FTU Fibonacci Este indicador desenha níveis de Fibonacci para sistemas de entrada do tipo retração ** assista ao vídeo para sugestão de estratégia Características: Vários níveis de Fibonacci ajustáveis Altere a cor e a quantidade de barras do intervalo 2 linhas para 50 barras antes da retração de alta-baixa e 2 linhas para 20 barras As linhas estão mostrando 38 e 61 níveis de Fibonacci Uso: O objetivo é estudar ou medir a retração de preço Altere a cor e a quantidade de barras do intervalo. Use
FREE
This indicator allows to hide Parabolic SAR (on all MT4 timeframes) from a date define by the user, with a vertical line (Alone) or a panel (with "Hidden Candles"). Indicator Inputs: Step Maximum  Color Width Information on "Parabolic SAR" indicator is available here:   https://www.metatrader4.com/en/trading-platform/help/analytics/tech_indicators/parabolic ************************************************************* Hey traders!!  Give me your feeds!  We are a community here and we have the sa
FREE
Railway Tracks Pattern — Reversal Pattern Indicator Railway Tracks Pattern is an indicator that automatically detects a powerful two-candle reversal pattern on the chart. It looks for two candles with opposite directions (bullish and bearish), similar in size, and with minimal wicks — a clear sign of momentum shift. How it works: The first candle is strong and directional. The second candle moves in the opposite direction and is of similar size. Both candles have small shadows (wicks). The
FREE
Ppr PA
Yury Emeliyanov
4.67 (3)
"Ppr PA" is a unique technical indicator created to identify "PPR" patterns on the currency charts of the MT4 trading platform. These patterns can indicate possible reversals or continuation of the trend, providing traders with valuable signals to enter the market. Features: Automatic PPR Detection:   The indicator automatically identifies and marks PPR patterns with arrows on the chart. Visual Signals:   Green and red arrows indicate the optimal points for buying and selling, respectively. Ar
FREE
PPR and Engulfing
Yury Emeliyanov
5 (2)
PPR e Engulfing é um indicador técnico único projetado para identificar os padrões "PPR" e "Engulfing" nos gráficos de moedas na plataforma de negociação MetaTrader 4 (MT4). Esses padrões podem indicar possíveis reversões ou continuações de tendência, fornecendo aos traders sinais valiosos para entrar e sair do mercado. Características principais: Detecção automática de padrões : O indicador identifica e marca automaticamente os padrões PPR e Engulfing com setas no gráfico. Sinais visuais : Seta
FREE
Os compradores deste produto também adquirem
Scalper Inside PRO
Alexey Minkov
4.74 (69)
Scalper Inside PRO – Since 2020. An exclusive indicator that utilizes an innovative algorithm to swiftly and accurately determine the market trend. The indicator automatically calculates opening, closing, and profit levels, providing detailed trading statistics. With these features, you can choose the most appropriate trading instrument for the current market conditions. Additionally, you can easily integrate your own arrow indicators into Scalper Inside Pro to quickly evaluate their statistics
Gann Made Easy
Oleg Rodin
4.83 (162)
Gann Made Easy é um sistema de negociação Forex profissional e fácil de usar, baseado nos melhores princípios de negociação usando a teoria do sr. W. D. Gann. O indicador fornece sinais precisos de COMPRA e VENDA, incluindo níveis de Stop Loss e Take Profit. Você pode negociar mesmo em movimento usando notificações PUSH. Entre em contato comigo após a compra para receber instruções de negociação e ótimos indicadores extras gratuitamente! Provavelmente você já ouviu muitas vezes sobre os métodos
M1 Sniper
Oleg Rodin
5 (22)
O M1 SNIPER é um sistema indicador de negociação fácil de usar. É um indicador de seta projetado para o período M1. O indicador pode ser usado como um sistema independente para scalping no período M1 e pode ser usado como parte do seu sistema de negociação existente. Embora este sistema de negociação tenha sido projetado especificamente para negociação no M1, ele também pode ser usado em outros períodos. Originalmente, desenvolvi este método para negociar XAUUSD e BTCUSD. Mas considero-o útil ta
Sinal de tendência GoldRush Arrow O indicador Sinal de tendência GoldRush Arrow fornece uma análise precisa e em tempo real das tendências, adaptada para scalpers de alta velocidade e curto prazo em XAU/USD. Criada especificamente para o intervalo de tempo de 1 minuto, esta ferramenta exibe setas direcionais para pontos de entrada claros, permitindo que os scalpers naveguem em condições de mercado voláteis com confiança. O indicador consiste em setas de alerta PRIMÁRIAS e SECUNDÁRIAS. Os sin
O sistema PRO Renko é um sistema de negociação altamente preciso especialmente concebido para a negociação de gráficos RENKO. Trata-se de um sistema universal que pode ser aplicado a vários instrumentos de negociação. O sistema neutraliza eficazmente o chamado ruído de mercado, dando-lhe acesso a sinais de inversão precisos. O indicador é muito fácil de usar e tem apenas um parâmetro responsável pela geração de sinal. Você pode facilmente adaptar a ferramenta a qualquer instrumento de negocia
Market Makers
Mohamed Hassan
5 (4)
After purchase, contact me privately to receive 1 month of free testing with EA Forex Proton! This advanced MT4 trading robot automatically executes signals from any MT4 indicator, including Market Makers. The latest version also includes AI integration, allowing each trade signal to be analyzed using Artificial Intelligence. Live Signal with EA Forex Proton: Click here Market Makers is a powerful price action trading system designed to identify high-probability Buy and Sell opportunities based
KuKl
IGOR KIRIANEN
The indicator is built on a non-standard Zig Zag, it draws accumulations after which if the price leaves this zone and a test of this zone occurs, then a sound signal is given and an arrow appears - after the test candle closes.The indicator does not redraw its signals, it is very easy to use, there are only three settings 1- this is the zig zag parameter 2- this is the minimum price exit from the zone 3- this is the maximum price exit from the zone. The lower the parameter for Zig Zag, the more
Advanced Supply Demand
Bernhard Schweigert
4.91 (300)
Atualmente com 40% de desconto! A melhor solução para qualquer Trader Novato ou especialista! Este indicador é uma ferramenta de negociação exclusiva, de alta qualidade e acessível porque incorporamos uma série de recursos proprietários e uma nova fórmula. Com esta atualização, você poderá mostrar fusos horários duplos. Você não só será capaz de mostrar um TF mais alto, mas também mostrar ambos, o TF do gráfico, MAIS o TF mais alto: MOSTRANDO ZONAS ANINHADAS. Todos os traders de Oferta e Demanda
Um indicador técnico que estrutura gráficos e identifica movimentos cíclicos de preços. Pode funcionar em qualquer gráfico. Vários tipos de notificações. Existem setas adicionais no próprio gráfico. Sem redesenhar a história, trabalha no fecho da vela. TF recomendado a partir de M5 e superior. Parâmetros fáceis de utilizar e configurar. Ao utilizar 2 indicadores com parâmetros diferentes, pode utilizá-los sem outros indicadores. Tem 2 parâmetros de entrada Ciclicidade e duração do sinal Estes
NAM Divergences
NAM TECH GROUP, CORP.
5 (1)
Indicador de detecção MT4 Multi-timeframe Divergence e Overbougt / Oversold. Características - Totalmente personalizável no painel de controle do gráfico, fornece interação completa. - Oculte e mostre o painel de controle onde quiser. - Informação em tempo real sobre divergências não capitalizadas. - Informações em tempo real sobre situações de sobrecompra / sobrevenda. - Informações em tempo real sobre divergências regulares. - Informações em tempo real sobre divergências ocultas. -
ACTUALMENTE 40% DE DESCONTO!! A melhor solução para qualquer novato ou comerciante especializado! Este indicador é uma ferramenta comercial única, de alta qualidade e acessível, porque incorporámos uma série de características proprietárias e uma fórmula secreta. Com apenas UM gráfico, dá alertas para todos os 28 pares de moedas. Imagine como a sua negociação irá melhorar porque é capaz de identificar o ponto exacto de desencadeamento de uma nova tendência ou oportunidade de escalada! Constr
Auto Optimized Parabolic RSI: Avançado Motor de Momentum 3D A maioria dos indicadores de varejo falha porque depende de parâmetros estáticos que quebram no momento em que a volatilidade do mercado muda. O Auto Optimized Parabolic RSI resolve o problema de "obsolescência do indicador" recalculando continuamente a sua própria vantagem matemática, trazendo uma adaptação quantitativa de nível institucional diretamente para o seu terminal MT5. A Vantagem Principal: Otimização 3D em Memória Personaliz
ACTUALMENTE COM 40% DE DESCONTO A melhor solução para qualquer novato ou comerciante especializado! Este Indicador é uma ferramenta comercial única, de alta qualidade e acessível, porque incorporámos uma série de características proprietárias e uma nova fórmula. Com apenas UM gráfico, pode ler a força da moeda para 28 pares de Forex! Imagine como a sua negociação irá melhorar porque é capaz de apontar o ponto exacto do gatilho de uma nova tendência ou oportunidade de escalada? Manual do util
RFI levels PRO
Roman Podpora
5 (1)
O indicador mostra com precisão os pontos de reversão e as zonas de retorno de preço onde o   Principais players . Você identifica onde novas tendências estão se formando e toma decisões com máxima precisão, mantendo o controle sobre cada negociação. VERSION MT5     -     Revela seu potencial máximo quando combinado com o indicador   TREND LINES PRO. O que o indicador mostra: Estruturas de reversão e níveis de reversão com ativação no início de uma nova tendência. Exibição dos níveis de   TAKE
O indicador " Dynamic Scalper System " foi desenvolvido para o método de scalping, operando dentro de ondas de tendência. Testado nos principais pares de moedas e ouro, é possível a compatibilidade com outros instrumentos de negociação. Fornece sinais para a abertura de posições de curto prazo ao longo da tendência, com suporte adicional para o movimento dos preços. O princípio do indicador: As setas grandes determinam a direção da tendência. Um algoritmo para gerar sinais de scalping sob a fo
O Apollo SR Master é um indicador de Suporte/Resistência com recursos especiais que tornam a negociação com zonas de Suporte/Resistência mais fácil e confiável. O indicador calcula as zonas de Suporte/Resistência em tempo real, sem qualquer atraso, detectando topos e fundos de preço locais. Em seguida, para confirmar a área de Suporte/Resistência recém-formada, o indicador exibe um sinal especial que indica que a zona pode ser considerada e usada como um sinal de VENDA ou COMPRA. Nesse caso, a f
Scalping Lines System -  é um sistema de scalping concebido especificamente para negociar o ativo Ouro (XAUUSD) em timeframes de M1 a H1. Combina indicadores de tendência, volatilidade e análise de mercado de sobrecompra/sobrevenda, reunidos num único oscilador para identificar sinais de curto prazo. Os principais parâmetros internos das linhas de sinal estão pré-configurados. Alguns parâmetros permanecem para ajuste manual: "Duração da Onda de Tendência", que regula a duração de uma série de
O Detetor de Terremoto do Mercado  Sismógrafo. Description in English : https://www.mql5.com/en/market/product/113869?source=Site+Market+Product+Page#description How to use the Seismograph : https://www.mql5.com/en/market/product/113869#!tab=comments&page=2&comment=52806941 Create an EA : https://www.mql5.com/en/market/product/113869#!tab=comments&page=3&comment=52816509 Seja qual for a maneira como você negocia, você definitivamente quer evitar a entrada no mercado de baixa liquidez.- O
Trend Screener
STE S.S.COMPANY
4.79 (95)
Indicador de tendência, solução única inovadora para negociação e filtragem de tendências com todos os recursos de tendências importantes construídos dentro de uma ferramenta! É um indicador multi-timeframe e multi-moedas 100% sem repintura que pode ser usado em todos os símbolos/instrumentos: forex, commodities, criptomoedas, índices e ações. OFERTA POR TEMPO LIMITADO: O indicador Support and Resistance Screener está disponível por apenas US$ 65 vitalício. (Preço original US$ 250) (oferta esten
Atomic Analyst
Issam Kassas
5 (5)
Primeiramente, vale ressaltar que este Indicador de Negociação não repinta, não redesenha e não apresenta atrasos, tornando-o ideal tanto para negociação manual quanto automatizada. Manual do utilizador: configurações, entradas e estratégia. O Analista Atômico é um Indicador de Ação de Preço PA que utiliza a força e o momentum do preço para encontrar uma vantagem melhor no mercado. Equipado com filtros avançados que ajudam a remover ruídos e sinais falsos, e aumentam o potencial de negociação.
Supply and Demand Dashboard PRO
Bernhard Schweigert
4.8 (20)
Actualmente 40% OFF ! Este painel é uma peça de software muito poderosa que trabalha em múltiplos símbolos e até 9 prazos. Baseia-se no nosso principal indicador (Melhores críticas: Advanced Supply Demand ).   O tablier dá uma óptima visão geral. Mostra:   Valores filtrados da Oferta e da Procura, incluindo a classificação da força da zona, Distâncias de/para as zonas e dentro das zonas, Destaca as zonas aninhadas, Dá 4 tipos de alertas para os símbolos escolhidos em todos os (9) períodos de
Smart Liquidity Matrix é um indicador ICT Smart Money sem repintura para MetaTrader 4. Ele mapeia o panorama do fluxo de ordens institucionais detectando Blocos de Ordens, Gaps de Valor Justo, mudanças na Estrutura de Mercado (Quebra de Estrutura e Mudança de Caráter), Máximos/Mínimos Iguais e Varreduras de Liquidez — e então gera sinais de compra e venda com pontuação de confluência quando múltiplas condições Smart Money se alinham no fechamento de candle confirmado. Cada sinal inclui níveis de
Super Signal – Skyblade Edition Sistema profissional de sinais de tendência sem repintar / sem atraso com taxa de acerto excepcional | Para MT4 / MT5 Funciona melhor em timeframes mais curtos, como 1 minuto, 5 minutos e 15 minutos. Principais características: Super Signal – Skyblade Edition é um sistema inteligente de sinais desenvolvido especificamente para operações com tendência. Utiliza uma lógica de filtragem em múltiplas camadas para detectar apenas movimentos direcionais fortes sustenta
Legacy of Gann
Pavel Zamoshnikov
4.83 (12)
The indicator very accurately determines the levels of the possible end of the trend and profit fixing. The method of determining levels is based on the ideas of W.D.Gann, using an algorithm developed by his follower Kirill Borovsky. Extremely high reliability of reaching levels (according to K. Borovsky  - 80-90%) Indispensable for any trading strategy – every trader needs to determine the exit point from the market! Precisely determines targets on any timeframes and any instruments (forex, met
CRYSTAL HEIKIN ASHI SIGNALS MT4 Professional Trend Detection Indicator with Smart Entry Signals See the Trend. Catch the Move. Trade with Confidence. The professional Heikin Ashi indicator built for traders who want clarity, precision, and EA-ready signal automation. WHAT IS CRYSTAL HEIKIN ASHI SIGNALS? Crystal Heikin Ashi Signals is a professional-grade MetaTrader 4 indicator that combines pure Heikin Ashi candle visualization with an advanced momentum-shift detection system. Designed for both
Documentation for connecting Metatrader 4 with Python with a simple drag and drop EA.   A full end-to-end solution ,fully tested ,fast and efficient! The Pytrader ecosystem consists of a python script and a MT4 EA. (  MT5  version ) Further for the licensing an indicator is used.  The communication between the python script and the EA is based on sockets. EA is the  Server   and the python script the  Client .  It is always query(function / python script) and output(data / server). The EA doe
Indicador NextCandlePredictor NextCandlePredictor, um indicador de sinal com alerta que não repinta, não muda de cor, não se move, não desaparece e não tem lag. Ele ajudará a identificar a direção da próxima ou próximas velas em qualquer período de tempo. Altamente recomendado para mercados de alta volatilidade, como Nova York, Londres ou até mesmo a sobreposição de ambos. Principais Características: Versatilidade em Timeframes: Fornece sinais rápidos e precisos em qualquer timeframe, de M1 a H1
KURAMA GOLD SIGNAL PRO (MT4) — Sistema completo XAUUSD com filtro de 7 camadas SEM REPAINT SEM REDESENHO SEM ATRASO Cada sinal é permanente. BÔNUS: Compre a licença vitalícia e receba AI Zone Radar ($59) + manual PDF GRÁTIS. Envie mensagem após a compra. AI Zone Radar: https://www.mql5.com/en/market/product/175834 7 FILTERS 7 filtros independentes: Volatilidade, Estrutura MA, Direção tendência, Ângulo MA, Timeframe H4, RSI, Bloqueio penetração. A maioria usa 1-2 filtros. Es
Full Scalping Signal
Leandro Bernardez Camero
FullScalping é um indicador não repintante e não retroativo , especialmente projetado para gerar entradas de scalping CONSTANTES em qualquer mercado. Perfeito para traders agressivos que buscam ação ininterrupta! Junte-se ao canal para ficar atualizado com informações exclusivas e atualizações: https://www.mql5.com/en/channels/forexnewadvisor Você notará que ele dá sinais em quase toda vela , seja confirmando a tendência ou sinalizando retrações-chave. É como ter um radar constantemente guiand
Pare de adivinhar. Comece a operar com vantagem estatística. Os índices de ações não são negociados como forex. Eles têm sessões definidas, gaps noturnos e seguem padrões estatísticos previsíveis. Este indicador fornece os dados de probabilidade que você precisa para operar índices como DAX, S&P 500 e Dow Jones com confiança. O que o torna diferente A maioria dos indicadores mostra o que aconteceu. Este mostra o que provavelmente acontecerá em seguida. Todos os dias de negociação, o indicador an
Mais do autor
VSA Histogram
Richard Bystricky
VSA - P (Volume Spread Analysis) Period-Based Histogram is a tool that visually represents market volume dynamics using Volume Spread Analysis principles, with a focus on highlighting key volume changes over specific time periods. The histogram captures changes in volume and price spread relationships in real-time, enabling traders to detect early signals of accumulation, distribution, and shifts in buying or selling pressure. Indicator is non repainting and working with real-time on tick data.
ROC Histogram
Richard Bystricky
ROC (Rate of Change) indicator tracks the price movement dynamics by measuring the percentage change between the current price and a previous value over a specified time frame (based on Demark logic). This histogram identifies the speed of trend changes, enabling early recognition of overbought or oversold conditions, reversals in the market. The ROC is a useful tool for traders focused on trend-following as well as short-term strategies. Indicator is non repainting and working with real-time o
Deep Insight Candles is an indicator that brings an entirely new perspective to the price chart. It focuses on revealing hidden structures in market movements, uncovering buyer and seller pressure, thus helping traders to better identify key levels, dynamics, and potential reversals. The indicator conveys deeper market insights, allowing traders to make decisions based on a more accurate perception of market sentiment and pressure at specific price levels. This innovative approach transforms the
VWAP Histogram
Richard Bystricky
The VWAP Histogram Indicator is a powerful tool for traders, designed to visualize the Volume Weighted Average Price (VWAP) as a dynamic histogram. By combining VWAP with a clear histogram representation, this indicator provides deeper insights into price action and volume dynamics, helping traders identify key market levels more effectively. Key Features: Histogram Representation: Displays VWAP as a histogram directly in the indicator window, offering an intuitive view of price deviations and v
Filtro:
Sem comentários
Responder ao comentário