Trend Rider MT4
- Indicadores
- Versão: 1.0

Moving Average Structure
Trend Rider uses multiple moving averages with different periods. Each moving average represents a different component of the underlying price trend.
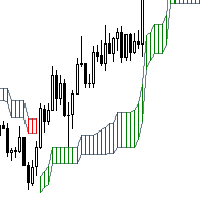
The areas between the moving averages are filled with color based on their relative ordering. When the moving averages are clearly separated and arranged in a consistent order, the filled areas form a defined structure. When the moving averages converge and overlap, the structure changes accordingly.
The fill therefore represents the spatial relationship between the moving averages rather than the price itself.
Moving Average Overlap
The moving averages can converge, overlap, and change their relative order as market conditions change.
The filled regions reflect these changes dynamically. A greater degree of overlap indicates that the moving averages are closer together, while a more separated structure indicates greater distance between the individual averages.
Fast Moving Average Crossover
Trend Rider also monitors the crossover between the two fastest moving averages.
When the fastest moving average crosses above the second-fastest moving average, a bullish crossover arrow is plotted.
When the fastest moving average crosses below the second-fastest moving average, a bearish crossover arrow is plotted.
The crossover arrows are based specifically on the relationship between these two moving averages and are independent of the slower moving averages used to construct the broader moving-average structure.
Indicator Components
Trend Rider therefore consists of two primary components:
-
Multiple moving averages forming the underlying trend structure.
-
Crossover arrows generated from the two fastest moving averages.
The combination provides a visual representation of both the overall moving-average structure and short-term changes in the relationship between the two fastest averages.