Heiken Ashi MT4 Indicator by PipTick
- Indicadores
-
Michal Jurnik
 "Talent is cheaper than table salt. What separates the talented individual from the successful one is a lot of hard work." - Stephen King. Those few words reflect myself very well. I am probably not the most talented developer in the world but I truly believe in hard work, professional attitude and
 - Versão: 1.1
- Atualizado: 3 dezembro 2021
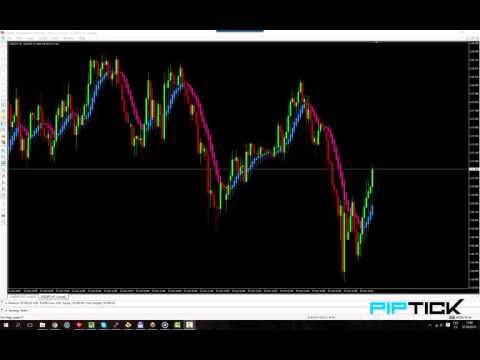
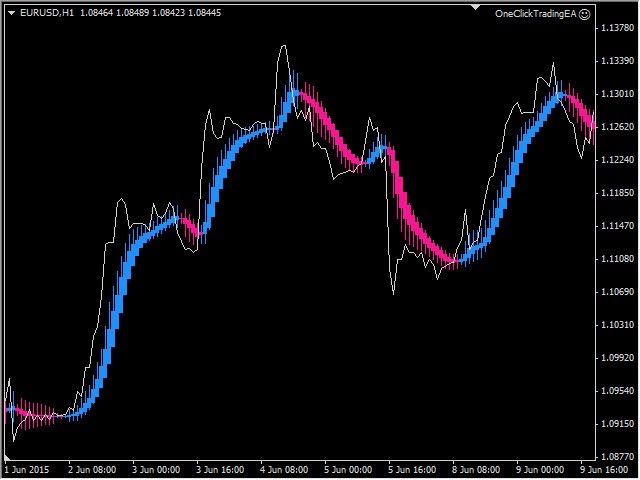
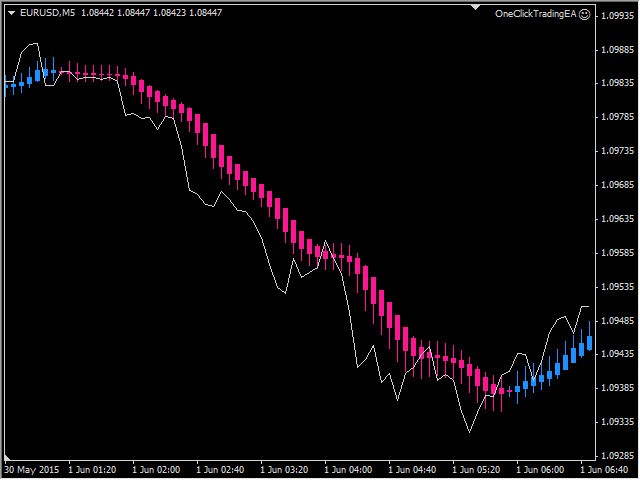
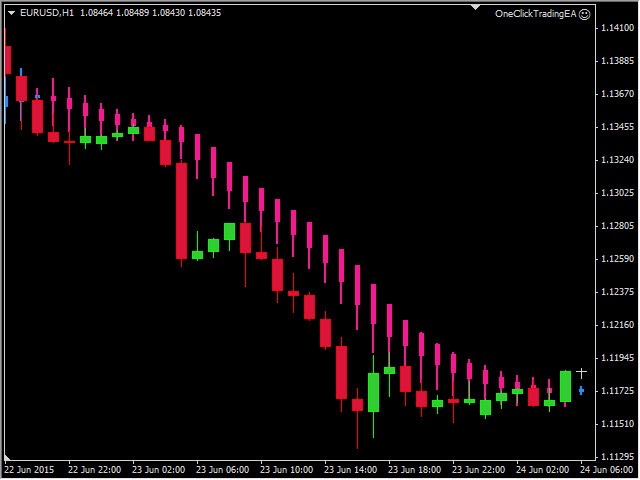
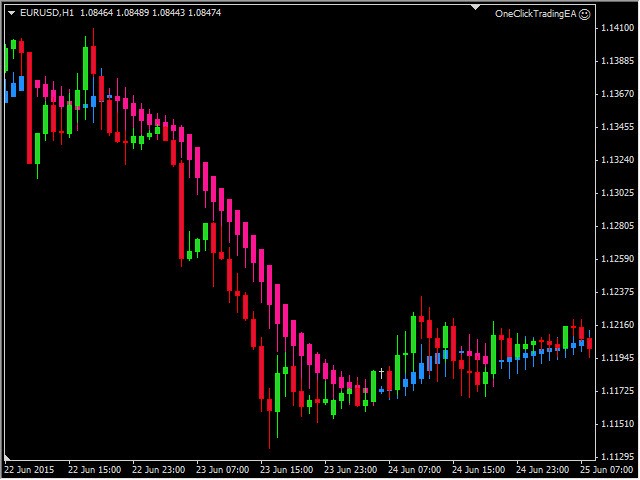
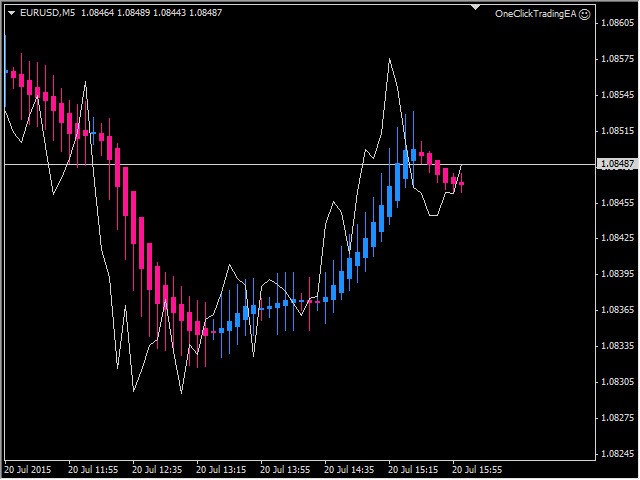
The Heikin Ashi indicator is our version of the Heikin Ashi chart. Unlike competitor products, this indicator offers extensive options for calculating Heikin Ashi candles. In addition, it can be displayed as a classic or smoothed version.
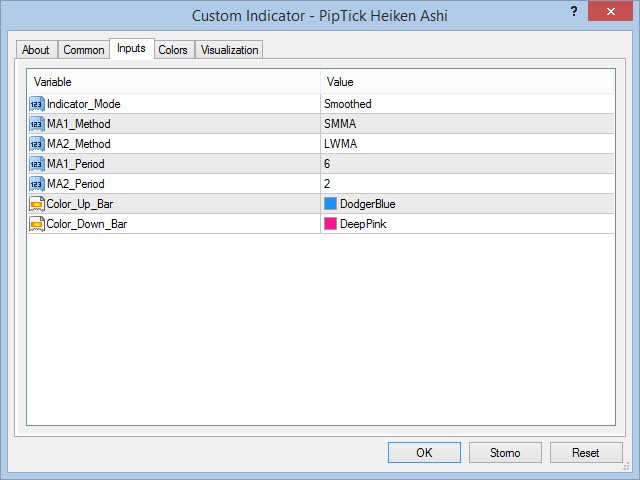
The indicator can calculate Heikin Ashi with moving average by four methods:
- SMA - Simple Moving Average
- SMMA - Smoothed Moving Average
- EMA - Exponential Moving Average
- LWMA - Linear Weighted Moving Average
Main features
- The indicator shows Heikin Ashi as a classic or smoothed version
- Excellent tool for simple assessment of the trend
- Works on every timeframe (M1, M5, M15, M30, H1, H4, D1, W1, MN)
- The indicator is non-repainting
- Ready for backtesting
- Customizable parameters (Colors, MA periods...)
- High-speed calculation
- Available for MT4 and MT5


a good indicator to use with combination with other indicators.....