 MetaTrader 5
 Experts
 Indicadores
 Bibliotecas
 Utilitários
 Widgets
 Regras
Conheça o Mercado MQL5 no YouTube, assista aos vídeos tutoriais
Como comprar um robô de negociação ou indicador?
Execute seu EA na
hospedagem virtual
hospedagem virtual
Teste indicadores/robôs de negociação antes de comprá-los
Quer ganhar dinheiro no Mercado?
Como apresentar um produto para o consumidor final?
Novos Expert Advisors e Indicadores para MetaTrader 4 - 352
 Os robôs de negociação irão ajudá-lo a fazer transações nos mercados automaticamente, por outro lado, graças aos indicadores você poderá analisar melhor as cotações e prever seu comportamento.
Com ajuda desses aplicativos, você poderá realizar transações no MetaTrader 4 de forma mais informada e melhorar seu potencial.
Os robôs de negociação irão ajudá-lo a fazer transações nos mercados automaticamente, por outro lado, graças aos indicadores você poderá analisar melhor as cotações e prever seu comportamento.
Com ajuda desses aplicativos, você poderá realizar transações no MetaTrader 4 de forma mais informada e melhorar seu potencial. 
The indicator displays the probable ( Support and resistance ) levels. The indicator draws horizontal and trend levels of support and resistance. The indicator settings: Trends - the mode for displaying trend lines or horizontal lines of support and resistance Yes - display trend lines only No - display horizontal lines only UseResource - use the resources built into the indicator. Yes - use the ZigZag indicator from the resources of the product. No - use a custom ZigZag indicator. HistoryBar -
FREE
AllHere is a plug-in for Control-adora that works as information panel. Its main function is to show you all the Control-adora elements placed in the chart, like the Control-adora's orders or the exit lines. On the lower left corner, AllHere shows a collection of buttons classified by color (you can set them in the indicator's properties) for several elements used in Control-adora system: Stop loss indications (stop loss Arrows) Exit lines Above (Above trend lines) Exit lines Below (Below trend
FREE

Trade Controller provides multiple methods to protect and maximize your profits. This powerful weapon helps you to set the protect and trailing-stop rules on your trade automatically in many effective methods. Once it is set and turned on, you don't need to monitor your orders anymore, the software will keep watching and control your orders with your predefined rules. It's designed to support multi-protection and trailing strategy: Protect by break-even, protect by percentage, protect by pip, pr
The Pioneer Of Trend Detection! A Powerful Indicator That Avoids Whipsaws And Uncertain Market Noise. Functions mainly as a filter to help you trade in the direction of the trend. It works in any pair or timeframe.
Features Advanced trend detection software using complex algorithms that can be used as the supporting tool or system. Unique trend detection that avoids whipsaws and uncertain market noise Analyzes statistics of maximum profits and calculates possible targets for the next signal Fle
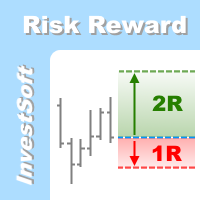
This is the forex visual orders tool & forex position size (lot) calculator with intuitive panel. Risk Reward Ratio Indicator works on all kind of symbols: currency pairs, indices, metals, commodities, cryptocurrencies, etc.
If you want to make sure that Risk Reward Ratio Indicator works on your favorite symbols contact us ( visit our profile ) and ask for 7-day free trial to test this tool without limits. If you want to place orders easier, faster and more intuitive? If you like to mark trad

Key Breakout and Jump/Fall levels. No lagging. No repaint. Trend line is useful for detecting pattern, which is intended for the triangle pattern, Support & Resistance lines, and as a breakout up or down line. The trend lines are formed first before the price of the pair reach it. So it does not repaint. Each line has a description, such as Support, Resistance, Current-Support as key breakout down, and Current-Resistance as a key breakout up. Each broke out line turns into a new support or re
Future WPR - or backward WPR - is a special modification of WPR: it uses standard formula, but applies it in reverse direction. The indicator calculates WPR from right to left, that is from the future to the past. It 'knows' and uses the future price movements at any bar where the right-side history provides sufficient number of "forthcoming" bars, that is period bars or more. Conventional WPR is also shown for reference. Both WPR and backward WPR are normalized to the range [0..1] as a more con
FREE

This is a must have tool for every trader, because this indicator provides the scoreboard with most important basic information for trading. It displays current server time, remaining time of the current bar, a calculated lot for the specified risk and free margin, characteristic bar sizes, and spreads. When placed on a chart, the indicator creates a text label in the upper right corner with the following information: -17:50 [70%] 11:42:30 SL:0 SP:17 B:A41/M39/D67 L:0.26/5% remaining time to cur
FREE

The FFx Dashboard MTF alerter will show you on a single chart all the timeframes (M1 to Monthly) with their own status for the indicator.
2 Alert Options: Single timeframe: each selected timeframe alert separately when a signal occurs. Multi timeframes: all selected timeframes must agree for an alert to be triggered. Both options have an input to select the timeframes to be used for the alert(s).
How to understand the status: Green square: Price above PSAR Red square: Price below PSAR
Options

The Profit Factor indicator calculates one of the three parameters: 1 - market entry level (in the 'Calculate the' parameter - Market Open Trade), 2 - the Stop Loss level (Calculate the - Market Price Loss), 3 - the Take Profit level (Calculate the - Market Price Profit) - with a desired profit/loss ratio (Profit Factor), as well as the lot size (trade volume) according to the value of the risk percentage of available funds specified in the settings (a simpler analog is the Lot Calculation indic

This is a future predictor based on so called backward WPR . The indicator calculates conditional probability of conversions between WPR and backward WPR values on available quotes history. Then it estimates future price movement using these probabilities and latest WPR readings. The backward WPR is nothing special except that it's counted from right to left, i.e. from the future to the past. The main advantage of the backward WPR is that it knows the future and its values are always optimal for

This tool is designed to measure the distance between two points on a chart and much more.
List of measured values:
Distance in points Profit (with and without spread) Time difference Percentage price change Slope angle Number of bars (various variations) Ratio of distance in points to the reference value Features:
Snap to OHLC prices Automatic color profile setting based on chart background color Various types of pointers to choose from Display of values of selected points on th
FREE
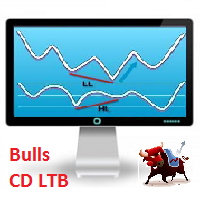
Description Bulls CD LTB (Bulls Convergence/Divergence Low Top Bottom) is a universal analytical bulls convergence/divergence indicator between a financial instrument and any of the twenty two standard indicators included in МT4 package. The indicator is the second out of the two possible versions (LBT and LTB) of the bullish convergence/divergence origins. Due to its multiple use feature, the indicator allows you to find convergences/divergences between the price and various standard indicators
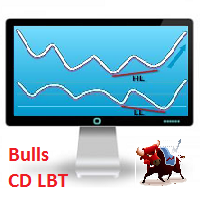
Description Bulls CD LBT (Bulls Convergence/Divergence Low Bottom Top) is a universal analytical bulls convergence/divergence indicator between a financial instrument and any of the twenty two standard indicators included in МT4 package. The indicator is the first out of the two possible versions (LBT and LTB) of the bullish convergence/divergence origins. Due to its multiple use feature, the indicator allows you to find convergences/divergences between the price and various standard indicators
Introduction to Sideways Market Analyzer Notable period of Low volatility and non-trending movements in the financial market is considered as Sideways Market. Sooner or later, the low volatility will increase and the price will pick up a trend after Sideways Market. In terms of trading point of view, Sideways Market can serve as the very good entry timing for traders. Sideways Market is also quite often the representation of accumulation of large orders from big investors. Therefore, knowing the

"TradeALot" is a plug-in for the Expert Advisor Control-adora . It allow you to place programmed orders without the need to write the name of the order in the Arrow (like bs, ss, bl, sl, sl1, sl2, etc). Just drag and drop the button for "Programmed Buys" or "Programmed Sells" over the candles-zone at the place where you want to program the order and TradeALot will compare the bid price with the position where you dropped the button and will decide if the order need to be "Stop" or "Limit". With
FREE

Abrupt400 is an intraday trading system that utilizes short-term rollback price movements. The Expert Advisor can run on different currency pairs. Includes a martingale option which, however, should be used carefully . To see the EA statistics with different brokers on different symbols, please visit the Trading Signals for MetaTrader 4 section. Parameters Risk management: enter volume - a volume for entry If the value is greater than 0 - number of lots, if less than 0 - percentage of availabl

Currency Power Meter shows the power of major currencies against each other. The indicator shows the relative strength of currency/pair at the current moment in a period of time (H4, daily, weekly, monthly). It is useful for day traders, swing traders and position traders with suitable period options. Currency power is the true reason of market trend: The strongest currency against the weakest currency will combine into a most trending pair. As we know, trend makes money and all traders love tre

Overview A One-Cancels-the-Other Order (OCO) is a pair of orders stipulating that if one order is executed, then the other order is automatically cancelled. Verdure OCO EA brings this functionality to MT4. This EA is a robust implementation of the popular One-Cancels-the-Other Order (OCO) but with added benefits, features and options. It is an EA that helps with trade management and especially useful for traders who use stop and reverse trading systems, traders who look for opportunities around

The FFx Dashboard MTF alerter will show you on a single chart all the timeframes (M1 to Monthly) with their own status for the indicator.
2 Alert Options: Single timeframe: each selected timeframe alert separately when a signal occurs Multi timeframes: all selected timeframes must agree for an alert to be triggered Both options have an input to select the timeframes to be used for the alert(s).
How to Understand the Status: Green/Red square: histogram above/below 0 line Green square + Red bord

The FFx Dashboard MTF alerter will show you on a single chart all the timeframes (M1 to Monthly) with their own status for the indicator.
2 Alert Options: Single timeframe: each selected timeframe alert separately when a signal occurs Multi timeframes: all selected timeframes must agree for an alert to be triggered Both options have an input to select the timeframes to be used for the alert(s).
How to understand the status: Green/Red square: RSI above/below 50 line Green square + Red border: R

The FFx Dashboard MTF alerter will show you on a single chart all the timeframes (M1 to Monthly) with their own status for the indicator.
2 Alert Options: Single timeframe: each selected timeframe alert separately when a signal occurs Multi timeframes: all selected timeframes must agree for an alert to be triggered Both options have an input to select the timeframes to be used for the alert(s).
How to understand the status: Green/Red square: Stoch above/below 50 line Green square + Red border:

The FFx Dashboard MTF alerter will show you on a single chart all the timeframes (M1 to Monthly) with their own status for the indicator.
2 Alert Options: Single timeframe: each selected timeframe alert separately when a signal occurs Multi timeframes: all selected timeframes must agree for an alert to be triggered Both options have an input to select the timeframes to be used for the alert(s).
How to understand the status: Green/Red square: Price above/below Cloud (Kumo) Green square + Red bo

The FFx Dashboard MTF alerter will show you on a single chart all the timeframes (M1 to Monthly) with their own status for the indicator.
2 Alert Options: Single timeframe: each selected timeframe alert separately when a signal occurs Multi timeframes: all selected timeframes must agree for an alert to be triggered Both options have an input to select the timeframes to be used for the alert(s).
How to understand the status: Green/Red square: MA pointing Up/Down Green square + Red border: MA po

Three Moving Averages Message is a notification system for the MetaTrader 4 platform. It consists of three moving averages which have their own adjustable parameters. Slow and Long lines determine long-term trend, while Fast and Slow lines - short-term. If the lines Fast and Slow are crossed during a trend, the indicator displays a recommendation for buying (selling). If the lines Slow and Long are crossed, the indicator notifies of the start of a up/down trend. Concerning other types of crossin
This indicator provides a true volume surrogate based on tick volumes. It uses a specific formula for calculation of a near to real estimation of trade volumes distribution , which may be very handy for instruments where only tick volumes are available. Please note that absolute values of the indicator do not correspond to any real volumes data, but the distribution itself, including overall shape and behavior, is similar to real volumes' shape and behavior of related instruments (for example, c

The FFx Dashboard MTF alerter will show you on a single chart all the timeframes (M1 to Monthly) with their own status for the indicator.
2 Alert Options: Single timeframe: each selected timeframe alert separately when a signal occurs Multi timeframes: all selected timeframes must agree for an alert to be triggered Both options have an input to select the timeframes to be used for the alert(s).
How to understand the status: Green/Red square: CCI above/below levels (ie. 100/-100) Grey square: C

The FFx Dashboard MTF alerter will show you on a single chart all the timeframes (M1 to Monthly) with their own status for the indicator.
2 Alert Options: Single timeframe: each selected timeframe alert separately when a signal occurs Multi timeframes: all selected timeframes must agree for an alert to be triggered Both options have an input to select the timeframes to be used for the alert(s).
How to understand the status: Green/Red square: ADX above level Grey square: ADX below level Red bor

The FFx Dashboard MTF alerter will show you on a single chart all the timeframes (M1 to Monthly) with their own status.
2 Alert Options: Single timeframe: each selected timeframe alert separately when a signal occurs Multi timeframes: all selected timeframes must agree for an alert to be triggered Both options have an input to select the timeframes to be used for the alert(s).
How to understand the status: Green/Red square: bullish/bearish candle
Options available in the FFx Dashboard Alerter

A. O que é A2SR ? * É um indicador técnico importante (sem repintura, sem atraso).
-- Orientação : -- em https://www.mql5.com/en/blogs/post/734748/page4#comment_16532516 -- e https://www.mql5.com/en/users/yohana/blog .. MT5 version: https://www.mql5.com/en/market/product/140111
A2SR tem uma técnica especial para determinar os níveis de Suporte (demanda) e Resistência (oferta). Ao contrário da maneira comum que vimos na rede, o A2SR tem um conceito original na determinação dos níveis reais
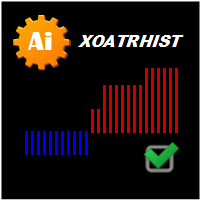
Este é um dos meus primeiros indicadores. Ligeiramente melhorado. O indicador baseia-se no gráfico ponto e figura , mas o seu período é igual aos valores dos indicadores de ATR. Parâmetros: ATRPeriod - período ATR para o cálculo dos passos. OnBarsCalc - se true, então habilita o BarsCalc . BarsCalc - o número de barras calculadas. Nota: O indicador utiliza o fechamento do preço, portanto recomenda-se considerar o fechamento das barras.
FREE

O que é Squeeze? É geralmente visto como um indicador importante, potencializa o movimento direcional subseqüente ou grande movimento de oscilação do indicador Bollinger Bands no interior do Keltner Channel refletindo o mercado, fazendo uma pausa e consolidando. Quando as Bollinger Bands deixam o Keltner Channel significa que mercados estão saíndo de uma baixa volatilidade para uma alta volatilidade, um objetivo que todos os traders estão procurando. Diferença
Squeeze FREE
Squeeze
Squeeze PRO
FREE
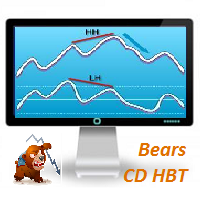
Description Bears CD HBT (Bears Convergence/Divergence High Bottom Top) is a universal analytical bears convergence/divergence indicator between a financial instrument and any of the twenty two standard indicators included in МT4 package. The indicator is the first out of the two possible versions (HBT and HTB) of the bearish convergence/divergence origins. Due to its multiple use feature, the indicator allows you to find convergences/divergences between the price and various standard indicators
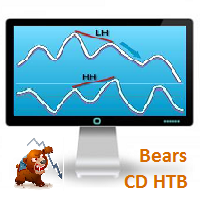
Bears CD HTB (Bears Convergence/Divergence High Top Bottom) is a universal analytical bears convergence/divergence indicator between a financial instrument and any of the twenty two standard indicators included in МetaTrader 4 package. The indicator is the second out of the two possible versions (HBT and HTB) of the bearish convergence/divergence origins. Due to its multiple use feature, the indicator allows you to find convergences/divergences between the price and various standard indicators

This is a very silly script but perhaps you find it useful. It deletes all objects from the chart. I recommend setting a hot key to call it just by pressing a couple of keys on your keyboard. To avoid accidental deletion of object, the script will ask you to confirm the action as you won't be available to restore them with "undo" (Ctrl+Z).
FREE

When drawing a trend line or other objects, there is a natural deviation when you place the object from a higher time frame, and then go to watch it in a lower time frame. PerfectLine is a technical indicator that solves this problem. Once you touch a line after drawing it, Perfect Line will find the exact spot in the lower time frame available for it's position and then rectifies where it should be. Perfect Line uses a five pixels pre-established tolerance, if a difference between the line's no

If the direction of the market is upward, the market is said to be in an uptrend ; if it is downward, it is in a downtrend and if you can classify it neither upward nor downward or rather fluctuating between two levels, then the market is said to be in a sideways trend. This indicator shows Up Trend (Green Histogram), Down Trend (Red Histogram) and Sideways Trend (Yellow Histogram). Only one input parameter: ActionLevel. This parameter depends of the length of the shown sideways trend.
Description A colored multicurrency/multisymbol indicator Aroon Global based on one of the twenty three standard indicators of MT4. The indicator consists of two lines: Aroon Up and Aroon Down . The main function of the indicator is to predict the trend change. The indicator may be used with any broker, irrespective of the name of the financial instrument since it is necessary to manually enter the name as an input parameter. If you enter a non-existent or incorrect name of a financial

Trailing Even is a free complement for the Control adora Expert Adviser. It adds a trailing stop function and changes the exit level that works as stop loss if some price is reached, let's review how to make it work: First of all make sure you have the same language selected both in the Control adora Expert and in this indicator. Change of the exit level that works as stop loss with "BES" and "BEO": This function needs 2 arrows to work: 1 named BES (stands for Break Even Start) place it at the
FREE
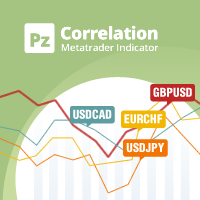
In the world of finance, correlation is a statistical measure of how two securities move in relation to each other. Correlations are used in advanced portfolio management. This indicator measures how different securities move in relation to a reference one, thus making portfolio management easier. [ Installation Guide | Update Guide | Troubleshooting | FAQ | All Products | Get Help ] Avoid concurrent trades in highly correlated instruments Find trading opportunities among highly correlated
FREE

Ever wondered what is XAU/XAG rate or how Chinese Yuan is traded against Russian Ruble? This indicator gives the answers. It shows a cross rate between current chart symbol and other symbol specified in parameters. Both symbols must have a common currency. For example, in cases of XAUUSD and XAGUSD, or USDRUB and USDCHN, USD is the common currency. The indicator tries to determine the common part from symbols automatically. If it fails, the DefaultBase parameter is used. It is required for non-F
FREE
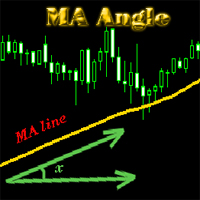
MA_Angle calculates the angle value between MA line and horizontal line at every bar on the main chart. Suppose that there is a bar number n . MA line is specified by a line segment (view the screenshots below, that is the Red line connecting MA point value at bar n and bar number n+1 ). This indicator shows you the strength of the market trend (up or down). You can customize how angle is displayed by "alertAngle" parameter (view the screenshots below). The default angle value is 30 degrees. It

The alerting system for the MetaTrader 4 platform 'Two Moving Average Message' consists of two moving average lines with individual parameters. The indicator can generate alerts ( AlertMessage )б display a comment in the upper left corner of the main chart window ( CommentMessage ), send notifications to the mobile terminal version ( MobileMessage ), send emails ( GmailMessage ) and play two different sounds at the intersection of lines upwards or downwards. Parameters Language – choose language
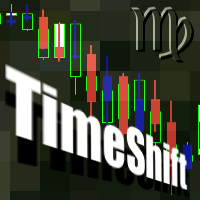
If you like candle patterns you should be aware of their mutability. Shift the time axis by a fraction of a single bar, and you'll see completely different figures. But this fraction can be just a valid GMT offset from another time zone, and these new candle patterns should work in the same way as the ones from your timezone do. This indicator builds candle bars with open times shifted in future. It takes your major period into consideration, but creates bars starting with a specified offset, so

Discrete Trend determines the dominant trend. The innovative algorithm allows the indicator to automatically adapt to any timeframe and currency pair completely eliminating the need for manual adjustments. The indicator works on bar closings. Thus, it is advisable to consider signals on the already formed candles. The product can be used both as a filter and as a main indicator.
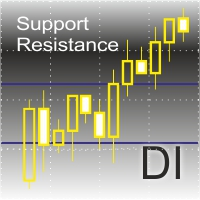
O indicador exibe os níveis de suporte e resistência no gráfico.
Características: Ele exibe os níveis de suporte e resistência para os últimos 12 meses. Mostra a máxima e a mínima da última semana. Mostra o valor da "MA 200". Mostra lacunas com um filtro pré-definido.
As definições do indicador: ShowMA200 - mostra/oculta o valor MA 200. ColorMA200 - a linha de cor MA 200. LineStyleMA200 - estilo de linha da MA 200. LineWidthMA200 - largura da linha MA 200. ShowMonth - mostra/oculta os níveis d

This is a very simple indicator that mixes the Sunday session with the Monday one. This is useful because the Sunday session is a partial session mostly with only Australian and Asian sessions included, so the analysis of the Monday's daily session if mixed with Sunday tends to be more comprehensive. This indicator plots a candle with the following values: Open - the Friday's Close or Sunday's Open (depending on your choice). High - the highest High of Sunday and Monday. Low - the lowest Low of
FREE
This is a technical indicator that works as a plug-in for "Control adora" - the Expert Advisor that helps you to calculate, place and control positions on the chart. When run on a chart with Control adora EA, this plug-in allows setting entry levels that send orders at contact, while you have StopCloseOnly (OCO in Comments) = 1 settled in Control adora (meaning that without this, the indicator will send the order only when the price Close crosses the arrow level). This indicator only works if yo
FREE

This indicator is a visual combination of 2 classical indicators: Bulls and MACD. The main idea behind the MACD is that it subtracts the longer-term moving average from the shorter-term moving average. This way it turns a trend-following indicator into the momentum one and combines the features of both. Usage of this indicator could be the same as both classical indicators separately or combined. Input parameters: BullsPeriod = 9; maMethod = MODE_SMA; ENUM_MA_METHOD maPrice = PRICE_CLOSE; ENUM

This indicator compares the price changes during the specified period for the current symbol and other reference symbol. It allows to analyze the similar movements of highly correlated symbols, such as XAUUSD and XAGUSD, and find their occasional convergences and divergences for trading opportunities. The indicator displays the following buffers: light-green thick line - price changes of the current symbol for TimeGap bars; light-blue thin line - price changes of the reference symbol ( LeadSymbo
FREE

If you like trading by candle patterns and want to reinforce this approach by modern technologies, this script is for you. In fact, it is a part of a toolbox, that includes a neural network engine implementing Self-Organizing Map (SOM) for candle patterns recognition, prediction, and provides you with an option to explore input and resulting data. The toolbox contains: SOMFX1Builder - this script for training neural networks; it builds a file with generalized data about most characteristic pric
FREE
If you like trading by candle patterns and want to reinforce this approach by modern technologies, this indicator and other related tools are for you. In fact, this indicator is a part of a toolbox, that includes a neural network engine implementing Self-Organizing Map (SOM) for candle patterns recognition, prediction, and provides you with an option to explore input and resulting data. The toolbox contains: SOMFX1Builder - a script for training neural networks; it builds a file with generalized
If you like trading by candle patterns and want to reinforce this approach by modern technologies, this indicator and other related tools are for you. In fact, this indicator is a part of a toolbox, that includes a neural network engine implementing Self-Organizing Map (SOM) for candle patterns recognition, prediction, and provides you with an option to explore input and resulting data. The toolbox contains: SOMFX1Builder - a script for training neural networks; it builds a file with generalize

The purpose of this new version of the MT4 standard indicator provided in your platform is to display in a sub-window multiple timeframes of the same indicator with its divergences. See the example shown in the picture below. But the display isn't like a simple MTF indicator. This is the real display of the indicator on its timeframe. Here's the options available in the FFx divergences indicator: Select the timeframes to be displayed (M1 to Monthly) Define the width (number of bars) for each tim

The purpose of this new version of the MT4 standard indicator provided in your platform is to display in a sub-window multiple timeframes of the same indicator with its divergences. See the example shown in the picture below. But the display isn't like a simple MTF indicator. This is the real display of the indicator on its timeframe. Here's the options available in the FFx divergences indicator: Select the timeframes to be displayed (M1 to Monthly) Define the width (number of bars) for each tim

The purpose of this new version of the MT4 standard indicator provided in your platform is to display in a sub-window multiple timeframes of the same indicator with its divergences. See the example shown in the picture below. But the display isn't like a simple MTF indicator. This is the real display of the indicator on its timeframe. Here's the options available in the FFx divergences indicator: Select the timeframes to be displayed (M1 to Monthly) Define the width (number of bars) for each tim
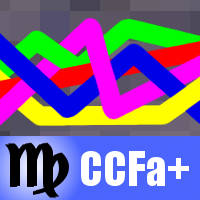
This is a multicurrency indices cluster indicator with extended functionality. It displays linear changes in relative value of tickers and currencies on annual, monthly, weekly basis. It calculates the values in the same way as CCFpExtra does, but does not use moving averages. Instead, all numbers are compared to an initial value at some point in history, for example, at beginning of a year, a month, or a week. As a result, one may see exact changes of values, and apply traditional technical ana
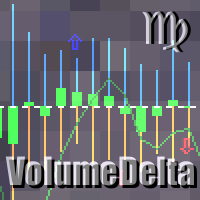
This indicator provides the analysis of tick volume deltas. It calculates tick volumes for buys and sells separately, and their delta on every bar, and displays volumes by price clusters (cells) within a specified bar (usually the latest one). This is a limited substitution of market delta analysis based on real volumes, which are not available on Forex. The indicator displays the following data in its sub-window: light-blue histogram - buy (long) volumes; orange histogram - sell (short) volumes

The purpose of this new version of the MT4 standard indicator provided in your platform is to display in a sub-window multiple timeframes of the same indicator with its divergences. See the example shown in the picture below. But the display isn't like a simple MTF indicator. This is the real display of the indicator on its timeframe. Here's the options available in the FFx divergences indicator: Select the timeframes to be displayed (M1 to Monthly). Define the width (number of bars) for each ti

The purpose of this new version of the MT4 standard indicator provided in your platform is to display in a sub-window multiple timeframes of the same indicator with its divergences. See the example shown in the picture below. But the display isn't like a simple MTF indicator. This is the real display of the indicator on its timeframe. Here's the options available in the FFx divergences indicator: Select the timeframes to be displayed (M1 to Monthly). Define the width (number of bars) for each ti

Trades Viewer is a trading helper app for a serious trader. It offers several important data like day range, 22 days average range and predefined PL. It draws trades history and current open positions on a chart. It has a detail panel for viewing a particular trade with just a click on that trade. All these make it very convenient and straightforward to view your entry/exit positions and thus improve your trading system.
Features Profit/loss of the current symbol, counting all trades of the sym

Trade Report Pro é um EA que cria automaticamente ou manualmente um relatório gráfico profissional do seu histórico de negociação. Também envia uma notificação para o seu celular ou e-mail quando seu saldo de conta for alterado. Os relatórios são salvos no formato HTML e CSV e uma janela de relatório de resumo rápido é aberta dentro MT4 para visualização instantânea. Nota: Versão demonstração para teste pode ser baixado em: https://www.mql5.com/pt/market/product/5054
Características: Relatório

Price Breakout pattern Scanner is the automatic scanner for traders and investors. It can detect following patterns automatically from your chart. Head and Shoulder - Common tradable pattern. Reverse Head and Shoulder - This pattern is the reverse formation of the Head and Shoulder. Double Top - When the price hits resistance level twice and decline toward the support level, the trader can anticipate sudden bearish breakout through the support level. Double Bottom - The double bottom pattern is

This indicator is a visual combination of 2 classical indicators: Bears and MACD. Usage of this indicator could be the same as both classical indicators separately or combine. Input parameters: input int BearsPeriod = 9; input ENUM_MA_METHOD maMethod = MODE_SMA; input ENUM_APPLIED_PRICE maPrice = PRICE_CLOSE; input int SignalPeriod = 5.

Ever wondered why standard ADX is made unsigned and what if it would be kept signed? This indicator gives the answer, which allows you to trade more efficient. This indicator calculates ADX values using standard formulae, but excludes operation of taking the module of ADX values, which is forcedly added into ADX for some reason. In other words, the indicator preserves natural signs of ADX values, which makes it more consistent, easy to use, and gives signals earlier than standard ADX. Strictly s
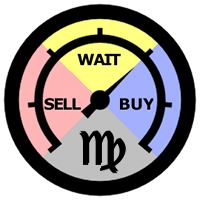
This is an easy to use indicator based on multitimeframe cluster analysis of specified currencies. It provides simple yet powerful signals for trading and gives numerical measures of signal strength in percentage value. After placing the indicator on a chart, it displays a table with the following structure: all symbols with currently available opportunities to trade are listed in rows, and trading strategies are listed in columns as short-term (hours), mid-term (days), and long-term (weeks) tra

The Expert Advisor opens orders at the points of possible price reversal using repeated entries (adding to a position). Parameters for repeated entries (volume, price and time) are set by the functions. Function equations are integrated into the EA. Only initial parameters and equation type should be selected for optimization. Features By selecting different combinations of parameters and equations integrated into the EA, you can create its varieties that are quite different in their trading

This is a simple script that places a defined number of lines above and below a given price. The script lets you set the number of lines, the separation in pips and the color. Instructions:
Drop the script on a chart to draw the level lines If the last parameter is set to false, the script will delete the lines previously placed by it.
Parameters:
English? Turn it yes to use English language, false will turn language to Spanish Separation Set the pips distance among lines From Price Ca
FREE
This is a technical indicator that put on strategy tester the buttons of the expert adviser "Control adora". Usually when applied the controladora to the strategy tester, the buttons do not appear and therefore its functions (like directly buy, sell, close orders or place stop loss indicator) can't be used. But now you can if have the Manual Backtest indicator. If you don't have Control adora, you can get it from here . This indicator get on the chart the buttons that can be of use in strategy t
FREE

This is the full version of "SAR Trading Station" SAR Trading Station is a semi-auto trading system based on Parabolic SAR and Stochastic etc, and trend driven swing trading strategy. This is an agile platform allowing you to setup various parameters to optimize the specific symbol pair trading strategy for yourself! Enquire email: info@startrading.com.au, Facebook:mengmeng_cn@hotmail.com Risk(Max Loss$): : Default is 50, Max loss Per order(Position size is calculated by stop loss amount) Round:
Saiba como comprar um robô de negociação na AppStore do MetaTrader, a loja de aplicativos para a plataforma MetaTrader.
O Sistema de Pagamento MQL5.community permite transações através WebMoney, PayPay, ePayments e sistemas de pagamento populares. Nós recomendamos que você teste o robô de negociação antes de comprá-lo para uma melhor experiência como cliente.

Você está perdendo oportunidades de negociação:
- Aplicativos de negociação gratuitos
- 8 000+ sinais para cópia
- Notícias econômicas para análise dos mercados financeiros
Registro
Login
Você concorda com a política do site e com os termos de uso
Se você não tem uma conta, por favor registre-se