 MetaTrader 5
 Experts
 Indicadores
 Bibliotecas
 Utilitários
 Widgets
 Regras
Conheça o Mercado MQL5 no YouTube, assista aos vídeos tutoriais
Como comprar um robô de negociação ou indicador?
Execute seu EA na
hospedagem virtual
hospedagem virtual
Teste indicadores/robôs de negociação antes de comprá-los
Quer ganhar dinheiro no Mercado?
Como apresentar um produto para o consumidor final?
Indicadores Técnicos para MetaTrader 4 - 179
 É com base nos sinais de indicadores técnicos listados abaixo que você pode aplicar as decisões para abertura ou fechamento de uma transação na plataforma MetaTrader 4.
O funcionamento dos indicadores reside na previsão de mudanças de preço, com base na conversão matemática de preço e/ou volumes de um instrumento financeiro.

NQX Trend Alignment London MT4 é um indicador de sinais para MetaTrader 4: sinais de alinhamento de tendência (só sinaliza durante a sessão de Londres (gráficos intraday)). Lógica NQX proprietária que detecta a tendência se alinhando em várias velocidades. Só sinaliza durante a sessão de Londres (gráficos intraday). Desenha a entrada sugerida, um stop curto e alvos longos (3:1, 5:1, 10:1, até 20:1 no swing); você decide. O que ele desenha no gráfico
- Uma seta no candle de sinal fechado (nunca r

NQX Multi Test Breakout New York MT4 é um indicador de sinais para MetaTrader 4: sinais de rompimento após múltiplos testes (só sinaliza durante a sessão de Nova York (gráficos intraday)). Lógica NQX proprietária que detecta um nível testado várias vezes e finalmente rompido. Só sinaliza durante a sessão de Nova York (gráficos intraday). Desenha a entrada sugerida, um stop curto e alvos longos (3:1, 5:1, 10:1, até 20:1 no swing); você decide. O que ele desenha no gráfico
- Uma seta no candle de

TMT Squeeze Momentum - Volatility Squeeze Dots, Momentum Histogram, Strength Panel and Alerts for MetaTrader 4 Squeeze ON / OFF dots | Linear-regression momentum histogram | Buyers vs Sellers strength % | Popup, sound, push and email alerts 1. Overview TMT Squeeze Momentum is an indicator for MetaTrader 4 that runs in its own sub-window below the price chart. It answers two questions at the same time: Is volatility compressing? Dots on the zero line show whether the market is in a "squeeze", w

Overview MERAZ BO Sniper PRO is a multi-factor signal indicator designed for short-expiry binary options trading, especially 60-second trades on the M1 chart. Instead of relying on a single oscillator, it combines ten independent market factors into one weighted quality score (0–100) and shows an arrow only when enough factors agree. Every signal is calculated from the closed candle and drawn at the open of the next candle . That next candle is your entry candle. Signals do not repaint or disapp

Elder Ray Confluence MT4 Six readings, one confluence score, non-repainting closed-candle signals Elder Ray Confluence builds on Dr. Alexander Elder’s classic Bull Power / Bear Power study. Instead of reading two histograms by eye and guessing whether a move is real, you get six separate readings that are checked against each other. When enough of them agree, you see it as one clear score and one clear arrow. Non-repainting STRONG BUY / SELL arrows are decided when the candle closes, using clos

Um quadro, vinte e oito símbolos e uma leitura de impulso calma o bastante para se confiar nela. SMI Ergodic Scanner roda o índice duplamente suavizado de Blau em quatro timeframes por símbolo, atribui grau a um cruzamento conforme ele tenha ocorrido além dos níveis e mantém o oscilador sob o quadro para conferir o cruzamento a olho. O preço aumenta $10 a cada 10 compras. SMI Ergodic Scanner são dois produtos num arquivo. O primeiro é o próprio índice SMI Ergodic, na janela própria deste gráfico

A leitura de tendência mais limpa que o Heikin-Ashi pode dar, em toda a sua lista de acompanhamento. Smoothed Heikin Ashi Scanner roda a vela duplamente suavizada em até vinte e oito símbolos e quatro timeframes, ordena o quadro pelo que virou mais recentemente e mantém o gráfico abaixo para ver o corpo da vela antes de agir. O preço aumenta $10 a cada 10 compras. Smoothed Heikin Ashi Scanner são dois produtos num arquivo. O primeiro é o próprio Smoothed Heikin Ashi, desenhado no gráfico à sua f

Qual dos seus símbolos acabou de romper o nível sobre o qual estava sentada a maioria dos seus pivôs. S/R Channels Scanner constrói o canal mais forte por símbolo em quatro timeframes, atribui grau a cada célula pelo número de pivôs que seguram esse canal e mantém o gráfico sob o quadro para ver o nível e o rompimento antes de agir. O preço aumenta $10 a cada 10 compras. S/R Channels Scanner são dois produtos num arquivo. O primeiro é o próprio S/R Channels, desenhado no gráfico à sua frente: o

Figuras de reversão ordenadas por força em vez de apenas listadas. Three Bar Reversal Scanner encontra a reversão de três velas em até vinte e oito símbolos e quatro timeframes, atribui grau a cada célula pela força com que a terceira vela fechou através do nível e mantém o gráfico sob o quadro para ver a figura antes da operação. O preço aumenta $10 a cada 10 compras. Three Bar Reversal Scanner são dois produtos num arquivo. O primeiro é o próprio Three Bar Reversal, desenhado no gráfico à sua

Um filtro em degraus que não tagarela, em toda a sua lista de acompanhamento. Twin Range Filter Scanner acompanha a linha de dupla amplitude em até vinte e oito símbolos e quatro timeframes, ordena o quadro pelo que virou mais recentemente e diz numa coluna quantos timeframes concordam, com o gráfico abaixo para a entrada. O preço aumenta $10 a cada 10 compras. Twin Range Filter Scanner são dois produtos num arquivo. O primeiro é o próprio Twin Range Filter, desenhado no gráfico à sua frente: a

Um stop dinâmico adaptativo, lido em vinte e oito símbolos ao mesmo tempo. Var Trail Tracker Scanner roda a média de apoio VAR e o seu arrasto percentual em quatro timeframes por símbolo, ordena pelo que cruzou mais recentemente e mantém o gráfico sob o quadro para ver as duas linhas antes da operação. O preço aumenta $10 a cada 10 compras. Var Trail Tracker Scanner são dois produtos num arquivo. O primeiro é o próprio Var Trail Tracker, desenhado no gráfico à sua frente: a média de apoio, a lin

O quadro só acende quando um mercado realmente parte. Volatility Explosion Scanner vigia até vinte e oito símbolos em quatro timeframes à espera da vela em que o impulso vence pela primeira vez os dois limiares, atribui grau ao estouro pela distância que ele foi além do limiar e mantém o oscilador sob o quadro para ver o estouro antes de se comprometer. O preço aumenta $10 a cada 10 compras. Volatility Explosion Scanner são dois produtos num arquivo. O primeiro é o próprio Volatility Explosion,

Rotação, medida em toda a sua lista de acompanhamento. Vortex Indicator Scanner roda o par VI em até vinte e oito símbolos e quatro timeframes, atribui grau a um cruzamento pela força da linha líder naquele instante e mantém o oscilador sob o quadro para conferir o cruzamento antes de agir. O preço aumenta $10 a cada 10 compras. Vortex Indicator Scanner são dois produtos num arquivo. O primeiro é o próprio Vortex Indicator, na janela própria deste gráfico: VI mais, VI menos e o histograma de dis

Capitulação, detectada em vinte e oito símbolos antes que você termine de ler o primeiro gráfico. Williams Vix Fix Scanner roda o medidor de medo em quatro timeframes por símbolo, atribui grau a cada célula pelo quanto a leitura foi extrema e mantém o oscilador sob o quadro para ver a zona antes de agir. O preço aumenta $10 a cada 10 compras. Williams Vix Fix Scanner são dois produtos num arquivo. O primeiro é o próprio Williams Vix Fix, na janela própria deste gráfico: o medidor de medo, o seu

Uma linha de tendência rápida que ainda assim se recusa a virar por ruído, em toda a sua lista de acompanhamento. Zero-Lag Trend Scanner roda a média sem atraso e a sua faixa de volatilidade em até vinte e oito símbolos e quatro timeframes, ordena pelo que rompeu mais recentemente e mantém o gráfico sob o quadro para ver o rompimento antes da entrada. O preço aumenta $10 a cada 10 compras. Zero-Lag Trend Scanner são dois produtos num arquivo. O primeiro é o próprio Zero-Lag Trend, desenhado no g

Indicador Crypto_Forex "DeMarker FLAT Detector" - uma ferramenta auxiliar eficiente na negociação! Sem necessidade de repintura. Eu ofereço a você a oportunidade de atualizar seus métodos de negociação com este ótimo indicador para MT4. - O indicador mostra áreas de preço planas no gráfico. Possui o parâmetro "Sensibilidade de plana" - responsável pela detecção de planas. - O "DeMarker FLAT Detector" pode ser usado para confirmação de entradas de Ação de Preço ou em combinação com outros indica

Indicador Crypto_Forex com Padrão de Barras ENGULFING para MT4, sem repintura, sem atraso. - O indicador "Barra ENGULFING" é um indicador muito poderoso para negociação de Price Action. - O indicador detecta padrões de Barras Engulfing no gráfico: - Barra Engulfing de Alta - Sinal de seta azul no gráfico (veja as imagens). - Barra Engulfing de Baixa - Sinal de seta vermelha no gráfico (veja as imagens). - Com alertas para PC, celular e e-mail. - O indicador "Padrão de Barras ENGULFING" é excele

Indicador Crypto_Forex "Oscilador Rsi Cci Stoch ponderado" para MT4, sem repintura. - Este indicador único combina 3 em 1: RSI, CCI e Estocástico para cálculo! - Oportunidades de negociação dinâmicas precisas com este software - ver exemplos nas fotos. - O indicador é constituído por 3 linhas: - Oscilador ponderado Rsi Cci Stoch propriamente dito (cor azul); - MA rápida do oscilador (cor Amarela); - MA lenta do oscilador (cor vermelha); - Zona acima de 50 - zona de sobrecompra (Não COMPRE lá).

Manual Volume Profile MS shows where volume was actually traded. It draws today's session profile live and lets you place up to 10 independent volume profile ranges anywhere on the chart with two mouse clicks. Every profile shows the POC, VAH, VAL and the Value Area. KEY FEATURES Daily profile – today's volume profile, drawn to the right of the current bar or over the day's bars, updated live. Manual ranges PV 1 – PV 10 – click a PV button, click the start and the end of the range, and the profi

Spread Guardian is a professional broker execution auditing utility designed to monitor and log real-time Bid/Ask spreads and volatility directly on your chart.
While brokers often advertise fixed or typical tight spreads, true market execution costs fluctuate continuously during liquidity shifts, major macroeconomic releases, and daily rollover windows (21:00–23:00 GMT). Spread Guardian provides complete empirical transparency regarding your actual trading costs.
### KEY FEATURES
* Tick-by

Volume Comparator is an institutional-grade intraday volume analysis utility designed to benchmark market activity against historical norms for the exact time of day.
Standard volume indicators evaluate volume strictly in isolation or against immediately preceding bars. However, financial markets follow systematic diurnal cycles: regular opening session bursts, scheduled algorithmic liquidity handoffs, and subdued quiet hours. A high-volume bar during the London Open is completely normal, where

Indicador Crypto_Forex Padrão PINBAR para MT4, sem repintura, sem atraso. - O indicador "Padrão PINBAR" é um indicador muito poderoso para negociação de Price Action. - O indicador detecta PinBars no gráfico: - PinBar de alta - Sinal de seta azul no gráfico (veja as imagens). - PinBar de baixa - Sinal de seta vermelha no gráfico (veja as imagens). - Com alertas para PC, celular e e-mail. - O indicador "Padrão PINBAR" é excelente para combinar com níveis de suporte/resistência. Click here to see

O ICT CISD implementa o conceito Change in State of Delivery da metodologia ICT. O indicador acompanha a serie de delivery atual - uma sequencia ininterrupta de fechamentos de candles na mesma direcao - e marca o momento em que o preco fecha de volta atraves da ABERTURA dessa serie. Esse fechamento e o CISD: o ponto em que o delivery de curto prazo muda de vendas para compras, ou o contrario. Um CISD e marcado por serie, e o corpo do candle deve fechar atraves do nivel (pavios nao contam). Tudo

Rumer Magic Lines - Previous Day High Low, Swing Levels, Session Opening Candles and Smart Arrows for MT5
Rumer Magic Lines is an automatic support and resistance indicator for MetaTrader 5. It draws the previous day high and low, the previous day midline, the true swing high and swing low, and the first M15 candle of the Asia, London and New York sessions on your chart, then tracks a three-stage price action setup at those levels and shows it with colour-coded arrows, stop and target lines an

VSA Fusion Structure Pro — MT4 Advanced Volume Spread Analysis, Market Structure, Order Blocks and Fair Value Gaps for MetaTrader 4 VSA Fusion Structure Pro is a comprehensive technical analysis indicator designed to help traders understand market structure, volume behavior, price movement and potential reaction zones. By combining Volume Spread Analysis (VSA) with Smart Money Concepts, the indicator provides a unified approach to analyzing buying and selling pressure, identifying important pric

Welcome
Please ENJOY the indicator with me for now.
I will add a full Description soon.
For now, the indicator is easy to just load with no adjustments needed.
I have a couple of these indicators, and will, over time, we will see which ones you want or which functions they should have.
The Price is very Low. Hurry!!
Meanwhile have a look at the other products available as well.
Happy trading. Feel free to ask if you have any questions.

EURUSD SEASONALITY SUITE 27 Years of EUR/USD History. Seasonal Projections. London Fix Research. Historical Probability Analysis. The complete EUR/USD seasonality toolkit, with 27 years of real EUR/USD history built in, forward-looking seasonal projections, London fix and calendar research, and percentages measured directly from historical EUR/USD prices. EURUSD Seasonality Suite shows you directly on your chart how EUR/USD has historically behaved at this time of year, during this week of the

Charts247 Wave Master MTF
A complete 0-5 wave count with a built-in rules panel: it reads both directions on your chart and on a higher timeframe, grades every wave, maps the major structure and marks where price spent the most time. Closed candles only. Most wave tools leave you with numbers on a chart and the hard part still to do: is this wave worth trading, which side has the trend, and does the bigger timeframe agree? Wave Master MTF answers all three on one screen. It runs the Waves of S

Breakout Box Radar - Box di Struttura di Mercato Istituzionale di Alessandro Michele Ventrella Stanchi di ridisegnare gli indicatori? Breakout Box Radar è uno strumento istituzionale basato sulla price action. Questo indicatore calcola automaticamente la struttura storica del mercato e completa la sua formazione alle 08:00 ora del server, contrassegnando la zona esatta in cui si è accumulata la liquidità. Nessuna impostazione da ottimizzare. Nessun ridisegno. Livelli solisti. COME FUNZIONE: Cal

- Real price is 200$ - Discount (one purchase is 35$ now) Contact me for instruction, any questions! - Lifetime update free - Non-repaint - I just sell my products in Elif Kaya Profile, any other websites are stolen old versions, So no any new updates or support. DESCRIPTION Most supply and demand indicators just draw boxes. Supply and Demand Smart Trading tells you what to do with them.
It grades every zone in real time and shows whether the setup is a bounce or a breakout. When everything l

FX777 Turbo Turn: The Quantum Threshold of Market Momentum Step beyond the ordinary boundaries of technical analysis and enter a realm where precision engineering meets the unseen flow of financial destiny. FX777 Turbo Turn is not merely a trading tool; it is a finely tuned instrument designed to capture the hidden rhythms of the market across multiple dimensions. Crafted with an uncompromising dedication to excellence and inspired by forces that transcend standard charting, this system honors a

Добрый день, коллеги!
Представляем вашему вниманию Индикатор SS_v9 Trend System PRO от компании Centron Genesis — это не просто набор стрелок, а профессиональный аналитический комплекс, созданный трейдерами для трейдеров. Мы объединили алгоритмическую математику и жесткий риск-менеджмент в одном инструменте.
ФИЛОСОФИЯ НАШЕЙ СИСТЕМЫ: Мы категорически против опасных стратегий, которые рано или поздно приводят к потере депозита. В SS_v9 PRO НЕ ИСПОЛЬЗУЮТСЯ сетки (Grid), мартингейлы или усредн

Iron Drone: The Autonomous Vanguard of Financial Multi-Dimensionality Step beyond the conventional frontiers of price tracking and immerse yourself in an elite ecosystem where mathematical divergence converges with tactical execution. Iron Drone is not just an indicator; it is a multi-layered, autonomous intelligence engine engineered to track market imbalances across every higher dimension simultaneously .
Rooted in a profound legacy of precision programming and dedicated to the enduring memo

Maria Indicators troca um gráfico lotado de indicadores separados por um único painel compacto. Todas as ferramentas já vêm embutidas, não é preciso instalar mais nada: ligue ou desligue cada ferramenta com um clique, ou carregue um preset pronto para o seu estilo de trading. O painel lembra a sua escolha em cada gráfico, então tudo volta igual depois de reiniciar ou de trocar o tempo gráfico. FERRAMENTAS NO GRÁFICO MA: média móvel rápida e lenta (períodos, método, preço e cores são parâmetros d

Supreme VWAP And Targets anchors a volume-weighted average price (VWAP) at the latest confirmed swing and waits for price to pull back to it. Once price has moved at least 1.4 ATR away from the swing, a value band opens around the anchored VWAP. A pullback into the band that is reclaimed on a closed bar becomes a BUY or a SELL with an entry, a stop and three targets. Seven filter profiles judge every reclaim side by side, and the chart shows one of them. Everything is decided when a bar closes

FX777 Correlation V3.1 MTF: The Sovereign Multi-Dimensional Protocol Step beyond ordinary correlation and immerse yourself in an elite ecosystem where multi-timeframe synchronization meets institutional-grade precision. FX777 Correlation V3.1 MTF is not just an indicator; it is a master protocol engineered to decode market alignment across multiple dimensions simultaneously.
Infused with an energetic frequency of abundance, high-vibrational discipline, and good-luck karma , this system transfo

O Big MACD exibe o indicador MACD de até quatro timeframes ao mesmo tempo, em painéis compactos posicionados diretamente no gráfico de preços. Você pode acompanhar o mercado em M15, M30, H1, H4 ou em qualquer outro timeframe escolhido, sem trocar de gráfico, e tomar decisões com o panorama multitimeframe completo à sua frente. MT5 -version: https://www.mql5.com/en/market/product/205373
O que aparece no gráfico Barra de controle. Acima dos painéis há uma barra fina. Arraste-a com o mouse para mo

NHK Liquidity HeatMap helps traders visualize potential liquidity zones directly on their MT5 charts. Identify Buy/Sell Liquidity Levels, visualize liquidity distribution through a dynamic volume profile, and locate the Point of Control (POC)—the highest liquidity area. ( MT5 Vresion ) See Where the Market Hunts Your Stops. Trade with a Liquidity Advantage!
Key Features: Buy & Sell Liquidity Zone Detection Dynamic Liquidity HeatMap Profile POC (Maximum Liquidity) Highlight Liquidity Levels Visu

FX777 Correlation V2.1 MTF: The Ultimate Multi-Timeframe Binary Options Reversal Engine Step beyond conventional trading boundaries and elevate your strategy with an elite multi-timeframe intelligence system designed specifically for the precision demands of the binary options trader . FX777 Correlation V2.1 MTF is a powerhouse instrument engineered to capture institutional market correlations and translate them into crystal-clear reversal signals across every time horizon .
Infused with an en

FX777 Gann Celestial V680 Vedic: The Cosmic Geometry & Nakshatra Protocol Step beyond conventional chart analysis and anchor your trading in the ancient, cyclical geometry of the cosmos . FX777 Gann Celestial V680 Vedic is not just an indicator; it is a master astronomical and geometric intelligence engine engineered to track planetary cycles, Vedic sidereal mechanics, and dynamic price-time squaring . Infused with an energetic frequency of abundance, high-vibrational discipline, and good-luck k

Tutorials and Strategy Guidance — Follow the Historical Triple YYY Setup You do not need to invent a trading strategy from scratch. BBMA Authority Pro already includes predefined BBMA signal combinations, historical performance analysis, and live repeat-pattern monitoring. Featured Strategy: Triple YYY Historical Repeat One of the historical combinations currently highlighted by the indicator is: E REJ + CSM | W1 | WE | HE Recorded Historical Performance: 22 Wins / 0 Losses (100% within the tes

FX777 Gann Celestial V710 Flow: The Cosmic Inertia & Signal Protocol Step beyond traditional boundaries and immerse your strategy in the ultimate synchronization of astronomical mechanics and live market momentum. FX777 Gann Celestial V710 Flow is an advanced intelligence engine engineered to track planetary cycles, mass-inertia velocity, and dynamic Gann octave projections in real time .
Infused with an energetic frequency of abundance, high-vibrational discipline, and good-luck karma , this

FX777 Liquidity 1000: The Sovereign Curved Liquidity Zone Protocol Step beyond basic support and resistance and trade right where institutional liquidity pools. FX777 Liquidity 1000 is an advanced indicator engineered to anchor dynamic, curved liquidity channels onto a heavy 1000-period Simple Moving Average (SMA) baseline, tracking the exact structural zones where price loves to reverse.
Infused with an energetic frequency of abundance, high-vibrational discipline, and good-luck karma, this s

LIMIT SNIPER PRO – PRECISION BUY & SELL SIGNALS WITH TAKE PROFIT & STOP LOSS Trade Smarter. Aim Better. Take Control. LIMIT SNIPER PRO is a powerful and user-friendly trading indicator designed to help traders identify potential BUY and SELL opportunities with clear entry signals, predefined Take Profit (TP), and Stop Loss (SL) levels. Built for traders who value precision, clarity, and disciplined trading, LIMIT SNIPER PRO helps transform complex market movements into easy-to-understand tra

BREAKOUT SNIPER PRO Smart BUY STOP & SELL STOP Trading System Catch the Breakout. Plan Your Entry. Manage Your Risk. BREAKOUT SNIPER PRO is a professional trading indicator designed for traders who want to capture potential market breakout opportunities with a structured pending order strategy. Using BUY STOP and SELL STOP levels, the indicator helps identify potential entry opportunities before price reaches key breakout levels. It automatically displays the suggested entry price, Stop Loss (SL

SUPPORT RESISTANCE EDGE Advanced Support & Resistance Trading Indicator Identify Key Market Levels. Understand Price Behavior. Make Smarter Trading Decisions. SUPPORT RESISTANCE EDGE is a professional trading indicator designed to help traders identify important Support and Resistance levels and better understand market price structure. Support and Resistance are among the most widely used concepts in technical analysis. These key price levels can help traders recognize areas where buying or sel

Smart Trend Filter Smart Trend Filter is a technical indicator for MetaTrader designed to help traders identify market trends, recognize potential BUY and SELL opportunities, and visualize trade risk and reward directly on the chart. Combining Moving Average (MA) and Average True Range (ATR) concepts, the indicator provides a dynamic trend-following framework with visual trading signals, adaptive trailing stop levels, and multiple take-profit targets. Whether you trade Forex, Gold, or other fina

Account Summary Panel: Your Trading Results at a Glance Stop digging through the History tab. This indicator puts your daily, weekly and monthly performance on your chart in one clean dashboard, updated automatically as you trade.
Your capital, your rules Set your own Initial Balance, whether that’s your full account or just the amount assigned to this month’s plan. Every percentage is measured against the number you choose.
Built-in goal tracking Enter one Weekly Goal % and the panel does th

VOLUME PROFILE S&D — Advanced Market Structure & Supply/Demand Suite Overview Volume Profile S&D is a professional-grade indicator designed to bring institutional-level volume analysis directly to MetaTrader. By mapping market liquidity through volumetric price distribution rather than simple visual highs and lows, this tool automatically identifies where real institutional transactions, accumulations, and distributions occur. Key Features: Dynamic Value Area (VAH & VAL): Automatically calculate

Draws the levels. Tracks the outcomes. Promises nothing.
Multi Timeframe Trendline Sniper Gold (MTS) is a liquidity and structure mapping tool for MetaTrader 4. If you trade gold by hand, MTS removes the chart work: no more flipping between M5, M15, M30, H1 and H4 to mark trendlines and liquidity before every session. The map is drawn on your M1 chart, labeled, and tracked, so you can focus on the decision and not on the marking.
MTS draws levels and context. It places no orders and does not

Supply and Demand Master — Non-Repaint Zone Indicator for MT4 Institutional-grade supply and demand zone indicator for MT4 Real-time pending signals, 100% non-repainting confirmed zones, 6 alert channels, signal arrows, and a live status panel. Works on every symbol and timeframe. [THE TRUTH MOST RETAIL TRADERS NEVER LEARN]
Markets don't move on news, indicators, or patterns. They move on ORDERS — and the orders that move price are left sitting at SUPPLY AND DEMAND ZONES.
Supply and Demand M

Enter/Exit indicator Try trading on signal change BUY/SELL to Sell SELL/BUY to buy or exit by signal change. - - - - - - - - - - Please leave positive comments. - - - - - - - - - - - - - - - - - - - - - - - - - - - - - - - - - - - - - - - - - - - - - - - - - - - - - - - - - Info: CalculatedBars = Indicator Calculated Bars; AlertConfirmation = true On false Off LongBarPoints = maximum point value for signal bar size. Buffer0[] = Arrow Up; Buffer1[] = Arrow Down; Buffer4[] = 1 or 0 Buy Signal Bu

QUER TER ACESSO AO HILO FLOW GESTÃO SEM PAGAR PELA LICENÇA? Conheça nossa parceria com a corretora TMGM e veja como solicitar sua licença para MetaTrader 4 ou MetaTrader 5, sem custo adicional, mediante o cumprimento das condições da parceria. ACESSE O GUIA COMPLETO:
https://dougscalper.com.br/hiloflow/ Para participar, é necessário abrir uma conta elegível pelo link da parceria, realizar um depósito inicial de US$ 200 na corretora e solicitar a licença pela Área de Membros. A liberação depende

Como funciona o indicador O Big Stoch apresenta até quatro minipainéis do oscilador Estocástico diretamente no gráfico principal de preços. Cada painel é calculado com os dados do seu próprio período gráfico e tem parâmetros independentes de %K, Slowing e %D. Assim, é possível acompanhar, por exemplo, M15, M30, H1 e H4 ao mesmo tempo, sem mudar o período do gráfico principal. Os valores do oscilador variam de 0 a 100. MT5-version: https://www.mql5.com/en/market/product/205700 Como o trader pode

Charts247 Market Structure Sessions
The full Charts247 market structure: swings, CHoCH and BOS, intraday highs and lows by session, structure trend, session read, zigzag counter, break count, alerts and a control panel. Closed candles only.
Charts247 Market Structure Sessions shows market structure the way the Waves of Success method reads it, and places each intraday high and low in the session where it printed. Everything is calculated on closed candles; nothing on history is redrawn. What

Charts247 Break and Count
Spots the moment a rising support (or falling resistance) gives way, marks the entry candle and its stop, then maps the reversal level and counts the lows (highs) beyond it: buy low, no trade, buy low, continuation. Closed candles only.
A support line that has held three times is one of the most watched structures on any chart. When it breaks, two trades follow: the break itself, and later the reversal from the exhaustion lows. Break and Count marks both, on fixed ru

Smart Trade Entry MT5 Discount: The price is $200$, But now it is just $30 for one purchase, next price is 70$. - New Scanner Panel *** Contact me to send you instruction and add you in group for sharing or seeing experiences with other users. + FREE Trading Utility MT5 Description: Smart Trade Entry indicator entries with Entry, Stop Loss and Take Profit levels, a professional panel and a multi symbol, multi timeframe scanner. Smart Trade Entry finds the moments when the market goes quiet a

Supreme Range Profile Structure finds sideways ranges from the market's own swings, shows where the volume traded inside each one, marks the moves that left the range and failed, and draws a position tool when a range finally breaks. A range is drawn only when recent swing highs and lows cluster tightly, alternate often enough, span enough bars and fit an ATR width window, so it marks a real balance rather than any pause. Breaks and failed breaks are decided on a closed bar and stay where they

Supreme Dynamic Profile builds a volume profile of the most recent bars and turns it into a set of key levels. It finds the point of control, the value area and the volume peaks of the profile, keeps them on the chart as zones and lines, and marks every bar where price breaks a level, rejects it or comes back to retest it. A table in the corner sums up where price stands against the profile. Every level and every marker is decided when a bar closes and stays where it was drawn.
- MT4 version:

Supreme Power House reads market structure, grades every signal against seven filters and draws a complete trade plan for each one. It prints a BUY or a SELL when a candle closes beyond the latest swing: a change of character (CHoCH) when the break turns the structure, a break of structure (BOS) when it continues it. Each signal comes with an entry, a stop, up to three targets and a grade from A to C, surrounded by an adaptive trend ribbon, ICT zones and a dashboard of six timeframes. Everythin

A Malaysian SnR (MSNR) indicator that draws A, V, gap and OCL levels from three timeframes, keeps track of which levels are still fresh, and reads the MSNR storyline for you. The MSNR radar watches your Market Watch and shows which symbol sits at a fresh D1 or H4 level right now. Every level and every storyline turn is confirmed on a closed candle, so the levels you see on past candles are the same levels the chart showed live. What you get All MSNR level types: A levels (resistance), V levels (

The market structure indicator helps traders easily read market trends, this indicator shows trend continuity and trend reversals, this tool will be very useful for beginners who are just getting to know market structure, the indicator will provide visualization of the patterns that occur
Key Features: 1. BOS pattern: The indicator will provide an overview of the Break Of Structure pattern, where the pattern will indicate the continuation of the trend 2. CHOCH Pattern: The indicator will provi
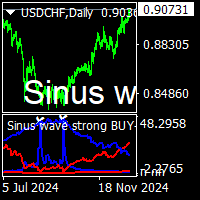
sinus wave strong buy sell indicator is nonrepaint top bottom point indicator.it work all pairs and all timeframe.suitable for beginners and experienced traders. it depend to sinus wave and vertex base .gives signal sinus wave over zero or below zero on approppirate vertex positions. cnt number has been set to 500 bars for demo mode. it can be increase to 2000 depend to charts has bar numbers. minimum value is 500. white points on red vertex spikes means sell. white points on blue vertex spikes
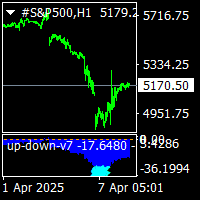
up down v7 indicator is a no repaint trend indicator.this is different version of up down v9.use different algoritm. it works all pairs and and all timeframes. dont use processed value lower than 500 bars.you can increase it acording to chart bar counts.2000-3000 there is blue histogram gives divergencies and extreme points. when gold points on histogram it gives extreme overbought. when aqua points below histogram it gives extreme oversell. for to see extreme signals switch timefremes 1m to
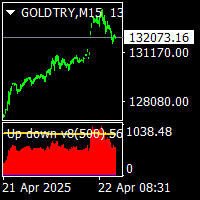
Up down v8 indicator is no repaint counter trend indicator . it try to find market up down points. it works all timeframes and all pairs. suitable for beginner and experienced trader. there is wave and c values to set defaults. minimum processed value cnt can be equal to wave value. traders can change them suitable up down points on different time frames. indicator use moving averages histograms and volatilty trigger. when red histogram is over volatility level that is tops. . when blue histogr
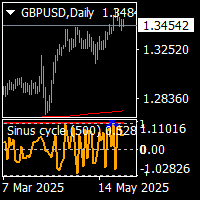
sinus cycle indicator is a non repaint indicator for mt4 terminal. it works all timeframes and all pairs. suitable for experienced traders and beginners. it gives sinus wawes .when the intensive waves appear , it is trend change points. level 1 or -1 is trend reversal . cnt numbers is the bars numbers on the chart.it can be increase ore decrease. minimum cnt value is 500. wave is default 500 value.and can not change if prices on top, cycle level 1 oe -1 means trend will down. if prices down ,c
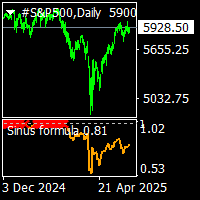
demo mode d value setled for gold. Sinus formula indicator non repaint trend indicator. it uses moving averages and sinus.. suitable for experienced trader and beginner. easy to use indicator. there is calibration constant d default d value setled for goldusd in demo backtest use only gold. d value can change acording to pairs. procedure is increase or lower d value acording to prices. when price top location increase or lover up to see red sign on level 1 when price bottom set d value blue sig
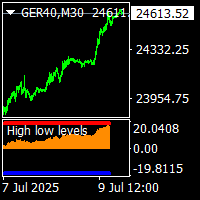
on demo mode, use date for testing. high low levels indicator is non repaint trend reversal indicator.and works all pairs and all timeframes. there is a histogram move up and down. and there is a level red and blue. when histogram reach the up red level that is top.and reversal is possible. when histogram down and reach blue level that is prices oversold and possible reversal up. this indicator suitable for beginners and experienced traders. it need to check all timeframes to see reversal signs.

REAL RAW| Suite per volumi istituzionali e blocchi di ordini REAL RAW è un indicatore di trading professionale all'avanguardia e ultra-preciso, progettato per i trader d'élite che esigono assoluta trasparenza dal mercato. Realizzato senza smoothing artificiale o filtri matematici ritardati, questo strumento opera al 100% su dati istituzionali grezzi per rivelare le reali tracce del capitale investito, i principali pool di liquidità e le zone di accumulazione ad alto volume in cui viene impiegat
Você sabe por que o mercado MetaTrader é o melhor lugar para vender as estratégias de negociação e indicadores técnicos? Não há necessidade de propaganda ou software de proteção, muito menos problemas de pagamentos. Tudo é providenciado no mercado MetaTrader.

Você está perdendo oportunidades de negociação:
- Aplicativos de negociação gratuitos
- 8 000+ sinais para cópia
- Notícias econômicas para análise dos mercados financeiros
Registro
Login
Você concorda com a política do site e com os termos de uso
Se você não tem uma conta, por favor registre-se