 MetaTrader 5
 Эксперты
 Индикаторы
 Библиотеки
 Утилиты
 Виджеты
 Правила
Смотри обучающее видео по маркету на YouTube
Как купить торгового робота или индикатор
Запусти робота на
виртуальном хостинге
виртуальном хостинге
Протестируй индикатор/робота перед покупкой
Хочешь зарабатывать в Маркете?
Как подать продукт, чтобы его покупали
Технические индикаторы для MetaTrader 4 - 179
 На основании сигналов технических индикаторов из списка ниже вы сможете принимать решения относительно открытия или закрытия сделки в платформе MetaTrader 4.
Работа индикаторов заключается в математическом преобразовании цены и/или объемов финансового инструмента для прогнозирования изменений цен.

Overview MERAZ BO Sniper PRO is a multi-factor signal indicator designed for short-expiry binary options trading, especially 60-second trades on the M1 chart. Instead of relying on a single oscillator, it combines ten independent market factors into one weighted quality score (0–100) and shows an arrow only when enough factors agree. Every signal is calculated from the closed candle and drawn at the open of the next candle . That next candle is your entry candle. Signals do not repaint or disapp

Elder Ray Confluence MT4 Six readings, one confluence score, non-repainting closed-candle signals Elder Ray Confluence builds on Dr. Alexander Elder’s classic Bull Power / Bear Power study. Instead of reading two histograms by eye and guessing whether a move is real, you get six separate readings that are checked against each other. When enough of them agree, you see it as one clear score and one clear arrow. Non-repainting STRONG BUY / SELL arrows are decided when the candle closes, using clos

Одна доска, двадцать восемь символов и показание импульса, достаточно спокойное, чтобы ему верить. SMI Ergodic Scanner гоняет дважды сглаженный индекс Блау по четырём таймфреймам на символ, градуирует пересечение по тому, случилось ли оно за уровнями, и держит осциллятор под доской, чтобы пересечение можно было проверить глазами. Цена растёт на $10 каждые 10 покупок. SMI Ergodic Scanner это два продукта в одном файле. Первый это сам индекс SMI Ergodic, в собственном окне этого графика: индекс, е

Самое чистое трендовое чтение, которое Хейкин-Аши способен дать, по всему списку наблюдения. Smoothed Heikin Ashi Scanner гоняет дважды сглаженную свечу по двадцати восьми символам и четырём таймфреймам, сортирует доску по тому, что развернулось последним, и держит график снизу, чтобы тело свечи было видно до действия. Цена растёт на $10 каждые 10 покупок. Smoothed Heikin Ashi Scanner это два продукта в одном файле. Первый это сам Smoothed Heikin Ashi, нарисованный на графике перед вами: сглажен

Какой из ваших символов только что пробил уровень, на котором сидело большинство его пивотов. S/R Channels Scanner строит сильнейший канал на символ по четырём таймфреймам, градуирует каждую ячейку числом пивотов, держащих этот канал, и держит график под доской, чтобы уровень и пробой были видны до действия. Цена растёт на $10 каждые 10 покупок. S/R Channels Scanner это два продукта в одном файле. Первый это сам S/R Channels, нарисованный на графике перед вами: сильнейший канал, его середина и с

Разворотные фигуры, ранжированные по силе, а не просто перечисленные. Three Bar Reversal Scanner находит разворот из трёх баров на двадцати восьми символах и четырёх таймфреймах, градуирует каждую ячейку по тому, насколько сильно третий бар закрылся за уровнем, и держит график под доской, чтобы фигуру было видно до сделки. Цена растёт на $10 каждые 10 покупок. Three Bar Reversal Scanner это два продукта в одном файле. Первый это сам Three Bar Reversal, нарисованный на графике перед вами: уровень

Ступенчатый фильтр, который не тараторит, по всему списку наблюдения. Twin Range Filter Scanner ведёт линию двойного диапазона по двадцати восьми символам и четырём таймфреймам, сортирует доску по тому, что развернулось последним, и говорит одной колонкой, сколько таймфреймов согласны, а график снизу готов для входа. Цена растёт на $10 каждые 10 покупок. Twin Range Filter Scanner это два продукта в одном файле. Первый это сам Twin Range Filter, нарисованный на графике перед вами: ступенчатая лин

Адаптивный трейлинг-стоп, прочитанный по двадцати восьми символам сразу. Var Trail Tracker Scanner гоняет опорную среднюю VAR и её процентный трейл по четырём таймфреймам на символ, сортирует по тому, что пересеклось последним, и держит график под доской, чтобы обе линии были видны до сделки. Цена растёт на $10 каждые 10 покупок. Var Trail Tracker Scanner это два продукта в одном файле. Первый это сам Var Trail Tracker, нарисованный на графике перед вами: опорная средняя, трейл-линия, нарисованн

Доска, которая загорается только тогда, когда рынок действительно пошёл. Volatility Explosion Scanner следит за двадцатью восемью символами на четырёх таймфреймах в ожидании бара, где импульс впервые прошёл оба порога, градуирует всплеск по тому, насколько далеко за порог он ушёл, и держит осциллятор под доской, чтобы всплеск был виден до входа. Цена растёт на $10 каждые 10 покупок. Volatility Explosion Scanner это два продукта в одном файле. Первый это сам Volatility Explosion, в собственном ок

Вращение, измеренное по всему списку наблюдения. Vortex Indicator Scanner гоняет пару VI по двадцати восьми символам и четырём таймфреймам, градуирует пересечение по силе ведущей линии в момент, когда оно случилось, и держит осциллятор под доской, чтобы пересечение можно было проверить до действия. Цена растёт на $10 каждые 10 покупок. Vortex Indicator Scanner это два продукта в одном файле. Первый это сам Vortex Indicator, в собственном окне этого графика: VI плюс, VI минус и гистограмма разрыв

Капитуляция, замеченная по двадцати восьми символам раньше, чем вы дочитаете первый график. Williams Vix Fix Scanner гоняет измеритель страха по четырём таймфреймам на символ, градуирует каждую ячейку по тому, насколько экстремальным было показание, и держит осциллятор под доской, чтобы зона была видна до действия. Цена растёт на $10 каждые 10 покупок. Williams Vix Fix Scanner это два продукта в одном файле. Первый это сам Williams Vix Fix, в собственном окне этого графика: измеритель страха, ег

Быстрая трендовая линия, которая всё равно отказывается переворачиваться на шуме, по всему списку наблюдения. Zero-Lag Trend Scanner гоняет среднюю с нулевой задержкой и её волатильностную полосу по двадцати восьми символам и четырём таймфреймам, сортирует по тому, что пробилось последним, и держит график под доской, чтобы пробой был виден до входа. Цена растёт на $10 каждые 10 покупок. Zero-Lag Trend Scanner это два продукта в одном файле. Первый это сам Zero-Lag Trend, нарисованный на графике

Crypto_Forex Индикатор "DeMarker FLAT Detector" — эффективный вспомогательный инструмент в трейдинге! Не перерисовывается. Предлагаю вам усовершенствовать свои методы торговли с помощью этого отличного индикатора для MT4. — Индикатор отображает на графике области флэта. Он имеет параметр "Чувствительность флэта", отвечающий за обнаружение флэта. — "DeMarker FLAT Detector" можно использовать для подтверждения входов по Price Action или в сочетании с другими индикаторами. — Его можно использовать

Индикатор Crypto_Forex "Поглощающий бар" для MT4, без перерисовки и задержки. - Индикатор "Поглощающий бар" — очень мощный индикатор для торговли по Price Action. - Индикатор распознаёт паттерны "Поглощающий бар" на графике: - Бычий "Поглощающий бар" — сигнал в виде синей стрелки на графике (см. изображения). - Медвежий "Поглощающий бар" — сигнал в виде красной стрелки на графике (см. изображения). - С оповещениями на ПК, мобильном телефоне и электронной почте. - Индикатор "Поглощающий бар" отл

SIO Oscillator: самооптимизирующийся осциллятор дисбаланса семивариаций Купите индикатор и получите советник (EA) на его основе БЕСПЛАТНО. Большинство осцилляторов воспринимают любое движение цены одинаково. SIO разделяет давление покупателей и продавцов и измеряет дисбаланс между ними, показывая, какая сторона действительно контролирует рынок. Когда дисбаланс достигает экстремума, SIO выдаёт чёткий сигнал с уровнями входа, Stop Loss и Take Profit. Главное отличие SIO в том, что он не полагается

Индикатор Crypto_Forex «Взвешенный RSI Cci Stoch Oscillator» для MT4, без перерисовки. - Этот уникальный индикатор объединяет 3 в 1: RSI, CCI и Stochastic для расчета! - Точные возможности импульсной торговли с этим программным обеспечением - см. примеры на картинках. - Индикатор состоит из 3 линий: - Сам Weighted Rsi Cci Stoch Oscillator (синий цвет); - Быстрая скользящая средняя осциллятора (желтый цвет); - Медленная скользящая средняя осциллятора (красный цвет); - Зона выше 50 - зона перекуп

Manual Volume Profile MS shows where volume was actually traded. It draws today's session profile live and lets you place up to 10 independent volume profile ranges anywhere on the chart with two mouse clicks. Every profile shows the POC, VAH, VAL and the Value Area. KEY FEATURES Daily profile – today's volume profile, drawn to the right of the current bar or over the day's bars, updated live. Manual ranges PV 1 – PV 10 – click a PV button, click the start and the end of the range, and the profi

Spread Guardian is a professional broker execution auditing utility designed to monitor and log real-time Bid/Ask spreads and volatility directly on your chart.
While brokers often advertise fixed or typical tight spreads, true market execution costs fluctuate continuously during liquidity shifts, major macroeconomic releases, and daily rollover windows (21:00–23:00 GMT). Spread Guardian provides complete empirical transparency regarding your actual trading costs.
### KEY FEATURES
* Tick-by

Volume Comparator is an institutional-grade intraday volume analysis utility designed to benchmark market activity against historical norms for the exact time of day.
Standard volume indicators evaluate volume strictly in isolation or against immediately preceding bars. However, financial markets follow systematic diurnal cycles: regular opening session bursts, scheduled algorithmic liquidity handoffs, and subdued quiet hours. A high-volume bar during the London Open is completely normal, where

Индикатор Crypto_Forex "PINBAR Pattern" для MT4, без перерисовки и задержек. - Индикатор "PINBAR Pattern" — очень мощный индикатор для торговли по Price Action. - Индикатор распознаёт пин-бары на графике: - Бычий пин-бар — сигнал в виде синей стрелки на графике (см. изображения). - Медвежий пин-бар — сигнал в виде красной стрелки на графике (см. изображения). - С оповещениями на ПК, мобильном телефоне и электронной почте. - Индикатор "PINBAR Pattern" отлично сочетается с уровнями поддержки/сопр

ICT CISD реализует концепцию Change in State of Delivery из методологии ICT. Индикатор отслеживает текущую серию доставки - непрерывную последовательность закрытий свечей в одном направлении - и отмечает момент, когда цена закрывается обратно через ОТКРЫТИЕ этой серии. Это и есть CISD: точка, где краткосрочная доставка меняется с продаж на покупки или наоборот. На каждую серию отмечается один CISD, и уровень должно пробить тело свечи (тени не считаются). Все рисуется прямо на графике: линия уров

Rumer Magic Lines - Previous Day High Low, Swing Levels, Session Opening Candles and Smart Arrows for MT5
Rumer Magic Lines is an automatic support and resistance indicator for MetaTrader 5. It draws the previous day high and low, the previous day midline, the true swing high and swing low, and the first M15 candle of the Asia, London and New York sessions on your chart, then tracks a three-stage price action setup at those levels and shows it with colour-coded arrows, stop and target lines an

VSA Fusion Structure Pro — MT4 Advanced Volume Spread Analysis, Market Structure, Order Blocks and Fair Value Gaps for MetaTrader 4 VSA Fusion Structure Pro is a comprehensive technical analysis indicator designed to help traders understand market structure, volume behavior, price movement and potential reaction zones. By combining Volume Spread Analysis (VSA) with Smart Money Concepts, the indicator provides a unified approach to analyzing buying and selling pressure, identifying important pric

Welcome
Please ENJOY the indicator with me for now.
I will add a full Description soon.
For now, the indicator is easy to just load with no adjustments needed.
I have a couple of these indicators, and will, over time, we will see which ones you want or which functions they should have.
The Price is very Low. Hurry!!
Meanwhile have a look at the other products available as well.
Happy trading. Feel free to ask if you have any questions.

EURUSD SEASONALITY SUITE 27 Years of EUR/USD History. Seasonal Projections. London Fix Research. Historical Probability Analysis. The complete EUR/USD seasonality toolkit, with 27 years of real EUR/USD history built in, forward-looking seasonal projections, London fix and calendar research, and percentages measured directly from historical EUR/USD prices. EURUSD Seasonality Suite shows you directly on your chart how EUR/USD has historically behaved at this time of year, during this week of the

Charts247 Wave Master MTF
A complete 0-5 wave count with a built-in rules panel: it reads both directions on your chart and on a higher timeframe, grades every wave, maps the major structure and marks where price spent the most time. Closed candles only. Most wave tools leave you with numbers on a chart and the hard part still to do: is this wave worth trading, which side has the trend, and does the bigger timeframe agree? Wave Master MTF answers all three on one screen. It runs the Waves of S

Breakout Box Radar - Box di Struttura di Mercato Istituzionale di Alessandro Michele Ventrella Stanchi di ridisegnare gli indicatori? Breakout Box Radar è uno strumento istituzionale basato sulla price action. Questo indicatore calcola automaticamente la struttura storica del mercato e completa la sua formazione alle 08:00 ora del server, contrassegnando la zona esatta in cui si è accumulata la liquidità. Nessuna impostazione da ottimizzare. Nessun ridisegno. Livelli solisti. COME FUNZIONE: Cal

- Real price is 200$ - Discount (one purchase is 35$ now) Contact me for instruction, any questions! - Lifetime update free - Non-repaint - I just sell my products in Elif Kaya Profile, any other websites are stolen old versions, So no any new updates or support. DESCRIPTION Most supply and demand indicators just draw boxes. Supply and Demand Smart Trading tells you what to do with them.
It grades every zone in real time and shows whether the setup is a bounce or a breakout. When everything l

FX777 Turbo Turn: The Quantum Threshold of Market Momentum Step beyond the ordinary boundaries of technical analysis and enter a realm where precision engineering meets the unseen flow of financial destiny. FX777 Turbo Turn is not merely a trading tool; it is a finely tuned instrument designed to capture the hidden rhythms of the market across multiple dimensions. Crafted with an uncompromising dedication to excellence and inspired by forces that transcend standard charting, this system honors a

Добрый день, коллеги!
Представляем вашему вниманию Индикатор SS_v9 Trend System PRO от компании Centron Genesis — это не просто набор стрелок, а профессиональный аналитический комплекс, созданный трейдерами для трейдеров. Мы объединили алгоритмическую математику и жесткий риск-менеджмент в одном инструменте.
ФИЛОСОФИЯ НАШЕЙ СИСТЕМЫ: Мы категорически против опасных стратегий, которые рано или поздно приводят к потере депозита. В SS_v9 PRO НЕ ИСПОЛЬЗУЮТСЯ сетки (Grid), мартингейлы или усредн

Box Theory Indicator
This is a free educational indicator that implements the core visual concept of the "Box Theory" trading approach.
Features: • Draws a box using the previous day's High and Low • Projects the box forward for the current day (24-hour width) • Optional middle line • Price labels (High / Mid / Low) • Height can be updated only during the first X minutes of the day (default 15 minutes) • Clean and lightweight (uses chart objects only)
Inspired by the free video: "How to trad
FREE

Iron Drone: The Autonomous Vanguard of Financial Multi-Dimensionality Step beyond the conventional frontiers of price tracking and immerse yourself in an elite ecosystem where mathematical divergence converges with tactical execution. Iron Drone is not just an indicator; it is a multi-layered, autonomous intelligence engine engineered to track market imbalances across every higher dimension simultaneously .
Rooted in a profound legacy of precision programming and dedicated to the enduring memo

Maria Indicators заменяет перегруженный график с десятком отдельных индикаторов одной компактной панелью. Все инструменты встроены, ничего дополнительно устанавливать не нужно: включайте и выключайте инструмент одним кликом или загружайте готовый пресет под свой стиль торговли. Панель запоминает выбор для каждого графика, поэтому после перезапуска терминала или смены таймфрейма всё возвращается в том же виде. ИНСТРУМЕНТЫ НА ГРАФИКЕ MA: быстрая и медленная скользящие средние (периоды, метод, цена

Supreme VWAP And Targets anchors a volume-weighted average price (VWAP) at the latest confirmed swing and waits for price to pull back to it. Once price has moved at least 1.4 ATR away from the swing, a value band opens around the anchored VWAP. A pullback into the band that is reclaimed on a closed bar becomes a BUY or a SELL with an entry, a stop and three targets. Seven filter profiles judge every reclaim side by side, and the chart shows one of them. Everything is decided when a bar closes

FX777 Correlation V3.1 MTF: The Sovereign Multi-Dimensional Protocol Step beyond ordinary correlation and immerse yourself in an elite ecosystem where multi-timeframe synchronization meets institutional-grade precision. FX777 Correlation V3.1 MTF is not just an indicator; it is a master protocol engineered to decode market alignment across multiple dimensions simultaneously.
Infused with an energetic frequency of abundance, high-vibrational discipline, and good-luck karma , this system transfo

Big MACD показывает индикатор MACD сразу на нескольких таймфреймах (до четырёх одновременно) в компактных панелях прямо на графике цены. Не нужно переключать графики: состояние рынка на M15, M30, H1, H4 или на любых выбранных вами таймфреймах видно одновременно, и решения принимаются с учётом всей картины. MT5-version: https://www.mql5.com/en/market/product/205373 Что отображается на графике Полоска управления. Над панелями расположена тонкая полоска. Потяните за неё мышью, и весь блок перемести

NHK Liquidity HeatMap helps traders visualize potential liquidity zones directly on their MT5 charts. Identify Buy/Sell Liquidity Levels, visualize liquidity distribution through a dynamic volume profile, and locate the Point of Control (POC)—the highest liquidity area. ( MT5 Vresion ) See Where the Market Hunts Your Stops. Trade with a Liquidity Advantage!
Key Features: Buy & Sell Liquidity Zone Detection Dynamic Liquidity HeatMap Profile POC (Maximum Liquidity) Highlight Liquidity Levels Visu

FX777 Correlation V2.1 MTF: The Ultimate Multi-Timeframe Binary Options Reversal Engine Step beyond conventional trading boundaries and elevate your strategy with an elite multi-timeframe intelligence system designed specifically for the precision demands of the binary options trader . FX777 Correlation V2.1 MTF is a powerhouse instrument engineered to capture institutional market correlations and translate them into crystal-clear reversal signals across every time horizon .
Infused with an en

FX777 Gann Celestial V680 Vedic: The Cosmic Geometry & Nakshatra Protocol Step beyond conventional chart analysis and anchor your trading in the ancient, cyclical geometry of the cosmos . FX777 Gann Celestial V680 Vedic is not just an indicator; it is a master astronomical and geometric intelligence engine engineered to track planetary cycles, Vedic sidereal mechanics, and dynamic price-time squaring . Infused with an energetic frequency of abundance, high-vibrational discipline, and good-luck k

Tutorials and Strategy Guidance — Follow the Historical Triple YYY Setup You do not need to invent a trading strategy from scratch. BBMA Authority Pro already includes predefined BBMA signal combinations, historical performance analysis, and live repeat-pattern monitoring. Featured Strategy: Triple YYY Historical Repeat One of the historical combinations currently highlighted by the indicator is: E REJ + CSM | W1 | WE | HE Recorded Historical Performance: 22 Wins / 0 Losses (100% within the tes

FX777 Gann Celestial V710 Flow: The Cosmic Inertia & Signal Protocol Step beyond traditional boundaries and immerse your strategy in the ultimate synchronization of astronomical mechanics and live market momentum. FX777 Gann Celestial V710 Flow is an advanced intelligence engine engineered to track planetary cycles, mass-inertia velocity, and dynamic Gann octave projections in real time .
Infused with an energetic frequency of abundance, high-vibrational discipline, and good-luck karma , this

FX777 Liquidity 1000: The Sovereign Curved Liquidity Zone Protocol Step beyond basic support and resistance and trade right where institutional liquidity pools. FX777 Liquidity 1000 is an advanced indicator engineered to anchor dynamic, curved liquidity channels onto a heavy 1000-period Simple Moving Average (SMA) baseline, tracking the exact structural zones where price loves to reverse.
Infused with an energetic frequency of abundance, high-vibrational discipline, and good-luck karma, this s

LIMIT SNIPER PRO – PRECISION BUY & SELL SIGNALS WITH TAKE PROFIT & STOP LOSS Trade Smarter. Aim Better. Take Control. LIMIT SNIPER PRO is a powerful and user-friendly trading indicator designed to help traders identify potential BUY and SELL opportunities with clear entry signals, predefined Take Profit (TP), and Stop Loss (SL) levels. Built for traders who value precision, clarity, and disciplined trading, LIMIT SNIPER PRO helps transform complex market movements into easy-to-understand tra

BREAKOUT SNIPER PRO Smart BUY STOP & SELL STOP Trading System Catch the Breakout. Plan Your Entry. Manage Your Risk. BREAKOUT SNIPER PRO is a professional trading indicator designed for traders who want to capture potential market breakout opportunities with a structured pending order strategy. Using BUY STOP and SELL STOP levels, the indicator helps identify potential entry opportunities before price reaches key breakout levels. It automatically displays the suggested entry price, Stop Loss (SL

SUPPORT RESISTANCE EDGE Advanced Support & Resistance Trading Indicator Identify Key Market Levels. Understand Price Behavior. Make Smarter Trading Decisions. SUPPORT RESISTANCE EDGE is a professional trading indicator designed to help traders identify important Support and Resistance levels and better understand market price structure. Support and Resistance are among the most widely used concepts in technical analysis. These key price levels can help traders recognize areas where buying or sel

Smart Trend Filter Smart Trend Filter is a technical indicator for MetaTrader designed to help traders identify market trends, recognize potential BUY and SELL opportunities, and visualize trade risk and reward directly on the chart. Combining Moving Average (MA) and Average True Range (ATR) concepts, the indicator provides a dynamic trend-following framework with visual trading signals, adaptive trailing stop levels, and multiple take-profit targets. Whether you trade Forex, Gold, or other fina

Account Summary Panel: Your Trading Results at a Glance Stop digging through the History tab. This indicator puts your daily, weekly and monthly performance on your chart in one clean dashboard, updated automatically as you trade.
Your capital, your rules Set your own Initial Balance, whether that’s your full account or just the amount assigned to this month’s plan. Every percentage is measured against the number you choose.
Built-in goal tracking Enter one Weekly Goal % and the panel does th

VOLUME PROFILE S&D — Advanced Market Structure & Supply/Demand Suite Overview Volume Profile S&D is a professional-grade indicator designed to bring institutional-level volume analysis directly to MetaTrader. By mapping market liquidity through volumetric price distribution rather than simple visual highs and lows, this tool automatically identifies where real institutional transactions, accumulations, and distributions occur. Key Features: Dynamic Value Area (VAH & VAL): Automatically calculate

Draws the levels. Tracks the outcomes. Promises nothing.
Multi Timeframe Trendline Sniper Gold (MTS) is a liquidity and structure mapping tool for MetaTrader 4. If you trade gold by hand, MTS removes the chart work: no more flipping between M5, M15, M30, H1 and H4 to mark trendlines and liquidity before every session. The map is drawn on your M1 chart, labeled, and tracked, so you can focus on the decision and not on the marking.
MTS draws levels and context. It places no orders and does not

Supply and Demand Master — Non-Repaint Zone Indicator for MT4 Institutional-grade supply and demand zone indicator for MT4 Real-time pending signals, 100% non-repainting confirmed zones, 6 alert channels, signal arrows, and a live status panel. Works on every symbol and timeframe. [THE TRUTH MOST RETAIL TRADERS NEVER LEARN]
Markets don't move on news, indicators, or patterns. They move on ORDERS — and the orders that move price are left sitting at SUPPLY AND DEMAND ZONES.
Supply and Demand M

Enter/Exit indicator Try trading on signal change BUY/SELL to Sell SELL/BUY to buy or exit by signal change. - - - - - - - - - - Please leave positive comments. - - - - - - - - - - - - - - - - - - - - - - - - - - - - - - - - - - - - - - - - - - - - - - - - - - - - - - - - - Info: CalculatedBars = Indicator Calculated Bars; AlertConfirmation = true On false Off LongBarPoints = maximum point value for signal bar size. Buffer0[] = Arrow Up; Buffer1[] = Arrow Down; Buffer4[] = 1 or 0 Buy Signal Bu

WANT TO GET HILO FLOW MANAGEMENT WITHOUT PAYING FOR THE INDICATOR LICENSE? Discover our partnership with TMGM and learn how to request your Hilo Flow Management license for MetaTrader 4 or MetaTrader 5 at no additional license cost, subject to the partnership requirements. ACCESS THE COMPLETE STEP-BY-STEP GUIDE:
https://dougscalper.com.br/hiloflow/ To qualify, you must open an eligible account through the partnership link, make an initial deposit of US$200 with TMGM, and submit your license req

Big Stoch выводит на основной график цены до четырёх мини-панелей стохастического осциллятора (Stochastic) для разных таймфреймов. Каждая панель рассчитывается по истории выбранного таймфрейма и имеет собственные параметры %K, Slowing и %D. Поэтому можно одновременно наблюдать, например, M15, M30, H1 и H4, не переключая основной график. Значения осциллятора находятся в диапазоне от 0 до 100. MT5-version: https://www.mql5.com/en/market/product/205700 Как трейдер может использовать индикатор Индик

Charts247 Market Structure Sessions
The full Charts247 market structure: swings, CHoCH and BOS, intraday highs and lows by session, structure trend, session read, zigzag counter, break count, alerts and a control panel. Closed candles only.
Charts247 Market Structure Sessions shows market structure the way the Waves of Success method reads it, and places each intraday high and low in the session where it printed. Everything is calculated on closed candles; nothing on history is redrawn. What

Charts247 Break and Count
Spots the moment a rising support (or falling resistance) gives way, marks the entry candle and its stop, then maps the reversal level and counts the lows (highs) beyond it: buy low, no trade, buy low, continuation. Closed candles only.
A support line that has held three times is one of the most watched structures on any chart. When it breaks, two trades follow: the break itself, and later the reversal from the exhaustion lows. Break and Count marks both, on fixed ru

Smart Trade Entry MT5 Discount: The price is $200$, But now it is just $30 for one purchase, next price is 70$. - New Scanner Panel *** Contact me to send you instruction and add you in group for sharing or seeing experiences with other users. + FREE Trading Utility MT5 Description: Smart Trade Entry indicator entries with Entry, Stop Loss and Take Profit levels, a professional panel and a multi symbol, multi timeframe scanner. Smart Trade Entry finds the moments when the market goes quiet a

VELTIS RegimeScope MT4
RegimeScope is an analysis panel for MetaTrader 4. It shows what kind of market the chart is in, whether the other timeframes agree with it, and how price moved after similar situations in the history of the same symbol and timeframe. The indicator does not open trades and does not give buy or sell signals. It is meant as context for your own trading decisions.
A step-by-step user manual with every element of the panel explained is available in the author's MQL5 blog
FREE

WatchCat RR Basic — free visual Long/Short position (RR) planner for MetaTrader.
• Drag entry, take-profit, stop-loss, and box width • Corner handles + double-click (or press L) to flip Long/Short • Risk-% lot size from Balance or Equity • Mid label: Price, RR, Lots • Auto-fits TP/SL height and box width to the chart on attach / timeframe change • Always visible while the indicator is attached (no show/hide button) • SL/TP labels show price only (no account-currency money amounts) • Entry snaps
FREE

Supreme Range Profile Structure finds sideways ranges from the market's own swings, shows where the volume traded inside each one, marks the moves that left the range and failed, and draws a position tool when a range finally breaks. A range is drawn only when recent swing highs and lows cluster tightly, alternate often enough, span enough bars and fit an ATR width window, so it marks a real balance rather than any pause. Breaks and failed breaks are decided on a closed bar and stay where they

Supreme Dynamic Profile builds a volume profile of the most recent bars and turns it into a set of key levels. It finds the point of control, the value area and the volume peaks of the profile, keeps them on the chart as zones and lines, and marks every bar where price breaks a level, rejects it or comes back to retest it. A table in the corner sums up where price stands against the profile. Every level and every marker is decided when a bar closes and stays where it was drawn.
- MT4 version:

Supreme Power House reads market structure, grades every signal against seven filters and draws a complete trade plan for each one. It prints a BUY or a SELL when a candle closes beyond the latest swing: a change of character (CHoCH) when the break turns the structure, a break of structure (BOS) when it continues it. Each signal comes with an entry, a stop, up to three targets and a grade from A to C, surrounded by an adaptive trend ribbon, ICT zones and a dashboard of six timeframes. Everythin

A Malaysian SnR (MSNR) indicator that draws A, V, gap and OCL levels from three timeframes, keeps track of which levels are still fresh, and reads the MSNR storyline for you. The MSNR radar watches your Market Watch and shows which symbol sits at a fresh D1 or H4 level right now. Every level and every storyline turn is confirmed on a closed candle, so the levels you see on past candles are the same levels the chart showed live. What you get All MSNR level types: A levels (resistance), V levels (

The market structure indicator helps traders easily read market trends, this indicator shows trend continuity and trend reversals, this tool will be very useful for beginners who are just getting to know market structure, the indicator will provide visualization of the patterns that occur
Key Features: 1. BOS pattern: The indicator will provide an overview of the Break Of Structure pattern, where the pattern will indicate the continuation of the trend 2. CHOCH Pattern: The indicator will provi
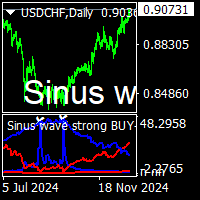
sinus wave strong buy sell indicator is nonrepaint top bottom point indicator.it work all pairs and all timeframe.suitable for beginners and experienced traders. it depend to sinus wave and vertex base .gives signal sinus wave over zero or below zero on approppirate vertex positions. cnt number has been set to 500 bars for demo mode. it can be increase to 2000 depend to charts has bar numbers. minimum value is 500. white points on red vertex spikes means sell. white points on blue vertex spikes
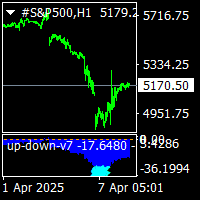
up down v7 indicator is a no repaint trend indicator.this is different version of up down v9.use different algoritm. it works all pairs and and all timeframes. dont use processed value lower than 500 bars.you can increase it acording to chart bar counts.2000-3000 there is blue histogram gives divergencies and extreme points. when gold points on histogram it gives extreme overbought. when aqua points below histogram it gives extreme oversell. for to see extreme signals switch timefremes 1m to
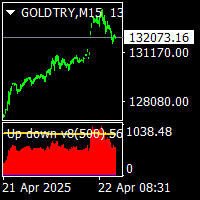
Up down v8 indicator is no repaint counter trend indicator . it try to find market up down points. it works all timeframes and all pairs. suitable for beginner and experienced trader. there is wave and c values to set defaults. minimum processed value cnt can be equal to wave value. traders can change them suitable up down points on different time frames. indicator use moving averages histograms and volatilty trigger. when red histogram is over volatility level that is tops. . when blue histogr
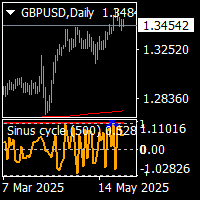
sinus cycle indicator is a non repaint indicator for mt4 terminal. it works all timeframes and all pairs. suitable for experienced traders and beginners. it gives sinus wawes .when the intensive waves appear , it is trend change points. level 1 or -1 is trend reversal . cnt numbers is the bars numbers on the chart.it can be increase ore decrease. minimum cnt value is 500. wave is default 500 value.and can not change if prices on top, cycle level 1 oe -1 means trend will down. if prices down ,c
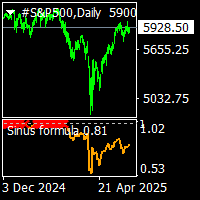
demo mode d value setled for gold. Sinus formula indicator non repaint trend indicator. it uses moving averages and sinus.. suitable for experienced trader and beginner. easy to use indicator. there is calibration constant d default d value setled for goldusd in demo backtest use only gold. d value can change acording to pairs. procedure is increase or lower d value acording to prices. when price top location increase or lover up to see red sign on level 1 when price bottom set d value blue sig
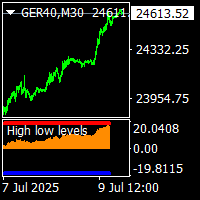
on demo mode, use date for testing. high low levels indicator is non repaint trend reversal indicator.and works all pairs and all timeframes. there is a histogram move up and down. and there is a level red and blue. when histogram reach the up red level that is top.and reversal is possible. when histogram down and reach blue level that is prices oversold and possible reversal up. this indicator suitable for beginners and experienced traders. it need to check all timeframes to see reversal signs.
MetaTrader Маркет - единственный магазин, где можно скачать демоверсию торгового робота и подвергнуть его проверке и даже оптимизации на исторических данных.
Прочитайте описание и отзывы других покупателей на заинтересовавший вас продукт, скачайте его прямо в терминал и узнайте, как протестировать торгового робота перед покупкой. Только у нас вы можете получить представление о программе, не заплатив за неё.

Вы упускаете торговые возможности:
- Бесплатные приложения для трейдинга
- 8 000+ сигналов для копирования
- Экономические новости для анализа финансовых рынков
Регистрация
Вход
Вы принимаете политику сайта и условия использования
Если у вас нет учетной записи, зарегистрируйтесь