JP NEW Bollinger Bands MT5

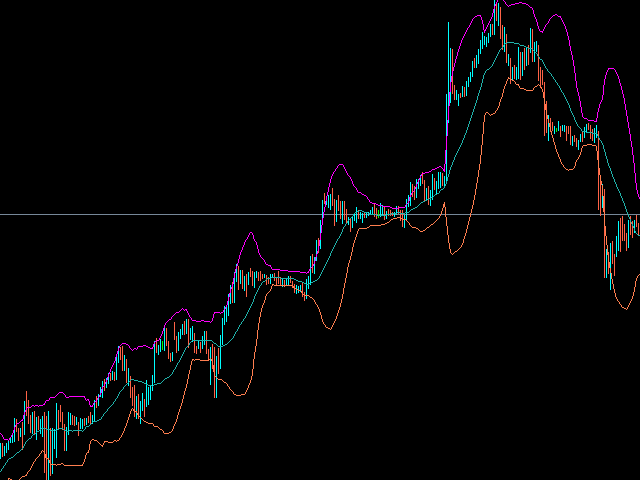
Bollinger Bands are a technical analysis tool that consists of a set of three lines plotted on a price chart. The middle line is a simple moving average, usually of 20 periods, and the upper and lower lines represent the standard deviation of the price from the moving average.

The upper band is calculated by adding two standard deviations to the moving average, while the lower band is calculated by subtracting two standard deviations from the moving average. This creates a band around the moving average that represents a range of prices within which most of the price action is expected to occur.

Traders use Bollinger Bands to identify potential overbought or oversold conditions in the market. When the price moves towards the upper band, it may be considered overbought, and when it moves towards the lower band, it may be considered oversold. A price move outside the bands may signal a trend reversal or the start of a new trend.

Bollinger Bands can be used in combination with other technical indicators and analysis tools to make trading decisions, such as identifying potential entry and exit points, setting stop-loss orders, and determining price targets.


추천 제품
SPECIAL LAUNCH OFFER: $30 (1-Month Rent) Limited time offer to build our community and gather feedback! AmbM GOLD Institutional Scalper A high-precision M5 algorithm for XAUUSD (Gold) , engineered to trade exclusively at Institutional Liquidity Levels ($5/$10 psychological marks). PERFORMANCE DATA (BUY ONLY) • Win Rate: 87.09%. • Safe Growth: +$4,113 profit on $10k (13.75% Max Drawdown). • Extreme Stress Test: Successfully generated +$22,997 in a 5-year stress test (2020-2026), proving
Noize Absorption Index
Ekaterina Saltykova
Noize Absorption Index - is the manual trading system that measures the difference of pressure between bears forces and bulls forces. Green line - is a noize free index that showing curent situation. Zero value of index shows totally choppy/flat market.Values above zero level shows how powerfull bullish wave is and values below zero measures bearish forces.Up arrow appears on bearish market when it's ready to reverse, dn arrow appears on weak bullish market, as a result of reverse expectation.
Mine Farm
Maryna Kauzova
Mine Farm is one of the most classic and time-tested scalping strategies based on the breakdown of strong price levels. Mine Farm is the author's modification of the system for determining entry and exit points into the market... Mine Farm - is the combination of great potential with reliability and safety. Why Mine Farm?! - each order has a short dynamic Stop Loss - the advisor does not use any risky methods (averaging, martingale, grid, locking, etc.) - the advisor tries to get the most
SMC Venom Model BPR 지표는 Smart Money(SMC) 개념 내에서 일하는 트레이더를 위한 전문 도구입니다. 가격 차트에서 두 가지 주요 패턴을 자동으로 식별합니다. FVG (공정 가치 갭)는 3개의 캔들의 조합으로, 첫 번째와 세 번째 캔들 사이에 갭이 있습니다. 이는 볼륨 지원이 없는 레벨 사이에 구역을 형성하여 종종 가격 수정으로 이어집니다. BPR (균형 가격 범위)은 두 개의 FVG 패턴의 조합으로, "브리지"를 형성합니다. 이는 가격이 낮은 볼륨 활동으로 움직일 때 브레이크아웃과 레벨로의 복귀 구역으로, 캔들 사이에 갭을 생성합니다. 이러한 패턴은 거래자가 차트에서 거래량과 가격 역학을 분석하여 주요 지지/저항 수준, 돌파 구역 및 진입 지점을 식별하는 데 도움이 되며, 여기서 대형 시장 참여자와 일반 참여자 간의 상호 작용이 발생합니다. 이 지표는 사각형과 화살표 형태로 패턴을 시각화하며 유연한 경고 설정도 지원합니다. 주요 특징: 패턴 표시 모드
RBreaker
Zhong Long Wu
RBreaker Gold Indicators는 금 선물을 위한 단기 데이 트레이딩 전략으로, 추세 추종과 데이 내 반전의 두 가지 거래 방식을 결합합니다. 추세 장에서 수익을 포착할 수 있을 뿐만 아니라, 시장이 반전될 때 적시에 이익을 확정하고 추세에 맞춰 반대 포지션을 잡을 수 있습니다. 이 전략은 미국 잡지 Futures Truth에서 15년 연속으로 가장 수익성 높은 트레이딩 전략 상위 10위 안에 선정되었습니다. 긴 라이프사이클을 자랑하며, 현재까지 국내외에서 널리 사용되고 연구되고 있습니다. 본 지표는 2026년 금 선물의 움직임을 반영하여 14일 ATR 지표를 기반으로 돌파 계수 A, 관찰 계수 B, 반전 계수 R을 보다 합리적인 값으로 정의했습니다. 매우 훌륭한 지표이며, 안정적인 연간 수익성을 달성했습니다. 강력히 추천합니다~ 위 지표는 변동성이 높은 상품에 적합하며, 매개변수는 금 선물, 주가 지수 선물 등에 적합합니다. 다른 상품이 필요한 경우 돌파 계수 A
Volality Index Scalper
Lesedi Oliver Seilane
5 (1)
Volality Index scalper indicator  Meant for Volality pairs such as Volality 10, 25, 50, 75 and 100 The indicator works on all timeframes from the 1 minute to the monthly timeframe the indicator is non repaint the indicator has 3 entry settings 1 color change on zero cross 2 color change on slope change 3 color change on signal line cross Orange line is your sell signal Blue line is your buy signal.
Max Min Delta Indicator - Market Volume Imbalance Analysis Gain Deeper Insights into Market Volume Imbalance with Delta Analysis What is the Max Min Delta Indicator? The Max Min Delta Indicator is a powerful market volume analysis tool that visually represents maximum and minimum delta values using a histogram. It helps traders identify market strength, weakness, absorption, and aggressive buying/selling activity with precision. Key Features Histogram Visualization: Displays Max Delta (Green) an
Your Trend Friend
Luigi Nunes Labigalini
5 (1)
The trend is your friend! Look at the color of the indicator and trade on that direction. It does not  repaint. After each candle is closed, that's the color of the trend. You can focus on shorter faster trends or major trends, just test what's most suitable for the symbol and timeframe you trade. Simply change the "Length" parameter and the indicator will automatically adapt. You can also change the color, thickness and style of the lines. Download and give it a try! There are big movements w
Fibaction
Abdelkhalek Orabi
Indicator Name: Fibaction – price action candle Detector Description: Fibo Signal Boxes is a powerful Smart Money Concept (SMC)-inspired indicator that auto-detects price action candles. bullish hammers and shooting stars, then draws precise Fibonacci entry zones and multiple take-profit levels directly on the chart. as for the SL personally i use 40 pips rules  Key Features: Detects bullish hammer and shooting star reversal candles. Automatically draws Fibonacci entry and TP boxes. as
MT5용 Crypto_Forex 지표 PINBAR 패턴, 재도색 및 지연 없음. - "PINBAR 패턴" 지표는 가격 변동 거래에 매우 강력한 지표입니다. - 이 지표는 차트에서 다음과 같은 핀바를 감지합니다. - 상승 핀바 - 차트에 파란색 화살표 신호(그림 참조). - 하락 핀바 - 차트에 빨간색 화살표 신호(그림 참조). -   PC 및 모바일 알림 기능 포함. - "PINBAR 패턴" 지표는 지지/저항 레벨과 결합하기 매우 좋습니다. ................................................................................ 여기를 클릭하여 고품질 트레이딩 로봇과 지표를 확인하세요! MQL5 웹사이트에서만 제공되는 오리지널 상품입니다.
HMA Trend Professional MT5
Pavel Zamoshnikov
4.25 (4)
Improved version of the free HMA Trend indicator (for MetaTrader 4) with statistical analysis. HMA Trend is a trend indicator based on the Hull Moving Average (HMA) with two periods. HMA with a slow period identifies the trend, while HMA with a fast period determines the short-term movements and signals in the trend direction. The main differences from the free version: Ability to predict the probability of a trend reversal using analysis of history data. Plotting statistical charts for analyzi
DYJ BoS
Daying Cao
DYJ BoS 지표는 다음을 포함하여 시장 구조 변화의 필수 요소를 자동으로 식별하고 표시합니다. 구조 돌파(BoS): 가격이 크게 움직여 이전 구조 지점을 돌파할 때 감지됩니다. 상승 추세선과 하락 추세선(UP & DN, 즉 연속적인 신고가와 신저가)을 표시하고, 가격이 이러한 선을 돌파하면 빨간색(BEAR)과 초록색(BULL) 화살표를 표시합니다. BoS는 일반적으로 가격이 이전 가격 움직임에 의해 확립된 스윙 저점이나 스윙 고점을 확실히 통과할 때 발생합니다. 가격이 스윙 하이보다 높거나 스윙 로우보다 낮게 움직일 경우, 이는 단순히 이전에 형성된 시장 구조를 깨는 것이므로 "브레이크아웃" 구조라고 합니다. 이는 종종 시장 심리와 추세 방향의 변화를 나타내며, 기존 추세가 지속되거나 새로운 추세가 시작됨을 알립니다. 일반적으로 마감 정확도를 높이기 위해 손절매와 이익실현을 설정하지 않는 것이 좋습니다. 최종 포지션은 일반적으로 같은 방향의 다음 돌파점에서 마감되거나 반
Caicai L&S Yield Histogram Important Notice: This indicator is an integral tool of the automated EA Caicai Long and Short Pair Trading . This indicator visually displays the percentage deviation (Yield %) of a pair's current spread relative to its own historical mean. It is an excellent tool for quickly visualizing the gross financial potential of a market distortion in Long & Short operations. Main Features: Percentage Visualization: Understand the size of the distortion in palpable percentage
거래 세션 표시기는 각 거래 세션의 시작과 끝을 강조 표시합니다 . 제품의 유료 버전은 세션의 시작/끝을 사용자 정의 할 수있는 가능성 무료 입니다. [옵션:] Asian session Open Asian session Close Asian session OpenSummertime Asian session CloseSummertime European session Open European session Close European session Open European session Close Timeshift 최상의 결과를 얻으려면 시간대를 사용하십시오. 시간 프레임에 대한 보정을 추가했습니다. 대략적인 수정: Bars           Correction ------------------ 23.50 ____ 10 23.54 ____ 5 23.55 ____ 4(5) 00.05 ____ 5(6) 시장에 나의 다른 제품 https://www.mql5.com/en/users/
Universal Soul Reaper
Pieter Gerhardus Van Zyl
Universal Soul Reaper is an atmospheric market-flow oscillator designed to interpret price behavior as a cycle of spiritual energy. Instead of reacting to raw price alone, it visualizes the state of the market’s soul —revealing when momentum is awakening, stabilizing, or fading. The indicator operates in a separate window and presents three interwoven entities: the Ectoplasmic Veil , the Spirit Boundary , and the Soul Core . Together, they form a living framework that helps traders sense pressu
숫자 시퀀스 중 하나를 "산불 시퀀스"라고 합니다. 가장 아름다운 새로운 시퀀스 중 하나로 인식되었습니다. 주요 특징은 이 시퀀스가 ​​가장 짧은 경우에도 선형 추세를 피한다는 것입니다. 이 지표의 기초를 형성한 것은 이 속성입니다. 금융 시계열을 분석할 때 이 지표는 가능한 모든 추세 옵션을 거부하려고 합니다. 그리고 그가 실패하는 경우에만 그는 추세의 존재를 인식하고 적절한 신호를 제공합니다. 이 접근 방식을 통해 새로운 트렌드가 시작되는 순간을 정확하게 결정할 수 있습니다. 그러나 거짓 긍정도 가능합니다. 숫자를 줄이기 위해 이 표시기에 추가 필터가 추가되었습니다. 새 막대가 열리면 신호가 생성됩니다. 어떤 경우에도 다시 그리기가 발생하지 않습니다. 표시 매개변수: Applied Price   - 적용된 가격 상수. Period Main   - 표시기의 기본 기간, 유효한 값은 5 - 60 이내입니다. Period Additional   - 추가 기간, 이 매개변수의 유효한
우리의   Basic Support and Resistance   표시기는 기술 분석을 향상시키는 데 필요한 솔루션입니다.이 표시기는 차트/ MT4 버전 특징 피보나치 수준의 통합 : 지원 및 저항 수준과 함께 피보나치 수준을 표시하는 옵션과 함께, 우리의 지표는 시장 행동과 가능한 역전 영역에 대한 더 깊은 통찰력을 제공합니다. 성능 최적화 : 각 막대의 개구부에서만 확장 라인을 업데이트하는 옵션을 사용하여, 우리의 지표는 지원 및 저항 수준의 정확도를 희생하지 않고 최적의 성능을 보장합니다. 입력 주요 설정 Timeframe:  이 입력을 통해 차트에 더 높은 기간의 지지선과 저항선을 표시하도록 선택할 수 있습니다. Support/Resistance Strength [Number of Bars]:   이 입력을 사용하면 지지대와 저항의 강도를 결정할 수 있습니다.숫자가 높을수록지지/저항이 더 강해집니다. Price mode:  이 매개 변수를 사용하면 지원 및 저항 수준을
Visual CrossPulse Dynamics Indicator
AL MOOSAWI ABDULLAH JAFFER BAQER
Visual CrossPulse Dynamics: Trade with the Market's True Rhythm Unlock a new level of market insight with Visual CrossPulse Dynamics, a sophisticated trading indicator designed to adapt to ever-changing volatility and reveal the true direction of the trend. Are you tired of indicators that lag in fast-moving markets or give false signals during consolidation? The Visual CrossPulse Dynamics indicator solves this problem by using an advanced, adaptive algorithm that intelligently adjusts to the m
Ichimoku Aiko MTF
Michael Jonah Randriamampionontsoa
Ichimoku Aiko MTF is a collection of technical indicators that show support and resistance levels, as well as momentum and trend direction. It is a multi-timeframe indicator so you don't need to change the chart timeframe when you want to see the ichimoku clouds on a higher timeframe.  eg. The chart timeframe is M15 and you want to see on the M15 timeframe chart the H1 ichimoku indicators (the ichimoku in Metatrader can't do that) that's why you need to use Ichimoku Aiko MTF.
Hull Heikin Ashi Smoothed
Flavio Javier Jarabeck
Heikin Ashi candlesticks are a powerful tool for traders, offering a clear and smooth visualization of market trends. Unlike traditional candlesticks, they filter out market noise, providing a cleaner view of the market's direction and strength, which helps traders make more informed decisions. The Hull Heikin Ashi Smoothed indicator from Minions Labs takes this a step further by integrating the Hull Moving Average for enhanced smoothing and precision. This indicator not only simplifies trend id
US30NinjaMT5
Satyaseelan Shankarananda Moodley
US30 Ninja is a 5 minute scalping indicator that will let know you when there is a trade set up (buy or sell). Once the indicator gives the trade direction, you can open a trade and use a 30 pip stop loss and a 30 pip to 50 pip take profit. Please trade at own own risk. This indicator has been created solely for the US30 market and may not yield positive results on any other pair. 
Protocol
Vincent Georges David Ferrier
PROTOCOL - Institutional Liquidity Grab & SMC Elite Liquidity Grab & Advanced SMC Execution ( MT4 Available here ) Dynamic Trend Sniper MT5 (available here) LIMITED RELEASE & PRICING NOTICE Launch Special: Available for $299 USD for the first 7 days only . After this period, the price will strictly increase to $399 USD. Prop Firm Protection Protocol: Major Prop Firms enforce strict copy-trading and trade-crowding policies. To protect the statistical edge of this algorithm and ensure our
PipFinite Trend PRO MT5
Karlo Wilson Vendiola
4.84 (557)
Breakthrough Solution For Trend Trading And Filtering With All Important Features Built Inside One Tool! Trend PRO's smart algorithm detects the trend, filters out market noise and gives entry signals with exit levels. The new features with enhanced rules for statistical calculation improved the overall performance of this indicator. Important Information Revealed Maximize the potential of Trend Pro, please visit www.mql5.com/en/blogs/post/713938 The Powerful Expert Advisor Version Automatin
이것은 가격 레이블이 있는 Advanced ZigZag Dynamic   및/또는   Extended Fractals   표시기 극값을 기반으로 하는 지원 및 저항 수준의 MTF 표시기입니다(비활성화 가능). MTF 모드에 대해 더 높은 TF를 선택할 수 있습니다. 기본적으로 레벨은 지그재그 표시 점을 기반으로 생성됩니다. 프랙탈 표시 점은 지그재그와 함께 또는 대신 사용할 수도 있습니다. 사용을 단순화하고 CPU 시간을 절약하기 위해 열릴 때 각 막대당 한 번씩 계산이 수행됩니다. 매개변수: ForcedTF - 레벨 계산을 위한 차트 타임프레임(현재와 같거나 초과할 수 있음) MinPipsLevelWidth - 포인트 단위의 최소 레벨 너비(매우 좁은 레벨에 사용) Use ZigZag Extremums points - 지그재그 피크를 사용하여 지원/저항 수준 계산을 활성화/비활성화합니다. Fixed pips range - 지그재그 표시기를 계산하기 위한 최소값과 최대값 사이의 거리
Overview Heiken Ashi CE Filtered MT5 is a technical indicator for the MetaTrader 5 platform. It integrates smoothed candlestick charting with a dynamic exit strategy and a customizable trend filter to deliver clear buy and sell signals. The indicator is designed to improve trend detection and signal reliability by reducing market noise. If you want to see more high-quality products or order the development/conversion of your own products, visit my partners' website: 4xDev Get 10% OFF on manual
Level Volume Pro
John Samfel Bucton Josol
HAT IT DOES   MONTHLY HIGH & LOW — AUTO-DRAWN EVERY MONTH Draws the High and Low of every month for the current year (or any year you set). Each level extends as a horizontal ray into the future so you always see where price is reacting to historical monthly extremes. Color-coded (blue = high, red = low), labeled (JAN HIGH, FEB LOW etc.), fully customizable width and style. Toggle individual months on or off.   WEEKLY HIGH & LOW
Prime Power ML
Artem Koliada
Prime Power ML 은 신호를 표시하기 전에 승률로 필터링하는 두 개의 ONNX 신경망 모델이 내장된 고급 Currency Strength Meter입니다. 통화 간의 모든 괴리를 표시하는 기존 CSM 지표와 달리, Prime Power ML은 AI가 통계적 우위를 확인한 신호만 강조 표시합니다. 작동 방식 이 지표는 28개 통화 쌍 전체에 걸친 RSI 스코어링을 사용하여 8개 주요 통화(USD, EUR, GBP, JPY, AUD, CAD, CHF, NZD)의 강도를 실시간으로 계산합니다. 두 통화 간에 강도 괴리가 나타나면 내장 AI 모델이 14개 시장 특성을 평가하고 신호에 Win Probability(0-100%) 점수를 부여합니다. 최소 임계값을 충족하는 신호만 AI TOP SIGNALS 로 표시됩니다 — 신뢰도 순으로 정렬된 현재 차트의 최고 2개 기회입니다. 두 개의 AI 모델 — 타임프레임에 맞춘 선택 모드 타임프레임 학습 데이터 Win Rate (out-of-s
ProEngulfing For MT5
Ashkan Hazegh Nikrou
ProEngulfing 무료 버전은 QualifiedEngulfing으로, 하루에 하나의 신호로 제한되며 기능이 적습니다. 모든 Koala 제품에 대한 최신 정보를 확인하려면 mql5 커뮤니티에서 Koala Trading Solution 채널에 가입하세요. 가입 링크는 아래와 같습니다: https ://www .mql5 .com /en /channels /koalatradingsolution 이 제품의 MT4 버전은 아래 링크에서 다운로드 가능합니다: https ://www .mql5 .com /en /market /product /52023 ProEngulfing 소개 – MT4용 전문가 수준의 Engulf 패턴 지표 정확성을 극대화한 ProEngulfing을 소개합니다. 이 최신 지표는 포렉스 시장에서 신뢰할 수 있는 Engulf 패턴을 식별하고 강조하는 데 중점을 둔 제품입니다. MetaTrader 4에 맞게 개발된 ProEngulfing은 신뢰도 높은 신호를 제공하기 위해
Visual Range Directional Force Indicator
AL MOOSAWI ABDULLAH JAFFER BAQER
Range Directional Force Indicator – Designed for You to Optimize! The Range Directional Force Indicator is a cutting-edge tool designed to empower traders by visualizing market dynamics and directional strength. Built to offer insights into market trends and reversals, this indicator is an invaluable asset for traders seeking precision in their strategies. However, it is important to note that this indicator is not optimized, leaving room for you to tailor it to your unique trading preferences.
CvdDeltaVolumes
Parasbhai N Patel
Delta + CVD & CVD Candles Order-flow indicator combining Delta (Ask–Bid), Cumulative Volume Delta (CVD), and a unique CVD-based synthetic candle system. Shows buy/sell pressure, volume aggressiveness, and momentum shifts with optional Delta histogram, CVD line, and CVD+Delta combined candles. Useful for scalping, intraday trading, divergence detection, and understanding buyer/seller dominance. Overview The Delta + CVD & CVD Candles Indicator combines multiple order-flow tools into one clean
이 제품의 구매자들이 또한 구매함
Divergence Bomber
Ihor Otkydach
4.9 (87)
이 지표를 구매하신 분께는 다음과 같은 혜택이 무료로 제공됩니다: 각 거래를 자동으로 관리하고, 손절/익절 수준을 설정하며, 전략 규칙에 따라 거래를 종료하는 전용 도우미 툴 "Bomber Utility" 다양한 자산에 맞게 지표를 설정할 수 있는 셋업 파일(Set Files) "최소 위험", "균형 잡힌 위험", "관망 전략" 모드로 설정 가능한 Bomber Utility의 셋업 파일 이 전략을 빠르게 설치, 설정, 시작할 수 있도록 돕는 단계별 영상 매뉴얼 주의: 위의 모든 보너스를 받기 위해서는 MQL5 개인 메시지 시스템을 통해 판매자에게 연락해 주세요. 독창적인 커스텀 지표인 “Divergence Bomber(다이버전스 봄버)”를 소개합니다. 이 지표는 MACD 다이버전스(괴리) 전략을 기반으로 한 올인원(All-in-One) 거래 시스템입니다. 이 기술 지표의 주요 목적은 가격과 MACD 지표 간의 다이버전스를 감지하고, **향후 가격이 어느 방향으로 움직일지를 알려주는
Grabber System MT5
Ihor Otkydach
4.83 (23)
탁월한 기술적 지표인 Grabber를 소개합니다. 이 도구는 즉시 사용 가능한 “올인원(All-Inclusive)” 트레이딩 전략으로 작동합니다. 하나의 코드 안에 강력한 시장 기술 분석 도구, 매매 신호(화살표), 알림 기능, 푸시 알림이 통합되어 있습니다. 이 인디케이터를 구매하신 모든 분들께는 다음의 항목이 무료로 제공됩니다: Grabber 유틸리티: 오픈 포지션을 자동으로 관리하는 도구 단계별 영상 매뉴얼: 설치, 설정, 그리고 실제 거래 방법을 안내 맞춤형 세트 파일: 인디케이터를 빠르게 자동 설정하여 최고의 성과를 낼 수 있도록 도와줍니다 다른 전략은 이제 잊어버리세요! Grabber만이 여러분을 새로운 트레이딩의 정점으로 이끌어 줄 수 있습니다. Grabber 전략의 주요 특징: 거래 시간 프레임: M5부터 H4까지 거래 가능한 자산: 어떤 자산이든 사용 가능하지만, 제가 직접 테스트한 종목들을 추천드립니다 (GBPUSD, GBPCAD, GBPCHF, AUDCAD, AU
SignalTech MT5
Yue Wang
5 (4)
SignalTech MT5 is a trading system for EURUSD, USDCHF, USDJPY, AUDUSD, NZDUSD, EURJPY, AUDJPY, NZDJPY, CADJPY H2 and H3 Timeframe.  It can generate signals with Buy/Sell Arrows and Pop-Up/Sound Alerts. Each signal has clear Entry and Stop Loss levels, which should be automatically flagged on the chart, as well as potential Targets 1, 2, and 3. The Entry and TP levels are fixed after the trade is taken. The exit level is dynamic. If there are signs of a potential short-term trend reversal, the
Trend Screener Pro MT5
STE S.S.COMPANY
4.85 (104)
트렌드 표시기, 트렌드 트레이딩 및 필터링을 위한 획기적인 고유 솔루션, 하나의 도구 안에 내장된 모든 중요한 트렌드 기능! Forex, 상품, 암호 화폐, 지수 및 주식과 같은 모든 기호/도구에 사용할 수 있는 100% 다시 칠하지 않는 다중 시간 프레임 및 다중 통화 표시기입니다. Trend Screener는 차트에 점이 있는 화살표 추세 신호를 제공하는 효율적인 지표 추세 추종 지표입니다. 추세 분석기 표시기에서 사용할 수 있는 기능: 1. 트렌드 스캐너. 2. 최대 이익 분석이 있는 추세선. 3. 추세 통화 강도 측정기. 4. 경고가 있는 추세 반전 점. 5. 경고가 있는 강력한 추세 점. 6. 추세 화살표 Trend Screener Indicator가 있는 일일 분석 예, 일일 신호 성능...등은 여기에서 찾을 수 있습니다. 여기를 클릭하십시오. LIMITED TIME OFFER : Trend Screener Indicator는 50$ 및 평생 동안만 사용할 수 있습니다.
소개       Quantum Breakout PRO   , 브레이크아웃 존 거래 방식을 변화시키는 획기적인 MQL5 지표! 13년 이상의 거래 경험을 가진 숙련된 트레이더 팀이 개발한       퀀텀 브레이크아웃 PRO       혁신적이고 역동적인 브레이크아웃 존 전략으로 거래 여정을 새로운 차원으로 끌어올리도록 설계되었습니다. Quantum Breakout Indicator는 5개의 이익 목표 영역이 있는 브레이크아웃 영역의 신호 화살표와 브레이크아웃 상자를 기반으로 한 손절 제안을 제공합니다. 초보자 거래자와 전문 거래자 모두에게 적합합니다. Quantum EA 채널:       여기를 클릭하세요 중요한! 구매 후 설치 매뉴얼을 받으려면 개인 메시지를 보내주십시오. 추천: 기간: M15 통화쌍: GBPJPY, EURJPY, USDJPY,NZDUSD, XAUUSD 계정 유형: 스프레드가 매우 낮은 ECN, Raw 또는 Razor 브로커 시간: GMT +3 중개인 :
Entry Points Pro for MT5
Yury Orlov
4.48 (138)
다시 색을 칠하지 않고 거래에 진입할 수 있는 정확한 신호를 제공하는 MT5용 지표입니다. 외환, 암호화폐, 금속, 주식, 지수 등 모든 금융 자산에 적용할 수 있습니다. 매우 정확한 추정값을 제공하고 매수와 매도의 가장 좋은 시점을 알려줍니다. 하나의 시그널로 수익을 내는 지표의 예와 함께 비디오 (6:22)시청하십시오! 대부분의 거래자는 Entry Points Pro 지표의 도움으로 첫 거래 주 동안 트레이딩 결과를 개선합니다. 저희의   Telegram Group 을 구독하세요! Entry Points Pro 지표의 좋은점. 재도색이 없는 진입 신호 신호가 나타나고 확인되면(시그널 캔들이 완성된 경우) 신호는 더 이상 사라지지 않습니다. 여타 보조지표의 경우 신호를 표시한 다음 제거되기 때문에 큰 재정적 손실로 이어집니다. 오류 없는 거래 게시 알고리즘을 통해 트레이드(진입 또는 청산)를 할 이상적인 순간을 찾을 수 있으며, 이를 통해 이를 사용하는 모든 거래자의 성공률이
Quantum TrendPulse
Bogdan Ion Puscasu
5 (23)
SuperTrend   ,   RSI   ,   Stochastic   의 힘을 하나의 포괄적인 지표로 결합하여 트레이딩 잠재력을 극대화하는 궁극의 트레이딩 도구   인 Quantum TrendPulse를   소개합니다. 정밀성과 효율성을 추구하는 트레이더를 위해 설계된 이 지표는 시장 추세, 모멘텀 변화, 최적의 진입 및 종료 지점을 자신 있게 식별하는 데 도움이 됩니다. 주요 특징: SuperTrend 통합:   주요 시장 추세를 쉽게 따라가고 수익성의 물결을 타세요. RSI 정밀도:   매수 과다 및 매도 과다 수준을 감지하여 시장 반전 시점을 파악하는 데 적합하며 SuperTrend 필터로 사용 가능 확률적 정확도:   변동성이 큰 시장에서 숨겨진 기회를 찾기 위해 확률적 진동   을 활용하고 SuperTrend의 필터로 사용 다중 시간대 분석:   M5부터 H1 또는 H4까지 다양한 시간대에 걸쳐 시장을 최신 상태로 유지하세요. 맞춤형 알림:   맞춤형 거래 조건이 충족되면
Azimuth Pro
Ottaviano De Cicco
5 (7)
Azimuth Pro V2: Synthetic Fractal Structure and Confirmed Entries for MT5 Overview Azimuth Pro is a multi-level swing structure indicator by Merkava Labs . Four nested swing layers, swing-anchored VWAP, ABC pattern detection, three-timeframe structural filtering, and closed-bar confirmed entries — one chart, one workflow from micro-swings to macro-cycles. This is not a blind signal product. It is a structure-first workflow for traders who care about location, context, and timing. V2 Launch Offe
Meravith MT5
Ivan Stefanov
5 (1)
마켓 메이커를 위한 도구. Meravith는 다음과 같은 기능을 제공합니다: 모든 타임프레임을 분석하고 현재 유효한 추세를 표시합니다. 강세와 약세 거래량이 동일한 유동성 구간(거래량 균형 구간)을 강조 표시합니다. 서로 다른 타임프레임의 모든 유동성 레벨을 차트에 직접 표시합니다. 텍스트 기반 시장 분석을 생성하여 참고용으로 제공합니다. 현재 추세를 기반으로 목표가, 지지선 및 손절가를 계산합니다. 거래의 위험 대비 보상 비율(Risk/Reward)을 계산합니다. 계좌 잔고에 따라 포지션 크기를 산출하고 잠재 수익을 추정합니다. 시장에 중대한 변화가 발생할 경우 경고도 제공합니다. 지표의 주요 라인: 강세/약세 거래량 소진 라인 — 목표가로 사용됩니다. 시장 추세를 나타내는 라인. 시장이 강세인지 약세인지에 따라 색상이 변경되며 추세 지지선 역할을 합니다. 색상은 주로 시장 심리를 보여줍니다. 거래량 균형선(Eq). Eq(Volume Equilibrium) 라인은 시스템의 핵심입니
Btmm state engine pro
Garry James Goodchild
5 (4)
BTMM State Engine Pro is a MetaTrader 5 indicator for traders who use the Beat The Market Maker approach: Asian session context, kill zone timing, level progression, peak formation detection, and a multi-pair scanner from a single chart. It combines cycle state logic with a built-in scanner dashboard so you do not need the same tool on many charts at once. What it does Draws the Asian session range; session times can follow broker server offset or be set in inputs. Tracks level progression (L
OmniSync Projection
Antonio-alin Teculescu
5 (1)
Chronos Fractal Engine is an innovative price projection indicator for MetaTrader 5, designed to transform your technical analysis by intelligently identifying and projecting historical price patterns. Built upon an advanced correlation algorithm and the fractal principles of the market, this powerful tool visualizes potential future price movements, giving you a unique edge in your trading decisions. What is Chronos Fractal Engine? At its core, the Chronos Fractal Engine employs a sophisticat
RelicusRoad Pro MT5
Relicus LLC
5 (24)
RelicusRoad Pro: 퀀트 시장 운영 체제 70% 할인 평생 이용권 (한정 시간) - 2,000명 이상의 트레이더와 함께하세요 왜 대부분의 트레이더는 "완벽한" 지표를 가지고도 실패할까요? 진공 상태에서 단일 개념 만으로 거래하기 때문입니다. 문맥 없는 신호는 도박입니다. 지속적인 승리를 위해서는 컨플루언스(중첩) 가 필요합니다. RelicusRoad Pro는 단순한 화살표 지표가 아닙니다. 완전한 퀀트 시장 생태계 입니다. 독점적인 변동성 모델링을 사용하여 가격이 이동하는 "공정 가치 로드"를 매핑하고, 단순 노이즈와 실제 구조적 돌파를 구분합니다. 추측은 그만두세요. 기관급 로드 로직으로 거래를 시작하세요. 핵심 엔진: "Road" 알고리즘 시스템의 중심에는 시장 상황에 실시간으로 적응하는 동적 변동성 채널인 Road Algo 가 있습니다. 세이프 라인(평형) 과 가격이 수학적으로 반전될 가능성이 높은 확장 레벨 을 투영합니다. Simple Road: 일반적인 시장을 위
Bill Williams Advanced
Siarhei Vashchylka
5 (11)
Bill Williams Advanced is designed for automatic chart analysis using Bill Williams' "Profitunity" system. The indicator analyzes four timeframes at once. Manual (Be sure to read before purchasing) Advantages 1. Analyzes the chart using Bill Williams' "Profitunity" system. Signals are displayed in a table in the corner of the screen and on the price chart. 2. Finds all known AO and AC signals, as well as zone signals. Equipped with a trend filter based on the Alligator. 3. Finds "Divergence Bar
ARICoins
Temirlan Kdyrkhan
ARICoin is a powerful trading companion designed to generate high-probability entry signals with dynamic TP/SL/DP levels based on volatility. Built-in performance tracking shows win/loss stats, PP1/PP2 hits, and success rates all updated live. Key Features: Buy/Sell signals with adaptive volatility bands Real-time TP/SL/DP levels based on ATR Built-in MA Filter with optional ATR/StdDev volatility Performance stats panel (Success, Profit/Loss, PP1/PP2) Alerts via popup, sound, push, or email Cust
META Points PRO MT5
Polina Balahura
5 (1)
META 포인트 PRO       — 는 추세 추종 도구로, 거래에서 추측을 배제하고 시장이 이미 결정을 내린 지점을 보여줍니다. 이 지표는 추세, 추세선 및 구조가 변화하는 주요 지점을 식별하고 주요 참여자들이 포지션을 취할 수 있도록 가격이 되돌아오는 영역을 강조합니다. 단순히 가격 움직임만 보는 것이 아니라, 그 이면에 숨겨진 논리까지 이해할 수 있습니다. 모든 신호는 캔들 마감 후 기록되며, 다시 그려지지 않고 차트에 저장되므로 상황을 확실하게 분석하고 결정을 내릴 수 있습니다. 거래 목표(이익 실현) 또한 표시됩니다. 이 지표의 효과에 대해 완벽한 확신을 가지실 수 있도록 자동 통계 자료를 제공해 드립니다. 방향 전환 후에는 손절매 수준과 해당 수준이 지능적으로 점진적으로 이동하는 모습(Move SL)을 표시해주는데, 이는 매우 중요합니다.       감소시킨다       위험       위치별로. 손절매/이익실현/RR 오른쪽에 내장된 패널은 현재 글로벌 추세 방향의 시장
Advanced Supply Demand MT5
Bernhard Schweigert
4.53 (15)
현재 33% 할인! 초보자나 전문 트레이더를 위한 최고의 솔루션! 이 보조지표는 우리가 다수의 독창적 기능과 새로운 공식을 통합한 독특하고 고품질이며 저렴한 거래 도구입니다. 이 업데이트를 통해 이중 시간대를 표시할 수 있습니다. 더 높은 TF를 표시할 수 있을 뿐만 아니라 차트 TF와 더 높은 TF 모두를 표시할 수 있습니다: 중첩 영역 표시. 모든 Supply Demand 트레이더들이 좋아할 것입니다. :) 중요한 정보 공개 Advanced Supply Demand의 잠재력을 극대화하려면 다음을 방문하십시오. https://www.mql5.com/ko/blogs/post/720245   진입 또는 목표의 명확한 트리거 포인트를 정확히 찾아냄으로 해서 거래가 어떻게 개선될지 상상해 보십시오. 새로운 알고리즘을 기반으로 매수자와 매도자 간의 잠재적인 불균형을 훨씬 더 쉽게 분간할 수 있습니다. 왜냐하면 가장 강한 공급영역과 가장 강한 수요 영역과 과거에 어떻게 진행 되었는지를(이전
ON Trade Gann Squares MT5
Abdullah Alrai
5 (2)
간 스퀘어 지표는 W.D. 간이 쓴 "시장 예측을 위한 수학적 공식" 기사에 기반한 강력한 시장 분석 도구입니다. 이 도구는 수학적 개념과 간 이론을 사용하여 정확한 시장 분석을 수행합니다. 144, 90, 52의 제곱과 9의 제곱을 사용합니다. 또한 의 9의 제곱근 및 해당 제곱의 채널 및 스타 패턴과의 관련성을 통합합니다. 사용자 메뉴얼 및 적용: 이 지표를 사용하기 전에 사용자 메뉴얼을 읽고 질문이 있을 경우 문의하시기 바랍니다. 전체 메뉴얼은 웹사이트에서 제공됩니다. MT5의 전체 버전을 구매하거나 MT4의 무료 버전을 테스트할 수 있습니다. 두 버전 모두 링크에서 확인하실 수 있습니다. 주요 기능 및 기능: 간 스퀘어 지표는 정확한 결정을 위해 기하학적 개념과 간 이론을 활용하는 시장 분석을 위한 포괄적인 도구 집합을 제공합니다. 주요 기능은 다음과 같습니다. 9의 제곱 분석:   이 지표는 9의 제곱에 대한 수평 선, 스타 패턴, 그리드 및 간 팬을 그릴 수 있습니다. 간
Cvd Divergence
Thalles Nascimento De Carvalho
CVD Divergence – 전문적인 주문 흐름 및 다이버전스 분석 CVD Divergence는 가격과 Cumulative Delta Volume(CVD) 사이의 신뢰할 수 있는 다이버전스를 감지하기 위해 개발된 기술적 지표입니다. 실제 주문 흐름이 가격 움직임을 확인하지 않을 때를 정확하게 포착하여, 잠재적 추세 전환, 매수·매도 세력의 소진, 기관의 시장 조작 가능성을 보여줍니다. 이 지표는 공격적인 거래량 분석과 가격 구조 해석을 결합해 명확하고 객관적이며 빠른 신호를 제공합니다. 지표 기능 CVD Divergence는 누적 델타 거래량을 사용하여 주문 흐름의 방향과 가격 방향을 비교합니다. 두 값이 크게 괴리될 경우 차트에 시각적 표시를 남기고 다이버전스 방향을 명확하게 보여줍니다. 다음과 같은 상황을 감지합니다: 강세 다이버전스 (가격이 하락하지만 CVD가 상승할 때) 약세 다이버전스 (가격이 상승하지만 CVD가 하락할 때) 매수·매도 세력의 힘 고갈 기관 주문 불균형으로
Gartley Hunter Multi
Siarhei Vashchylka
5 (11)
Gartley Hunter Multi - An indicator for searching for harmonic patterns simultaneously on dozens of trading instruments and on all possible timeframes. Manual (Be sure to read before purchasing) | Version for MT4 Advantages 1. Patterns: Gartley, Butterfly, Shark, Crab. Bat, Alternate Bat, Deep Crab, Cypher 2. Simultaneous search for patterns on dozens of trading instruments and on all possible timeframes 3. Search for patterns of all possible sizes. From the smallest to the largest 4. All fou
" Dynamic Scalper System MT5 " 지표는 추세 파동 내에서 스캘핑 방식으로 거래하도록 설계되었습니다. 주요 통화쌍 및 금에서 테스트되었으며, 다른 거래 상품과의 호환성이 가능합니다. 추가적인 가격 변동 지원을 통해 추세에 따라 단기 포지션 진입 신호를 제공합니다. 지표의 원리 큰 화살표는 추세 방향을 결정합니다. 작은 화살표 형태의 스캘핑 신호를 생성하는 알고리즘은 추세 파동 내에서 작동합니다. 빨간색 화살표는 상승 방향을, 파란색 화살표는 하락 방향을 나타냅니다. 민감한 가격 변동선은 추세 방향으로 그려지며, 작은 화살표의 신호와 함께 작용합니다. 신호는 다음과 같이 작동합니다. 적절한 시점에 선이 나타나면 진입 신호가 형성되고, 선이 있는 동안 미결제 포지션을 유지하며, 완료되면 거래를 종료합니다. 권장되는 작업 시간대는 M1~H4입니다. 화살표는 현재 캔들에 형성되며, 다음 캔들이 이미 시작되었더라도 이전 캔들의 화살표는 다시 그려지지 않습니다. 입
Presenting one-of-a-kind Gann Indicator for XAUUSD IQ Gold Gann Levels is a non-repainting, precision tool designed exclusively for XAUUSD/Gold intraday trading. It uses W.D. Gann’s square root method to plot real-time support and resistance levels, helping traders spot high-probability entries with confidence and clarity. William Delbert Gann (W.D. Gann) was an exceptional market analyst whose trading technique was based on a complex blend of mathematics, geometry, astrology, and ancient calcul
Berma Bands
Muhammad Elbermawi
5 (8)
Berma Bands(BBs) 지표는 시장 동향을 파악하고 이를 활용하려는 트레이더에게 귀중한 도구입니다. 가격과 BBs 간의 관계를 분석함으로써 트레이더는 시장이 추세 단계인지 범위 단계인지를 분별할 수 있습니다. 자세한 내용을 알아보려면 [ Berma Home Blog ]를 방문하세요. 버마 밴드는 세 개의 뚜렷한 선으로 구성되어 있습니다. 어퍼 버마 밴드, 미들 버마 밴드, 로어 버마 밴드입니다. 이 선들은 가격 주위에 그려져 전체 추세에 대한 가격 움직임을 시각적으로 표현합니다. 이 밴드들 사이의 거리는 변동성과 잠재적인 추세 반전에 대한 통찰력을 제공할 수 있습니다. 버마 밴드 라인이 각각에서 분리될 때, 그것은 종종 시장이 횡보 또는 범위 이동 기간에 접어들고 있음을 시사합니다. 이는 명확한 방향 편향이 없음을 나타냅니다. 트레이더는 이러한 기간 동안 추세를 파악하기 어려울 수 있으며 더 명확한 추세가 나타날 때까지 기다릴 수 있습니다. 버마 밴드 라인이 단일 라인으로
우선적으로, 이 거래 도구는 전문적인 거래에 이상적인 비-다시 그리기 및 지연되지 않는 지표입니다.  온라인 강좌, 사용자 매뉴얼 및 데모. 스마트 가격 액션 컨셉트 인디케이터는 신규 및 경험 많은 트레이더 모두에게 매우 강력한 도구입니다. Inner Circle Trader Analysis 및 Smart Money Concepts Trading Strategies와 같은 고급 거래 아이디어를 결합하여 20가지 이상의 유용한 지표를 하나로 결합합니다. 이 인디케이터는 스마트 머니 컨셉트에 중점을 두어 대형 기관의 거래 방식을 제공하고 이동을 예측하는 데 도움을 줍니다.  특히 유동성 분석에 뛰어나 기관이 어떻게 거래하는지 이해하는 데 도움을 줍니다. 시장 트렌드를 예측하고 가격 변동을 신중하게 분석하는 데 탁월합니다. 귀하의 거래를 기관 전략에 맞추어 시장의 동향에 대해 더 정확한 예측을 할 수 있습니다. 이 인디케이터는 시장 구조를 분석하고 중요한 주문 블록을 식별하고 다양
RFI levels PRO MT5
Roman Podpora
3.67 (3)
이 지표는 추세 반전 지점과 가격 반등 영역을 정확하게 보여줍니다.       주요 투자자들   . 새로운 트렌드가 형성되는 곳을 파악하고 최대한 정확하게 의사결정을 내리며 모든 거래를 완벽하게 통제합니다. TREND LINES PRO   지표와 함께 사용할 때 최대의 잠재력을 발휘합니다.  VERSION MT4 지표가 보여주는 내용: 새로운 추세의 시작 시 활성화되는 반전 구조 및 반전 수준. 최소한의 위험 대비 수익률을 갖는 이익 실현   (TAKE PROFIT)   및   손절매(STOP LOSS)   레벨 표시       RR 1:2   . 지능형 손실 감소 로직이 적용된 손절매 기능. 지정된 지표에서 두 가지 추세 유형에 대한 반전 패턴을 표시합니다. 지표: 트렌드를 따라   트렌드 라인 프로   (글로벌 트렌드 변화) 트렌드 프로   (빠른 트렌드 변화) 간단하고 효과적입니다       스캐너       실시간 추세 (신규). 다중 시간 프레임 도구 필터링. 표시하다  
PZ Day Trading MT5
PZ TRADING SLU
2.83 (6)
Effortless trading: non-repainting indicator for accurate price reversals This indicator detects price reversals in a zig-zag fashion, using only price action analysis and a donchian channel. It has been specifically designed for short-term trading, without repainting or backpainting at all. It is a fantastic tool for shrewd traders aiming to increase the timing of their operations. [ Installation Guide | Update Guide | Troubleshooting | FAQ | All Products   |  Get Help ] Amazingly easy to tr
Route Lines Prices MT5  - 는 잠재적인 거래 신호를 찾는 데 사용되는 지표입니다. 간단한 인터페이스에는 다양한 가격 움직임 알고리즘과 신호 종점 감지, 완료된 궤적 계산 기능이 포함되어 있습니다. 알고리즘에는 사용된 시간대에 따라 변동성 및 가격 평활화 계산이 포함됩니다. 이 지표는 " Calculating price values "이라는 기본 매개변수를 통해 값을 변경할 수 있습니다. 기본값인 1은 균형 잡힌 자동 계산 형태를 제공하며, 별도의 설정 없이 바로 사용할 수 있습니다. 2에서 500 사이의 값을 수동으로 변경하여 자신만의 거래 시스템에 맞게 지표를 조정할 수 있습니다. 이 지표에는 빠른 이동평균선과 느린 이동평균선의 교차점으로 표시되는 시장 방향 지표가 내장되어 있으며, 추세를 직접 설정할 때는 이 기능을 비활성화할 수 있습니다. 이 지표는 M1부터 H4까지의 시간대에서 사용을 권장하며, 모든 거래 상품에 적용 가능합니다. 신호 화살표는 캔들 종
AriX
Temirlan Kdyrkhan
1 (4)
AriX Indicator for MT5 A powerful trend-following and signal-evaluation tool AriX is a custom MT5 indicator that combines Moving Averages and ATR-based risk/reward logic to generate clear buy/sell signals. It visualizes dynamic SL/TP levels, evaluates past trade outcomes, and displays win/loss statistics in a clean on-chart panel. Key features include: Buy/Sell signals based on MA crossovers ATR-based SL/TP1/TP2/TP3 levels with visual lines and labels Signal outcome tracking with real-time stat
Weltrade Spike Sentinel
Batsirayi L Marango
5 (1)
Introducing Indicator for PainX and GainX Indices Traders on Weltrade Get ready to experience the power of trading with our indicator, specifically designed for Weltrade   broker's PainX and GainX Indices.  Advanced Strategies for Unbeatable Insights Our indicator employs sophisticated strategies to analyze market trends, pinpointing optimal entry and exit points.  Optimized for Maximum Performance To ensure optimal results, our indicator is carefully calibrated for 5-minute timeframe charts on
Trend Lines PRO MT5
Roman Podpora
5 (1)
트렌드 라인즈 프로       이 지표는 시장이 실제로 어떤 방향으로 전환되는지 파악하는 데 도움이 됩니다. 실제 추세 반전 지점과 주요 시장 참여자들이 다시 진입하는 지점을 보여줍니다. 보시다시피       BOS 라인       복잡한 설정이나 불필요한 노이즈 없이 더 높은 시간대의 추세 변화와 주요 레벨을 확인할 수 있습니다. 신호는 차트에 다시 그려지지 않고 캔들이 마감된 후에도 계속 표시됩니다. MT4 버전   -   RFI LEVELS PRO   표시기   와 결합 시 최대 잠재력을 발휘합니다. 지표가 보여주는 내용: 실제 변화       추세(BOS 라인) 한 번 신호가 나타나면 그 신호는 계속 유효합니다! 이는 신호를 발생시킨 후 변경될 수 있는 리페인팅 방식의 지표와 중요한 차이점입니다. 리페인팅 방식의 지표는 잠재적으로 자금 손실로 이어질 수 있습니다. 이제 더욱 높은 확률과 정확도로 시장에 진입할 수 있습니다. 또한 화살표가 나타난 후 목표가(익절)에 도달하거나
KT Alpha Hunter Arrows MT5
KEENBASE SOFTWARE SOLUTIONS
대부분의 화살표 인디케이터는 신호만 보여주고, 나머지 판단은 모두 트레이더에게 맡깁니다. KT Alpha Hunter Arrows는 완성된 트레이딩 플랜을 제공합니다. 각 신호 화살표가 표시될 때마다 진입선, 손절선, 네 개의 익절 목표, 그리고 현재 심볼과 시간대가 지금 거래할 가치가 있는지 알려주는 실시간 엣지 판정이 함께 그려집니다. 포함된 Trade Manager EA는 사용자가 직접 진입한 뒤의 실행 관리를 맡아, 시장이 흔들리고 감정이 개입되기 쉬운 상황에서도 거래 원칙을 유지할 수 있도록 도와줍니다. 리페인트 없음. 종가 확정 후 신호만 표시. Forex, Gold, Indices 및 사용자가 거래하는 다양한 MT5 지원 상품에 맞게 설계되었습니다. 주요 기능 캔들이 마감된 후에만 표시되는 리페인트 없는 매수 및 매도 화살표. 각 신호마다 진입선, 구조적 손절선, 네 개의 익절 목표 표시. 현재 차트에서 매수와 매도 셋업을 별도로 평가하는 Edge Dashboard.
제작자의 제품 더 보기
As   well   as   SuperTrend, SuperTrend Alerts offers alerts . You   can   also   get   alerts   with   SuperTrend   Alerts . Besides   SuperTrend, SuperTrend Alerts   also   offers alerts . SuperTrend   Alerts offers alerts   along   with SuperTrend . In addition to SuperTrend, SuperTrend Alerts   has   alerts . Also , SuperTrend Alerts offers alerts . The   SuperTrend   Alerts   add-on   works   with   SuperTrend   as well. As   well   as   SuperTrend, SuperTrend Alerts   has   alerts   too .
A Market Profile (time price opportunity) implementation with an option to mark a point of control (POC) based on   volume   . Config: Hide default candles. Select a session time using exchange timezone. Experiment with tick multiplier value to achieve desired level of detail. Choose the symbols of your choice, e.g. squares or A-Z chars. For multiple sessions you will have to add additional instances of this script with a different time configuration. Limitations: TradingView has a hard limi
The Rainbow Multiple Moving Average (MMA) is a technical analysis tool used to identify trends and potential reversal points in financial markets. It is based on a system of moving averages that are designed to be used together, with each moving average having a different time frame. The Rainbow MMA consists of multiple exponential moving averages (EMAs) of different lengths, with each EMA plotted in a different color. Typically, the Rainbow MMA includes EMAs of 2, 3, 4, 5, 6, 7, 8, 9, 10, 11, a
The Sequential Ultimate Indicator is a modified version of the Ultimate Oscillator that adds a sequential component to the calculation. It is designed to identify potential trend reversals by looking for divergences between the price action and the oscillator. The Sequential Ultimate Indicator works by adding a sequential count to the Ultimate Oscillator readings. The sequential count starts at 1 when the oscillator moves above 70 or below 30 and continues until a price reversal occurs. The sequ
필터:
리뷰 없음
리뷰 답변