WAPV Full MT5
- 지표
- 버전: 2.87
- 업데이트됨: 13 5월 2024
- 활성화: 20

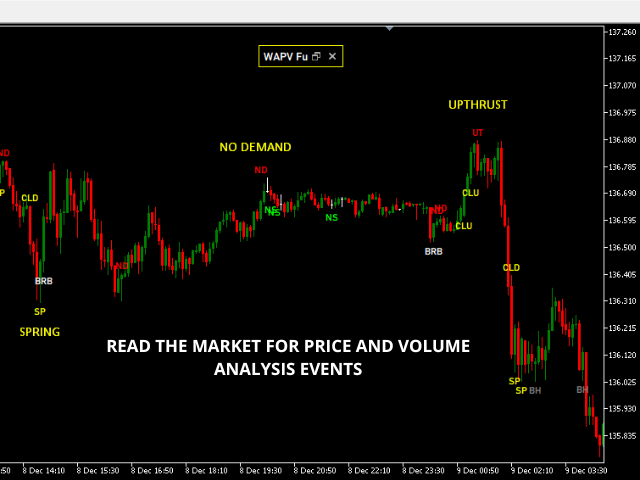
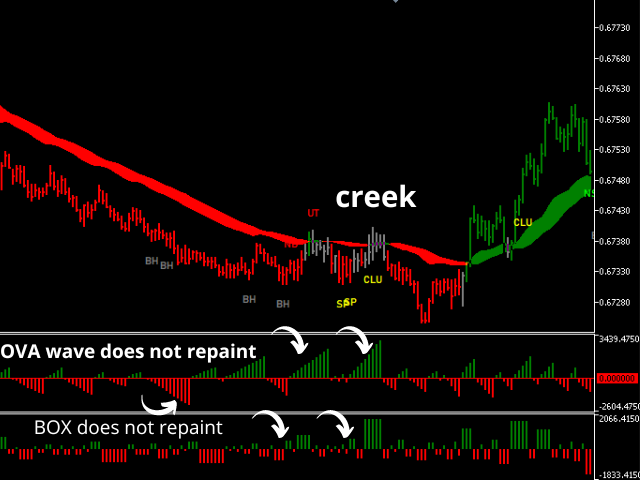
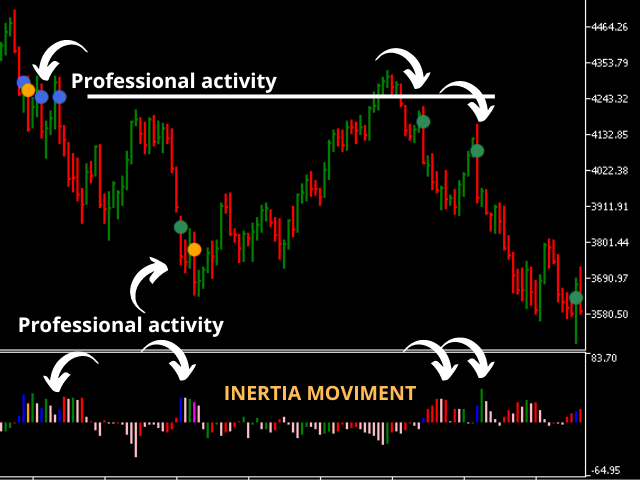
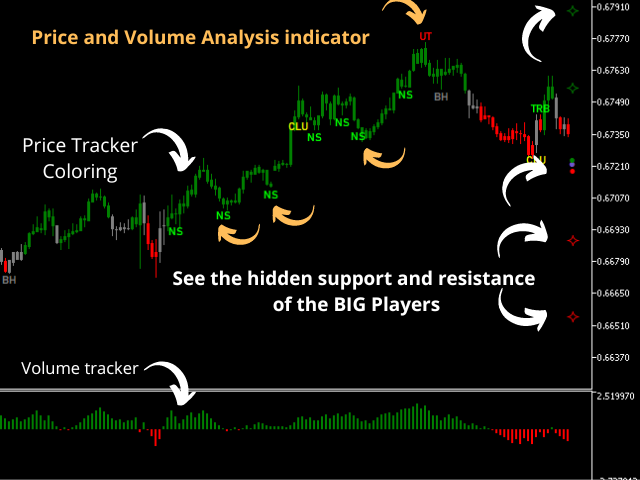
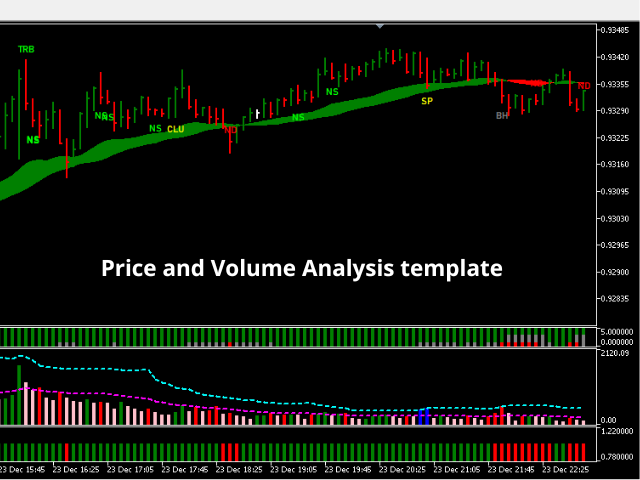
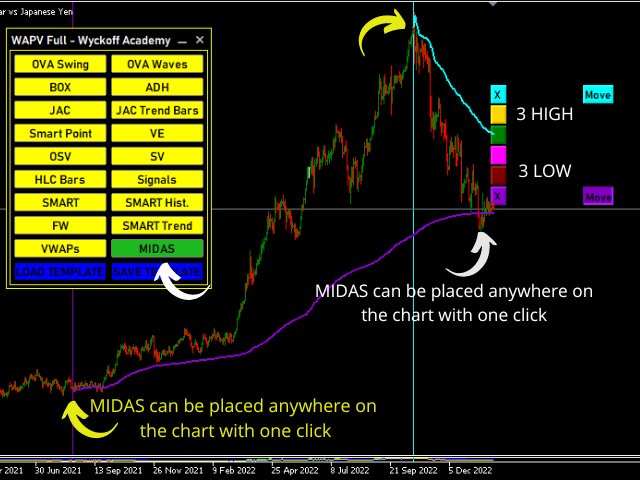
## WAPV Full을 사용하여 전문적으로 작동하고 추적할 수 있습니다. 큰 선수 돈은 어디에 있습니까 당신의 손에 혼자 읽기를 수행하는 도구가 있다고 상상해보십시오. 최고의 거래 지역을 보여주는 주요 마켓 플레이어의 가격 및 볼륨 분석을 기반으로 합니다. WAPV Full은 R. Wyckoff의 운영에 100% 초점을 맞춘 완전한 도구입니다. 거래 파동에서 시장 움직임을 매핑하는 것 외에도 매핑합니다. 가격과 거래량을 읽어 시장. 프로페셔널 마켓은 R. Wyckoff의 3가지 법칙에 따라 운영됩니다. # 원인과 결과 # 수요와 공급 # 노력 x 결과 이 모든 것이 WAPV Full로 제공되며 16가지 기본 도구를 제공합니다. 시장을 전문적으로 분석하고 결과적으로 결과를 개선하십시오. 내가 말하는 내용을 이해하려면 이미지와 비디오를 참조하십시오.
## WAPV Fulleul sayonghayeo jeonmunjeog-eulo jagdonghago chujeoghal su issseubnida.
keun seonsu don-eun eodie issseubnikka
dangsin-ui son-e honja ilg-gileul suhaenghaneun doguga issdago sangsanghaebosibsio.
choegoui geolae jiyeog-eul boyeojuneun juyo makes peulleieoui
gagyeog mich bollyum bunseog-eul giban-eulo habnida.
WAPV Fulleun R. Wyckoffui un-yeong-e 100% chojeom-eul majchun wanjeonhan dogu-ibnida.
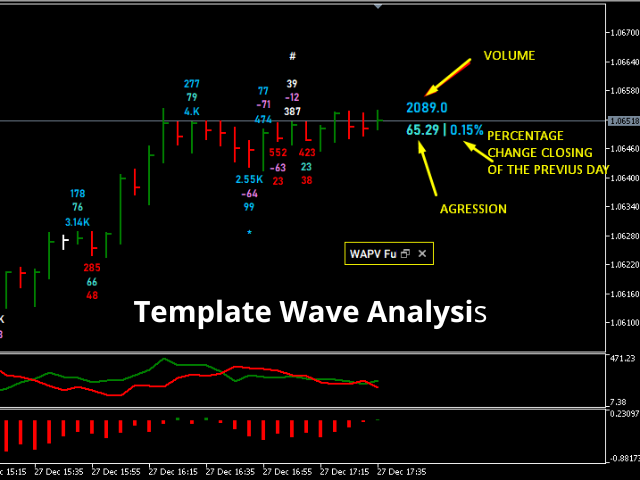
geolae padong-eseo sijang umjig-im-eul maepinghaneun geos oeedo maepinghabnida.
gagyeoggwa geolaelyang-eul ilg-eo sijang.
peulopesyeoneol makes-eun R. Wyckoffui 3gaji beobchig-e ttala un-yeongdoebnida.
# won-ingwa gyeolgwa
# suyowa gong-geub
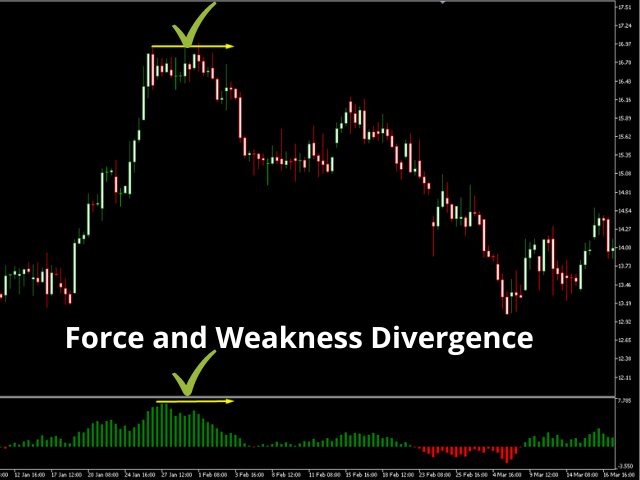
# nolyeog x gyeolgwa
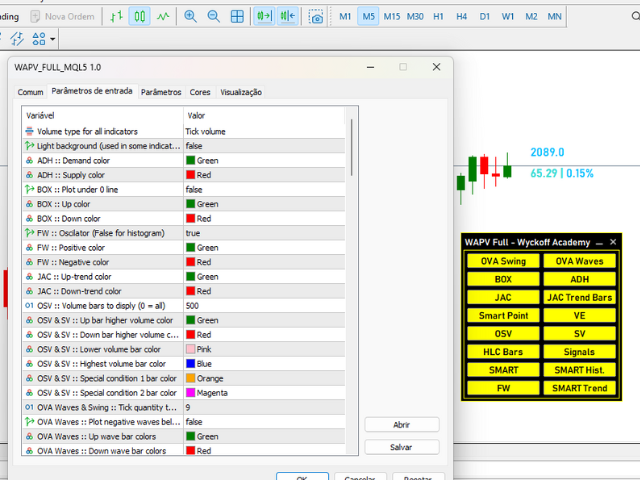
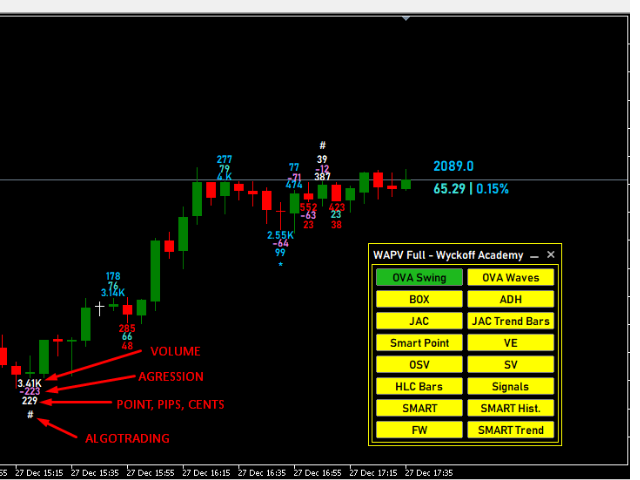
i modeun geos-i WAPV Fulllo jegongdoemyeo 16gaji gibon doguleul jegonghabnida.
sijang-eul jeonmunjeog-eulo bunseoghago gyeolgwajeog-eulo
gyeolgwaleul gaeseonhasibsio.
naega malhaneun naeyong-eul ihaehalyeomyeon imijiwa bidioleul chamjohasibsio. 


WAPV is good tool. Many indicators in it. I use it only 3 days, generally Im satisfied with this tool. Talk to seller on telegram. Good communication.