Live Dynamic Renko

This Renko is:

  • Live constantly updated on the market prices 
  • Dynamic updating on each new ATR value
  • Backtestable : Generating the chart during backtest, allowing Real Ticks Accuracy and Time Period Accuracy
  • Guppy Built-in: GMMA with 12 EMA built-in

This is what you are looking for!

RENKO

A Renko chart is a type of chart, developed by the Japanese, that is built using price movement rather than both price and standardized time intervals like most charts are. It is thought to be named after the Japanese word for bricks, "renga," since the chart looks like a series of bricks. A new brick is created when the price moves a specified price amount, and each block is positioned at a 45-degree angle (up or down) to the prior brick. 

Why Renko?

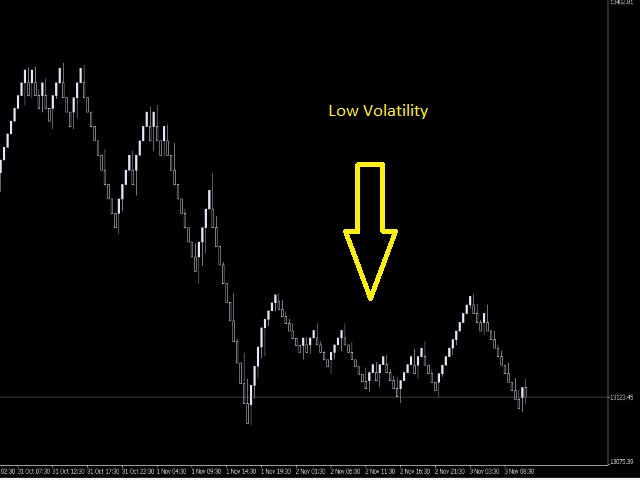
  • Renko charts filter out noise and help traders to more clearly see the trend, since all movements that are smaller than the box size are filtered out.

How does Dynamic Brick Size works?

  • Brick size can be based on the Average True Range (ATR), by setting a % of it's value of a determined Time Frame. It will be updating on each candle of the new ATR value, WITHOUT CHANGING THE PREVIOUS BRICK SIZES!
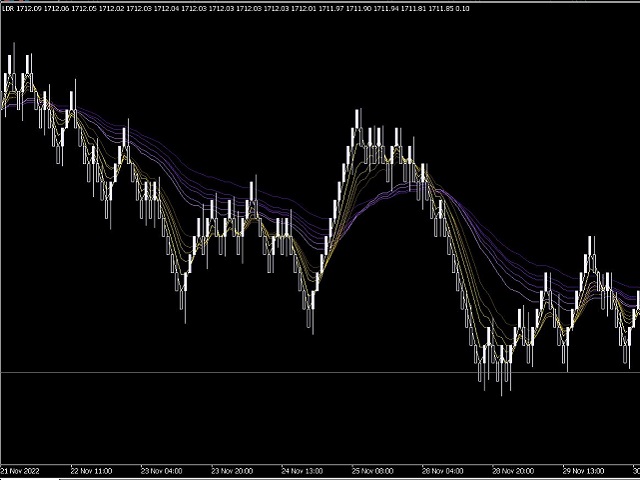
_ _ _ _ _ _ _ _ _ _ _ _ _ _ _ _ _ _ _ _ _ _ _ _ _ _ _ _ _ _ _ _ _ _ _ _ _ _ _ _ _ _ _ _ _ _ _ _ _ _ _ _ _ _ _ _ _ _ _ _ _ _ _ _ _ _ _ _ _ _ _ _ _ _ _ _ _ _ _ _ _ _ _ _ _ _ _ _ _ _ _ _ _ _ _ _ _ _ _ _ _ _ 

GUPPY

The Guppy Multiple Moving Average (GMMA) is a technical indicator that aims to anticipate a potential breakout in the price of an asset. The term gets its name from Daryl Guppy, an Australian financial columnist and book author who developed the concept in his book, "Trading Tactics." The GMMA consists of a short-term group of EMAs and a long-term group of EMAs, both containing six MAs, for a total of 12, and is overlaid on the price chart of an asset.

Why Guppy?

  • Guppy identifies changing trends, breakouts, and trading opportunities in the price of an asset by combining two groups of moving averages (EMA) with different time periods.
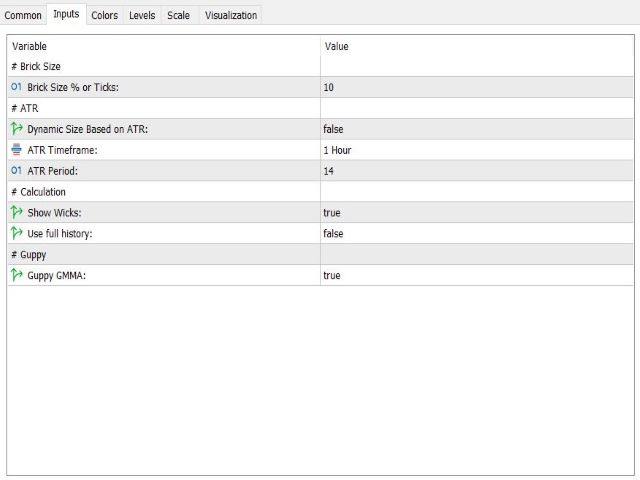
__________________________________________________________________________________________________________________________________________________________________

INPUTS

  • Brick Size : calculated as a Tick Amount or a % of the ATR value.
  • Dynamic Size Based on ATR : Must be turned on if calculating brick size on ATR. 
  • ATR Timeframe : Must be turned onif calculating brick size on ATR. The timeframe define the value of the ATR taken in consideration. This will determine the interval of time fro brick size to be updated.
  • ATR Period : Must be turned on if calculating brick size on ATR.
  • Show Wicks : On or Off.
  • Use Full History : Use all the available history data to calculate the past Renko Chart. That may take more time than when its off.
  • Guppy EMA : Show the Guppy indicator.

추천 제품
표시기는 현재 시세를 작성하여 과거 시세와 비교할 수 있으며 이를 바탕으로 가격 변동을 예측합니다. 표시기에는 원하는 날짜로 빠르게 이동할 수 있는 텍스트 필드가 있습니다. 옵션: 기호 - 표시기가 표시할 기호 선택. SymbolPeriod - 지표가 데이터를 가져올 기간 선택. IndicatorColor - 표시기 색상. HorisontalShift - 지시자가 그린 따옴표를 지정된 막대 수만큼 이동합니다. Inverse - true는 인용 부호를 반대로, false - 원래 보기를 반전합니다. ChartVerticalShiftStep - 차트를 수직으로 이동합니다(키보드의 위/아래 화살표). 다음은 날짜를 입력할 수 있는 텍스트 필드의 설정으로, '엔터'를 누르면 즉시 이동할 수 있습니다.
Donchian Time Sync Analyzer는   기존 Donchian 채널 분석에 강력한   다중 시간대   기능을 추가하여 트레이더가 다섯 가지 차트 기간에 걸쳐   추세 강도   와 잠재적   반전 신호를   동시에 모니터링할 수 있도록 합니다. 이 고급 지표는 선택한 시간대의 최고가와 최저가를 계산하여 여러 시간대에 걸쳐 추세 방향의 수렴을 파악하는 데 도움이 되는   명확한 시각적 신호를   생성합니다. 분 단위부터 시간 단위까지 통합된 분석을 제공함으로써 단일 시간대 도구보다 더 심층적인 시장 통찰력을 제공하여 트레이더가   중요한 돌파를 확인   하고 시간대 확인을 통해   잘못된 신호를 피할 수 있도록   지원합니다. 핵심 기능 이 정교한 도구는 검증된   돈키안 채널 전략을   여러 시간대에 걸쳐 동시에 적용하여 단기 가격 변동이 장기 추세와 일치하는지 여부를 보여주는 동기화된 신호를 표시합니다. 이 시스템은 선택한 시간대에서 가격이 중요한 지지선 또는 저항선
CurvedSmoothChannel_Enhanced - Enhanced Price Channel Indicator **CurvedSmoothChannel_Enhanced** is a powerful and visually appealing price channel indicator designed for MetaTrader 5 that helps you identify trends, potential reversals, and key price levels with precision. This enhanced version combines the power of the Hull Moving Average (HMA) and John Ehlers' Super Smooth Filter, creating a dynamic, adaptive channel that adjusts to market conditions across multiple time frames. #### Key Fea
BoxChart MT5
Evgeny Shevtsov
5 (7)
The market is unfair if only because 10% of participants manage 90% of funds. An ordinary trader has slim changes to stand against these "vultures". This problem can be solved. You just need to be among these 10%, learn to predict their intentions and move with them. Volume is the only preemptive factor that faultlessly works on any timeframe and symbol. First, the volume appears and is accumulated, and only then the price moves. The price moves from one volume to another. Areas of volume accumu
The professional tool of stock traders in now available on MetaTrader 5 . The Actual depth of market chart indicator visualizes the depth of market in the form of a histogram displayed on a chart, which refreshes in the real-time mode. Meet new updates according to user requests! Now Actual Depth of Market indicator displays the current ratio of volume of buy and sell requests (B/S ratio). It shows the share of volume of each type of requests in the entire flow of requests as well as the absolu
PulseAlgo
Hicham Mahmoud Almoustafa
5 (1)
PulseAlgo v4 — Smart Signal Indicator for MetaTrader 5 Overview PulseAlgo is a professional-grade chart indicator designed for traders who demand clean, high-probability signals without the guesswork. The toolkit combines multiple layers of analysis into a single, unified system that adapts automatically to whatever timeframe you trade. Every signal on your chart has been filtered through a multi-stage confirmation engine. No single indicator triggers an entry alone. Instead, the system requ
FREE
The balance of supply and demand is a simple and effective market analysis method. The supply and demand diagram can show you in advance, even before the trend reversal, where the supply ends and the demand is already emerging, where the demand ends and the supply is emerging, while substantially increasing the probability of making a deal in the right direction and with a high profit factor. Indicator signals The indicator uses the price/volume values to generate signals: ED – excess demand. E
Infinity Liquidity AI
Tumpa Sarkar
5 (1)
Infinity Liquidity AI - Premium MT5 Liquidity & Smart Money  If you are interested in using a professional liquidity-based MT5 indicator at the lowest possible price, this is the best time to purchase. Once the early slots are gone, the price will not stay the same. Free Bonus Indicator Included After purchase, message us from your profile and you will receive 1 premium indicator completely free with Infinity Liquidity AI. This bonus is included for buyers who contact us after purchase. You wil
The   Supply and Demand Zones indicator   is one of the best tools we have ever made. This great tool automatically draws supply and demand zones, the best places for opening and closing positions. It has many advanced features such as multi timeframe zones support, displaying the width of zones, alert notifications for retouched zones, and much more. Because of market fractality, this indicator can be used for any kind of trading. Whether you are a positional, swing, or intraday trader does no
Smart SD Rectangle Tool
Liam Alex Thomas Webb
스마트 공급 및 수요 사각형 도구 인디케이터는 MT5에서 최고의 동반자로, 주요 공급 및 수요 데이터를 즉시 시각화하여 필요한 곳에서 실시간으로 확인할 수 있습니다. 이 도구는 구역 위에 풍부하고 실행 가능한 데이터를 자동으로 오버레이하여 구역 분류, 핍 거리, 강도, 구역 크기 등을 각 구역 안에 깔끔하게 표시합니다. 더 이상 복잡함이나 추측이 필요 없습니다—명확하고 역동적인 인사이트로 여러분의 결정을 지원합니다. 트레이더를 위해 제작. 정밀함으로 구동. 인트라데이 스캘핑을 하든 일일 차트에서 주요 구역을 분석하든, 이 인디케이터는 수동으로 그린 구역을 즉시 스마트 구역으로 전환하여 작업 흐름을 방해하지 않으면서 차트의 정보 가치를 높입니다. ### 주요 기능 **자동 레벨 감지** - 차트상의 모든 구역을 즉시 인식 - 공급 또는 수요로 자동 분류—수동 태깅 불필요 **풍부한 실시간 메트릭** - 표시 항목:   - 구역 크기   - 현재 가격과의 실시간 핍 거리   -
LiquidiBars – Volume Width Candles is a next-generation MT5 charting indicator that visually reveals real market participation by dynamically adjusting candle width based on trading volume. Instead of treating every candle equally, LiquidiBars expands high-volume candles and compresses low-volume candles, giving you an immediate visual representation of market strength, liquidity, and momentum directly on your chart. This allows traders to instantly distinguish between strong institutional-drive
FREE
This is an open interest indicator for the Russian FORTS futures market. Now, you can receive data on the open interest in real time in МТ5 terminal. This allows you to develop brand new trading strategies or considerably improve the existing ones. The data on the open interest is received from the database (text CSV or binary one at user's discretion). Thus, upon completion of a trading session and disabling the terminal (or PC), the data is saved and uploaded to the chart when the terminal is
Dynamic Trend Sniper MT5
Vincent Georges David Ferrier
Trade Like an Institution. Protect Like a Professional. Early Sniper Access: Limited Launch Offer! Get ready to elevate your trading precision. We are offering an exclusive, highly limited launch price for the first Dynamic Trend Sniper users. Our Unbeatable Launch Offer: First 10 Snipers Only: $69 (Full lifetime access + all v1.x updates) Standard Retail Price (After 10 Purchases): $129 Why Act Now? This is not just a discount; it's a strategic entry point. We are committed to rewarding
Price Volume Distribution 가격 수준별 거래량 분포를 분석하는 Volume Profile 지표. MT5용 POC, Value Area, 거래량 급등 및 존 기반 신호 필터링을 표시합니다. 개요 Price Volume Distribution은 MetaTrader 5용 거래량 분석 지표입니다. M1 타임프레임 데이터를 사용하여 가격 수준별 거래량 분포를 계산하고 표시하며, 히스토그램 바와 참조선을 통해 시각적 표현을 제공합니다. 시스템 이해를 위한 사용자 가이드   |   기타 언어 사용자 가이드 주요 기능 지표가 식별하는 항목: - Point of Control (POC): 가장 높은 거래량의 가격 수준 - Value Area High/Low (VAH/VAL): 거래량의 70%를 포함하는 가격 범위 - 거래량 급등: 비정상적으로 높은 활동의 가격 수준 - 거래량 집중에 기반한 지지 및 저항 존 프로파일 모드 세 가지 계산 모드 제공: 1. 세션 모드:
This indicator provides an original mix of WPR, VSA, and volume delta. It shows ratio of buy/sell volumes scaled on 100% range based on total volume change for a selected period. The convetional VSA (Volume Spread Analysis) studies interconnections of price action and volume change in absolute values, whereas WPR (Williams Percent Range) offers a convenient approach of price moves normalization into the fixed percentage metric: 0 - 100%. Hence overbough and oversold states are easily spotted. N
Volume Profile Pro 보조지표 이 지표는 "어떤 가격대에서 가장 많은 거래가 일어났는지" 분석하는 Volume Profile Pro 도구입니다. 다음과 같은 특별한 기능이 있습니다: 표시 모드 (Display Modes) Volume Profile (일반): 각 가격대의 총 거래량(Total Volume)을 표시하여 중요한 지지 및 저항 구간을 보여줍니다. Delta / Money Flow: 매수세와 매도세(Buy vs Sell)의 "차이(Delta)"를 표시하여 해당 가격대에서 누가 시장을 주도하는지 보여줍니다. 거래량(Volume) 또는 자금 흐름(Money Flow)으로 선택하여 볼 수 있습니다. 계산 모드 (Calculation Modes) Pro 버전의 강점은 기간 설정의 유연성입니다: Fixed Mode (고정 모드): 과거 캔들 개수를 고정하여 설정합니다 (예: 최근 100개 캔들). Dynamic Mode (핵심 기능): 수직선(Vertical Line)이
Ma Extremes
Edoardo Centorame
MA Extremes   는 시장을 더 명확하고 빠르며 체계적으로 읽고자 하는 사람들을 위해 설계된 전문 MetaTrader 인디케이터입니다. 이 도구의 목적은 차트를 완전한 분석 지도처럼 바꾸어 지지선, 저항선, 핵심 구간, 이동평균선, 시각적 확인 요소가 함께 작동하도록 함으로써 트레이더가 가격 움직임을 더 잘 해석하고 시장에서 가장 중요한 구간을 더 분명하게 인식할 수 있도록 돕는 것입니다. MA Extremes   의 핵심은 고급 분석 시스템입니다. 이 시스템은 다양한 시장 요소, 추세 구조, 가격 움직임, 내부 확인 조건을 결합하여 더 깔끔하고 더 선별적인 차트 해석을 제공합니다. 차트에 나타나는 화살표는 임의로 생성되는 것이 아니며 하나의 요소에만 의존하지도 않습니다. 그것들은 전체 시장 상황을 더 깊이 평가한 결과입니다. 이런 구조 덕분에 이 도구는 실제로 주목할 가치가 있는 구간에 집중하고 싶은 트레이더에게 특히 유용합니다. MA Extremes   는 차트 위에 두
Visual Tiger Speed Indicator
AL MOOSAWI ABDULLAH JAFFER BAQER
Visual Tiger Speed Indicator: Unleash the Power of Market Velocity For just a one-time payment of $30, gain a lifetime edge in identifying explosive market moves before they happen. Are you tired of lagging indicators that only show you what has already occurred? The Visual Tiger Speed Indicator is a next-generation tool designed to measure the true, unfiltered velocity of price action, giving you a unique advantage in any market condition. It moves beyond simple price analysis to decode the mo
PZ Support Resistance MT5
PZ TRADING SLU
3.71 (7)
Unlock key market insights with automated support and resistance lines Tired of plotting support and resistance lines? This is a multi-timeframe indicator that detects and plots supports and resistance lines in the chart with the same precision as a human eye would. As price levels are tested over time and its importance increases, the lines become thicker and darker, making price leves easy to glance and evaluate. [ Installation Guide | Update Guide | Troubleshooting | FAQ | All Products  ] Boo
Volume Profile V6
Andrey Kolesnik
4.8 (5)
Market Volume Profile indicator + Smart Oscillator. 거의 모든 금융 상품에서 사용할 수 있습니다 — 통화쌍, 주식, 선물, 암호화폐 — 실제 거래량과 틱 거래량 모두를 지원합니다. 프로파일 계산 구간은 자동으로 설정할 수 있으며(예: 1주, 1개월 등), 또는 두 개의 경계선(빨간색과 파란색 수직선)을 이동하여 수동으로 설정할 수도 있습니다. 히스토그램 형태로 표시됩니다. 특정 가격 수준에서 히스토그램의 폭은 해당 가격대에서 이루어진 거래 수(개념적인 값)를 나타냅니다. "Mode level line color" 파라미터를 통해 가격이 높은 확률로 반응할 주요 거래량 레벨을 자동으로 표시할 수 있으며, "Maximum color (POC)" 파라미터는 선택된 구간에서 가장 많은 거래량이 발생한 가격 레벨을 별도로 표시합니다. Smart Oscillator는 과매수 및 과매도 구간을 표시합니다. 여러 인디케이터에서 전달되는 정보를 분석하고, 처
LevelsHunter Pro
Dmitrii Kovalevskii
LevelsHunter Pro – 전문가용 거래량 프로필 및 과거 분석 무엇인가요? LevelsHunter Pro는 현재 POC, VAH, VAL 레벨을 표시할 뿐만 아니라   과거로 돌아가   과거 거래 순간에 이 레벨들이 어디에 있었는지 볼 수 있는 거래량 프로필 지표입니다. 차트에서 추측하는 도구가 아닙니다. 이미 일어난 일을   냉정하게 분석 하기 위한 도구입니다. 트레이더에게 필요한 이유 문제점:   대부분의 지표는 '지금 여기'만 보여줍니다. 거래를 마감하고 실수를 분석하려고 하면 이미 레벨이 이동해 있습니다. POC가 진입가 위에 있었는지 아래에 있었는지 알 수 없습니다. 가격이 왜 반등했는지 또는 레벨을 돌파했는지 알 수 없습니다. 해결책:   LevelsHunter Pro는 모든 봉의 레벨을 기록합니다. 과거의 어떤 캔들이든 클릭하면 그 순간의 거래량 프로필을 정확히 볼 수 있습니다. 거래에서 어떻게 사용하나요? 1. 실시간 진입 개선 매수 신호가 보입니다. 가격이
Total Volume Profile
Shahabeddin Baset
Includes almost all the concepts related to Volume Profile: POC , Value Area , Developing POC , Anchored VWAP , Volume Delta ; since the “Total” in its name. It is fast in its calculations and simple to work with. Features: 1.    Selectable calculation timeframe to find most traded levels. 2.    Capable of calculating Volume Profile based on tick data 3.    Adjustable histogram bars by their count. 4.    Adjustable histogram bars by their height (price range). 5.    Showing Value Area (VA
Supply and Demand MTF MT5
Roman Zhitnik
4.75 (4)
This is a multi timeframe version of the  Supply and Demand indicator . It allows you to analyze a chart using the law of supply and demand on three different timeframes at a time. You will see zones of sales and purchases and determine the most profitable points to open positions. The indicator is based on the principle of market fractality. Supply and demand zones show places where a strong buyer or seller has made the price reverse and change its direction. The indicator has several types of
FREE
Blahtech Market Profile MT5
Blahtech Limited
5 (10)
Was: $249  Now: $99   Market Profile defines a number of day types that can help the trader to determine market behaviour. A key feature is the Value Area, representing the range of price action where 70% of trading took place. Understanding the Value Area can give traders valuable insight into market direction and establish the higher odds trade. It is an excellent addition to any system you may be using. Inspired by Jim Dalton’s book “Mind Over Markets”, this indicator is designed to suit the
PivotWave
Jeffrey Quiatchon
Introducing PivotWave – your ultimate trading companion that redefines precision and market analysis. Designed with traders in mind, PivotWave is more than just an indicator; it’s a powerful tool that captures the pulse of the market, identifying key turning points and trends with pinpoint accuracy. PivotWave leverages advanced algorithms to provide clear visual signals for optimal entry and exit points, making it easier for traders to navigate volatile market conditions. Whether you are a begin
Strivex Supply/Demand 인디케이터 (MetaTrader 5) Strivex Algo 의 Supply/Demand 인디케이터는 중요한 공급 및 수요 존을 자동으로 식별하고 , 시장 구조 돌파 (BOS) 를 표시하며 , 트레이더에게 실시간으로 알림을 보냅니다 . 특징 : 차트의 시간 주기를 변경해도 존은 유지됩니다 . 예를 들어 , M15 차트에서 H1 존을 표시해도 다시 그리거나 삭제되지 않습니다 . 주요 기능 스윙 고점 및 저점을 기반으로 한 자동 존 탐지 최근 존만 표시하여 깔끔한 차트 유지 겹치거나 너무 가까운 존을 방지하는 근접 필터 추세 신호로서의 Break of Structure (BOS) 스윙 라벨 (HH/HL/LH/LL) 선택적 표시 알림 : 팝업 , 푸시 , 이메일 ️ Input Parameters ( 설명 )   Input Parameter   설명   Timeframe for zone detection  공급/수요 존이 계산되는 시간
이 지표는 하루 중 거래 활동이 가장 많은 시간을 결정하도록 설계되었습니다. 이 계산 후 지표는 가장 중요한 거래 수준을 구축합니다. 이러한 수준을 실제 가격 움직임과 비교하면 시장 추세의 강도와 방향에 대한 정보를 얻을 수 있습니다. 지표의 특징 기간은 D1 미만이어야 합니다. 권장 기간: M15, M30 및 H1. H1 이상의 시간대는 매우 대략적인 그림을 제공할 수 있습니다. 그리고 M15 미만의 기간을 사용하면 짧은 거래 폭증으로 이어질 수 있습니다. 지표는 과거 데이터에 민감합니다. 따라서 차트 창에 최소 50,000개 이상의 막대를 설정하는 것이 좋습니다. 표시기 매개변수 Base - 거래 활동을 계산하기 위한 기준 기간을 설정합니다. day - 거래 활동은 시간을 고려하여 계산됩니다. week – 거래 활동은 시간과 요일을 고려하여 계산됩니다. Width - 선 너비. ClrMean, ClrUp 및 ClrDn은 중간, 상위 및 하위 거래 수준의 색상입니다. Sty
Before installing the HeatMap indicator make sure you are using a broker that gives you access to the Depth of market (DOM) !! This indicator creates a heatmap on your chart allowing you to see the buy or sell limit orders easily and in real time. You have the possibility to change the setting and the colors of the HeatMap in order to adapt to all markets and all charts. Here is an example of a setting you can use with the NASDAQ100 on the AMPGlobal broker :  https://www.youtube.com/watch?v=x0Y
Price Volume Trend (PVT) Oscillator Description:  The PVT Oscillator is a volume indicator that serves as an alternative to the standard On-Balance Volume (OBV). While ordinary volume indicators can be noisy and hard to read, this tool converts volume flow into a clear Histogram Oscillator, similar to a MACD, but for Volume. It is designed to detect first  Trend Reversals and Divergences by analyzing the difference between a Fast and Slow PVT moving average. Why is this better than standard OBV?
FREE
This indicator shows the ratio of the number of buyers'/sellers' orders for the Russian FORTS futures market. Now, you can receive this information in real time in your МetaТrader 5 terminal. This allows you to develop brand new trading strategies or improve the existing ones. The data on the ratio of the orders number is received from the database (text CSV or binary one at user's discretion). Thus, upon completion of a trading session and disabling the terminal (or PC), the data is saved and u
이 제품의 구매자들이 또한 구매함
Neuro Poseidon MT5
Daria Rezueva
4.95 (19)
Neuro Poseidon is a new indicator by Daria Rezueva. It combines precise trading signals with adaptive TP/SL levels - creating best possible trades as a result! Message me and get  Neuro Poseidon Assistant  as a gift to automize your trading process! What makes it stand out? 1. Proven profitability on all assets and timeframes 2. Only confirmed BUY and SELL signals present on the chart 3. Adaptive TP & SL levels generated by the software for each trade 4. Easy to understand - suitable for al
PrimeScalping
Temirlan Kdyrkhan
PrimeScalping is a powerful trading companion designed to generate high-probability entry signals with dynamic TP/SL/DP levels based on volatility. Built-in performance tracking shows win/loss stats, PP1/PP2 hits, and success rates — all updated live. Key Features: Buy/Sell signals with adaptive volatility bands Real-time TP/SL/DP levels based on ATR Built-in MA Filter with optional ATR/StdDev volatility Performance stats panel (Success, Profit/Loss, PP1/PP2) Alerts via popup, sound, push, or e
SuperScalp Pro
Van Minh Nguyen
4.65 (26)
SuperScalp Pro – 고급 멀티 필터 스캘핑 지표 시스템 SuperScalp Pro는 클래식 Supertrend와 여러 지능형 확인 필터를 결합한 고급 스캘핑 지표로, 거래 기회를 식별하는 데 도움을 줍니다. M1부터 H4까지 다양한 시간대에서 효율적으로 작동하며, XAUUSD, BTCUSD 및 주요 Forex 통화쌍에 최적화되어 있습니다. 이 지표는 명확한 매수 및 매도 신호를 제공하며, ATR 기반으로 진입가, 손절가, 익절가를 자동 계산하여 보다 효과적인 리스크 관리를 지원합니다. Fibonacci Take Profit 기능은 중요한 가격 구간에서 더 빠르게 포지션을 청산할 수 있도록 하며, 해당 수준 도달 시 알림을 전송합니다. 기본 설정은 Fibonacci Take Profit이 활성화된 상태로 최적화되어 있으며, 보다 안정적이고 일관된 거래 경험에 중점을 둡니다. 차트에 적용하는 것만으로 즉시 사용할 수 있습니다. 고급 사용자를 위해 모든 파라미터는 자유롭게 사용
Divergence Bomber
Ihor Otkydach
4.9 (90)
이 지표를 구매하신 분께는 다음과 같은 혜택이 무료로 제공됩니다: 각 거래를 자동으로 관리하고, 손절/익절 수준을 설정하며, 전략 규칙에 따라 거래를 종료하는 전용 도우미 툴 "Bomber Utility" 다양한 자산에 맞게 지표를 설정할 수 있는 셋업 파일(Set Files) "최소 위험", "균형 잡힌 위험", "관망 전략" 모드로 설정 가능한 Bomber Utility의 셋업 파일 이 전략을 빠르게 설치, 설정, 시작할 수 있도록 돕는 단계별 영상 매뉴얼 주의: 위의 모든 보너스를 받기 위해서는 MQL5 개인 메시지 시스템을 통해 판매자에게 연락해 주세요. 독창적인 커스텀 지표인 “Divergence Bomber(다이버전스 봄버)”를 소개합니다. 이 지표는 MACD 다이버전스(괴리) 전략을 기반으로 한 올인원(All-in-One) 거래 시스템입니다. 이 기술 지표의 주요 목적은 가격과 MACD 지표 간의 다이버전스를 감지하고, **향후 가격이 어느 방향으로 움직일지를 알려주는
Entry In The Zone and SMC Multi Timeframe is a real-time 2-in-1 market analysis tool that combines market structure analysis and a No Repaint BUY / SELL signal system into a single indicator, built on Smart Money Concepts (SMC) — a widely adopted framework used by professional traders to understand market structure. This indicator helps you see the market more clearly, make decisions based on structure rather than guesswork, and focus on high-probability zones where price is more likely to react
SMC Intraday Formula
Kareem Abbas
5 (13)
먼저 솔직하게 말하겠습니다. 어떤 인디케이터도 단독으로 당신을 수익성 있게 만들어주지 않습니다. 누군가 그렇게 말한다면, 그는 당신에게 꿈을 파는 것입니다. 완벽한 매수/매도 화살표를 보여주는 모든 인디케이터는 완벽하게 보이도록 만들 수 있습니다 — 단지 올바른 과거 구간을 확대하고 승리한 거래만 캡처하면 됩니다. 우리는 그렇게 하지 않습니다.  SMC Intraday Formula는 도구입니다. 시장 구조를 읽고, 가장 높은 확률의 가격 구간을 표시하며, 현재 스마트 머니의 흐름이 어떻게 보이는지 아주 단순한 언어로 보여줍니다. 최종 결정은 여전히 당신이 합니다. 실행도 당신이 합니다. 하지만 이제는 희망이 아니라 정확성으로 거래하게 됩니다. 우리는 이 인디케이터를 지난 약 3년 동안 골드(XAUUSD) 및 주요 외환 통화쌍의 데이 트레이딩 스캘핑에 사용해 왔습니다. M1, M5, M15, M30에서 우리의 핵심 도구입니다. 이 도구는 미래를 예측하려 하지 않습니다 — 지금 형성
SignalTech MT5
Yue Wang
5 (26)
SignalTech MT5 is an unique fully rule based trading system for EURUSD, USDCHF, USDJPY, AUDUSD, NZDUSD, EURJPY, AUDJPY, NZDJPY, CADJPY.  All the winning trades with chart setups are published on the comments page. 2026-05 4107 Pips (Until 05-29 NY Closed) 2026-04 2243 Pips 2026-03 2165 Pips 2026-02 2937 Pips 2026-01 2624 Pips 2025-12 1174 Pips It can generate signals with Buy/Sell Arrows and Pop-Up/Sound Alerts. Each signal has clear Entry and Stop Loss levels, which should be automatically flag
Power Candles MT5
Daniel Stein
5 (8)
Power Candles V3 - 자체 최적화 강도 지표 파워 캔들 V3는 적용된 모든 차트에서 통화 및 상품의 강세를 실행 가능한 거래 계획으로 전환합니다. 단순히 캔들에 색상을 입히는 대신, 백그라운드에서 실시간 자동 최적화를 수행하여 현재 보고 있는 종목에 대한 최적의 손절매, 익절 및 신호 임계값을 제공합니다. 한 번의 클릭으로 실시간 거래에 적용할 수 있으며, 진입점, 손절매 및 익절 선이 정확한 가격에 맞춰 차트에 표시되고, 방향과 함께 알림이 발령됩니다. 이 도구는 Stein Investments 에코시스템의 일부입니다. 18개 이상의 도구와 함께 당신의 1대1 AI 트레이딩 멘토 Max.  항상 대기 중, 모든 인디케이터를 깊이 있게 이해, 무언가를 차근차근 생각해보고 싶은 순간에 도움을 줍니다.  https://stein.investments 에서 만나보세요 매 종가 바마다 3,000회 이상의 트레이딩 시뮬레이션. 9가지 강도 상태. 2가지 전략을 병렬로 테스트.
이 제품은 2026년 시장에 맞게 업데이트되었으며 최신 MT5 빌드에 최적화되었습니다. 가격 업데이트 안내: Smart Trend Trading System은 현재 $99 에 제공됩니다. 다음 30회 구매 후 가격은 $199 로 인상됩니다. 특별 혜택: Smart Trend Trading System 구매 후 저에게 개인 메시지를 보내시면 Smart Universal EA를 무료 로 받을 수 있으며, Smart Trend 신호를 자동 거래로 전환할 수 있습니다. Smart Trend Trading System은 리페인트 없음, 재그리기 없음, 지연 없음의 완전한 트레이딩 시스템으로, 더 깨끗한 신호, 더 나은 추세 방향, 그리고 더 체계적인 시장 거래 방식을 원하는 트레이더를 위해 제작되었습니다. Online course , manual and download presets . 이 시스템은 추세 감지, 반전 구간, Smart Cloud, 트레일링 스톱 로직, 지지와 저항, 캔들 색
소개       Quantum Breakout PRO   , 브레이크아웃 존 거래 방식을 변화시키는 획기적인 MQL5 지표! 13년 이상의 거래 경험을 가진 숙련된 트레이더 팀이 개발한       퀀텀 브레이크아웃 PRO       혁신적이고 역동적인 브레이크아웃 존 전략으로 거래 여정을 새로운 차원으로 끌어올리도록 설계되었습니다. Quantum Breakout Indicator는 5개의 이익 목표 영역이 있는 브레이크아웃 영역의 신호 화살표와 브레이크아웃 상자를 기반으로 한 손절 제안을 제공합니다. 초보자 거래자와 전문 거래자 모두에게 적합합니다. Quantum EA 채널:       여기를 클릭하세요 중요한! 구매 후 설치 매뉴얼을 받으려면 개인 메시지를 보내주십시오. 추천: 기간: M15 통화쌍: GBPJPY, EURJPY, USDJPY,NZDUSD, XAUUSD 계정 유형: 스프레드가 매우 낮은 ECN, Raw 또는 Razor 브로커 시간: GMT +3 중개인 :
Azimuth Pro
Ottaviano De Cicco
5 (7)
Azimuth Pro V2: Synthetic Fractal Structure and Confirmed Entries for MT5 Overview Azimuth Pro is a multi-level swing structure indicator by Merkava Labs . Four nested swing layers, swing-anchored VWAP, ABC pattern detection, three-timeframe structural filtering, and closed-bar confirmed entries — one chart, one workflow from micro-swings to macro-cycles. This is not a blind signal product. It is a structure-first workflow for traders who care about location, context, and timing. V2 Launch Offe
GoldenX Entry MT5
Kareem Abbas
5 (9)
GoldenX Entry는 MT5용 인디케이터로, 적응형 Smart Entry Trend 알고리즘, 신호 스코어링 시스템, 시장 레짐 감지 기능, 그리고 변동성 필터를 포함합니다. 각 신호에는 계산된 진입 레벨, 3개의 익절(TP1, TP2, TP3) 레벨, 그리고 손절(Stop-Loss) 레벨이 포함됩니다. 이 인디케이터는 다양한 시장 환경에 적응하도록 설계된 다중 분석 레이어 구조 위에 구축되어 있으며, 내장 최적화기와 통계 추적 시스템을 결합합니다. 또한 Risk-to-Reward(RR) 지표와 과거 거래 행동 기반의 정량 분석을 제공합니다. 시작은 간단합니다 — 선택한 타임프레임에서 최적화기를 실행한 뒤 차트에서 바로 인디케이터를 사용하면 됩니다. 핵심 기능 GoldenX Entry는 하나의 차트에서 신호 엔진, 트레이드 관리 기능, 그리고 과거 통계 추적을 통합합니다: - 내장 최적화기: 최적화기는 차트에서 원클릭으로 실행됩니다. 200개의 파라미터 조합을 두 단계 탐색
Quantum TrendPulse
Bogdan Ion Puscasu
5 (25)
SuperTrend   ,   RSI   ,   Stochastic   의 힘을 하나의 포괄적인 지표로 결합하여 트레이딩 잠재력을 극대화하는 궁극의 트레이딩 도구   인 Quantum TrendPulse를   소개합니다. 정밀성과 효율성을 추구하는 트레이더를 위해 설계된 이 지표는 시장 추세, 모멘텀 변화, 최적의 진입 및 종료 지점을 자신 있게 식별하는 데 도움이 됩니다. 주요 특징: SuperTrend 통합:   주요 시장 추세를 쉽게 따라가고 수익성의 물결을 타세요. RSI 정밀도:   매수 과다 및 매도 과다 수준을 감지하여 시장 반전 시점을 파악하는 데 적합하며 SuperTrend 필터로 사용 가능 확률적 정확도:   변동성이 큰 시장에서 숨겨진 기회를 찾기 위해 확률적 진동   을 활용하고 SuperTrend의 필터로 사용 다중 시간대 분석:   M5부터 H1 또는 H4까지 다양한 시간대에 걸쳐 시장을 최신 상태로 유지하세요. 맞춤형 알림:   맞춤형 거래 조건이 충족되면
FX Trend MT5 NG
Daniel Stein
5 (6)
FX Trend NG: 차세대 멀티 마켓 트렌드 인텔리전스 개요 FX Trend NG 는 다중 시간 프레임 기반의 전문 트렌드 분석 및 시장 모니터링 도구입니다. 몇 초 만에 전체 시장 구조를 파악할 수 있도록 설계되었습니다. 여러 차트를 일일이 전환할 필요 없이, 어떤 종목이 추세에 있는지, 어디에서 모멘텀이 약화되고 있는지, 그리고 어떤 시간 프레임이 서로 정렬되어 있는지 즉시 확인할 수 있습니다. 출시 기념 특별 혜택 – FX Trend NG 를 $30 (6개월) 또는 $80 평생 라이선스 로 이용할 수 있습니다. 이미 Stein Investments 고객이신가요? -> 메시지를 보내 전용 고객 그룹에 참여하세요. 설정이나 사용 방법이 필요하신가요? -> Stein Investments 공식 페이지 를 방문하세요. 1. FX Trend NG가 특별한 이유 3단계 추세 로직 – 단순한 Buy / Sell이 아닙니다 • 대부분의 지표는 Buy 또는 Sell 두 가지 상태만 제
Trend Catcher ind mt5
Ramil Minniakhmetov
5 (4)
트렌드 캐처 인디케이터 트렌드 캐처 인디케이터는 개발자가 자체 개발한 맞춤형 적응형 트렌드 분석 지표들을 조합하여 시장 가격 움직임을 분석합니다. 단기적인 노이즈를 제거하고 근본적인 모멘텀 강도, 변동성 확대, 가격 구조 움직임에 집중하여 진정한 시장 방향을 파악합니다. 또한 이동 평균, RSI, 변동성 필터와 같은 맞춤형 지표들을 활용하여 가격을 평활화하고 트렌드를 필터링합니다. 실제 운영 모니터링 및 기타 제품은 다음 링크에서 확인하실 수 있습니다:   https://www.mql5.com/en/users/mechanic/seller 텔레그램에서는 EA나 설정 파일을 판매하지 않습니다. 사기이니 주의하세요. 모든 설정 파일은 블로그에서 무료로 제공됩니다. 중요! 구매 후 즉시 연락 주시면 사용 방법 및 보너스를 드립니다!
Gann Made Easy MT5
Oleg Rodin
5 (5)
Gann Made Easy 는 mr.의 이론을 사용하여 최고의 거래 원칙을 기반으로 하는 전문적이고 사용하기 쉬운 Forex 거래 시스템입니다. W.D. 간. 이 표시기는 Stop Loss 및 Take Profit Levels를 포함하여 정확한 BUY 및 SELL 신호를 제공합니다. PUSH 알림을 사용하여 이동 중에도 거래할 수 있습니다. 구매 후 거래 방법 안내 및 유용한 추가 지표를 무료로 받으시려면 저에게 연락주세요! 아마도 Gann 거래 방법에 대해 이미 여러 번 들었을 것입니다. 일반적으로 Gann의 이론은 초보자 거래자뿐만 아니라 이미 거래 경험이 있는 사람들에게도 매우 복잡한 것입니다. Gann의 거래 방식은 이론적으로 적용하기 쉽지 않기 때문입니다. 나는 그 지식을 연마하고 Forex 지표에 최고의 원칙을 적용하기 위해 몇 년을 보냈습니다. 표시기는 적용하기가 매우 쉽습니다. 차트에 첨부하고 간단한 거래 권장 사항을 따르기만 하면 됩니다. 지표는 지속적으로 시장 분석
이 제품은 2026년 시장에 맞게 업데이트되었으며 최신 MT5 빌드에 최적화되었습니다. 가격 업데이트 안내: Smart Price Action Concepts는 현재 $200 에 제공됩니다. 다음 30회 구매 후 가격은 $299 로 인상됩니다. 특별 혜택: 구매 후 저에게 개인 메시지를 보내시면 무료 보너스 + 선물 을 받을 수 있습니다. 먼저, 이 트레이딩 도구는 리페인트 없음, 재그리기 없음, 지연 없음의 인디케이터이므로 전문적인 트레이딩에 적합하다는 점을 강조하고 싶습니다. Online course , and manual Smart Price Action Concepts Indicator는 초보자와 경험 많은 트레이더 모두에게 매우 강력한 도구입니다. 20개 이상의 유용한 인디케이터를 하나로 결합하고, Inner Circle Trader Analysis와 Smart Money Concepts Trading Strategies 같은 고급 트레이딩 아이디어를 통합합니다. 이 인디
RelicusRoad Pro MT5
Relicus LLC
4.96 (24)
RelicusRoad Pro: 퀀트 시장 운영 체제 70% 할인 평생 이용권 (한정 시간) - 2,000명 이상의 트레이더와 함께하세요 왜 대부분의 트레이더는 "완벽한" 지표를 가지고도 실패할까요? 진공 상태에서 단일 개념 만으로 거래하기 때문입니다. 문맥 없는 신호는 도박입니다. 지속적인 승리를 위해서는 컨플루언스(중첩) 가 필요합니다. RelicusRoad Pro는 단순한 화살표 지표가 아닙니다. 완전한 퀀트 시장 생태계 입니다. 독점적인 변동성 모델링을 사용하여 가격이 이동하는 "공정 가치 로드"를 매핑하고, 단순 노이즈와 실제 구조적 돌파를 구분합니다. 추측은 그만두세요. 기관급 로드 로직으로 거래를 시작하세요. 핵심 엔진: "Road" 알고리즘 시스템의 중심에는 시장 상황에 실시간으로 적응하는 동적 변동성 채널인 Road Algo 가 있습니다. 세이프 라인(평형) 과 가격이 수학적으로 반전될 가능성이 높은 확장 레벨 을 투영합니다. Simple Road: 일반적인 시장을 위
ARIPoint
Temirlan Kdyrkhan
1 (1)
ARIPoint is a powerful trading companion designed to generate high-probability entry signals with dynamic TP/SL/DP levels based on volatility. Built-in performance tracking shows win/loss stats, PP1/PP2 hits, and success rates all updated live. Key Features: Buy/Sell signals with adaptive volatility bands Real-time TP/SL/DP levels based on ATR Built-in MA Filter with optional ATR/StdDev volatility Performance stats panel (Success, Profit/Loss, PP1/PP2) Alerts via popup, sound, push, or email Cu
Meta Trend PRO MT5
Roman Podpora
5 (1)
메타 트렌드 프로       — 는 추세 추종 도구로, 거래에서 추측을 배제하고 시장이 이미 결정을 내린 지점을 보여줍니다. 이 지표는 추세, 추세선 및 구조가 변화하는 주요 지점을 식별하고 주요 참여자들이 포지션을 취할 수 있도록 가격이 되돌아오는 영역을 강조합니다. 단순히 가격 움직임만 보는 것이 아니라, 그 이면에 숨겨진 논리까지 이해할 수 있습니다. 모든 신호는 캔들 마감 후 기록되며, 다시 그려지지 않고 차트에 저장되므로 상황을 확실하게 분석하고 결정을 내릴 수 있습니다. 거래 목표(이익 실현) 또한 표시됩니다. 이 지표의 효과에 대해 완벽한 확신을 가지실 수 있도록 자동 통계 자료를 제공해 드립니다. 방향 전환 후에는 손절매 수준과 해당 수준이 지능적으로 점진적으로 이동하는 모습(Move SL)을 표시해주는데, 이는 매우 중요합니다.       감소시킨다       위험       위치별로. 손절매/이익실현/RR 오른쪽에 내장된 패널은 현재 글로벌 추세 방향의 시장 진입
M30/H1/H4 스윙 버전 출시 큰 움직임을 잡고 싶으신가요? Gold Signal Swing Pro (M30/H1/H4). 목표: 거래당 $20-$80+. https://www.mql5.com/en/market/product/177643 KURAMA GOLD SIGNAL PRO (MT5) — 7층 필터 탑재 XAUUSD 완벽 트레이딩 시스템 리페인트 없음. 리드로우 없음. 지연 없음. 모든 신호는 확정 후 변하지 않습니다. 구매자 한정 혜택: 매수 라이선스 구매자에게 AI Zone Radar ($59 상당) + PDF 매뉴얼을 무료 제공합니다. 구매 후 MQL5에서 메시지를 보내주세요. AI Zone Radar: https://www.mql5.com/en/market/product/175834 실제 골드 트레이더 커뮤니티에서 사용되며, 정확도와 사용 편의성으로 높은 평가를 받고 있습니다.
Atomic Analyst MT5
Issam Kassas
4.26 (35)
이 제품은 2026년 시장에 맞게 업데이트되었으며 최신 MT5 빌드에 최적화되었습니다. 가격 업데이트 안내: Atomic Analyst는 현재 $99 에 제공됩니다. 다음 30회 구매 후 가격은 $199 로 인상됩니다. 특별 혜택: Atomic Analyst 구매 후 저에게 개인 메시지를 보내시면 Smart Universal EA를 무료 로 받을 수 있으며, Atomic Analyst 신호를 자동 거래로 전환할 수 있습니다. Atomic Analyst는 리페인트 없음, 재그리기 없음, 지연 없음의 Price Action 거래 인디케이터로, 수동 거래, 신호 명확성, EA 자동화를 위해 설계되었습니다. User manual: settings, inputs and strategy. 가격 움직임, 강도, 모멘텀, 다중 시간대 방향 및 고급 필터를 분석하여 트레이더가 노이즈를 줄이고 약한 세팅을 피하며 더 체계적인 거래 결정을 내릴 수 있도록 돕습니다. 이 인디케이터는 복잡한 시장 계산
Reversion King Indicator
Eugen-alexandru Zibileanu
5 (4)
새로운 왕의 등장 - 인디케이터 + 주문 관리 표시(TP1 + TP2 + TP3) + 선택형 텔레그램 시그널 전송 기능 포함 (무료) (완전한 트레이딩 및 시그널 시스템) 골드를 위한 최고의 EA: Gold Slayer 이 인디케이터는 고급 전략, 사용자 지정 가능한 주문 관리 시스템, 그리고 엔벨로프 확장을 결합한 평균 회귀(mean reversion) 시스템을 포함하고 있습니다. 또한 RSI와 같은 여러 지능형 확인 필터를 통해 높은 확률의 반전 진입 구간을 포착하여 BUY 및 SELL 시그널을 제공합니다. 단순히 거래 방법만 배우는 것이 아니라, 여러 포지션을 효과적으로 관리하고 이전에 수익 중인 오픈 포지션으로 손실 거래를 커버하는 방법까지 익힐 수 있습니다. M5 전용으로 설계 및 최적화되었으며, 유동성이 풍부해 시그널이 더 깔끔하고 신뢰도 높은 BTCUSD와 XAUUSD에서 뛰어난 성능을 발휘합니다. 이 인디케이터는 ATR 기반으로 자동 계산된 진입가, 손절가, 익절가와
FX Power MT5 NG
Daniel Stein
5 (32)
FX Power: 통화 강세 분석으로 더 스마트한 거래 결정을 개요 FX Power 는 어떤 시장 상황에서도 주요 통화와 금의 실제 강세를 이해하기 위한 필수 도구입니다. 강한 통화를 매수하고 약한 통화를 매도함으로써 FX Power 는 거래 결정을 단순화하고 높은 확률의 기회를 발견합니다. 트렌드를 따르거나 극단적인 델타 값을 사용해 반전을 예측하고자 한다면, 이 도구는 귀하의 거래 스타일에 완벽히 적응합니다. 단순히 거래하지 말고, FX Power 로 더 스마트하게 거래하세요. 1. FX Power가 거래자에게 매우 유용한 이유 통화와 금의 실시간 강세 분석 • FX Power 는 주요 통화와 금의 상대적 강세를 계산하고 표시하여 시장 역학에 대한 명확한 통찰력을 제공합니다. • 어떤 자산이 앞서고 있고 어떤 자산이 뒤처지는지 모니터링하여 보다 현명한 거래 결정을 내릴 수 있습니다. 포괄적인 멀티 타임프레임 뷰 • 단기, 중기 및 장기 타임프레임에서 통화와 금의 강세를
Smart Structure Concepts MT5
Cristhian Alexander Gaibor Cuasquer
5 (1)
이것은 영역을 그리고 당신이 추측하게 만드는 또 다른 구조 지표가 아닙니다. Smart Structure Concepts는 당신을 위해 시장을 읽습니다 — XAUUSD(금), 외환, 지수, 암호화폐 및 기타 모든 시장 에서 Smart Money Concepts (SMC / ICT) 구조를 실시간으로 표시합니다. 각 영역을 설정하기 위해 입력값에 들어갈 필요 없습니다: 차트의 인터랙티브 대시보드 패널 로, 단 한 번의 클릭으로 표시, 숨기기 또는 조정을 결정할 수 있습니다 — 속성을 열거나 지표를 다시 시작할 필요 없이. 이 도구는 MetaTrader 5용 성장하는 지표 및 패널 세트의 일부입니다 — 모두 11개 언어의 교육 툴팁과 모든 차트에 내장된 시각적 멘토를 갖추고 있습니다. 각 도구는 당신이 거래하는 동안 가르칩니다: 어떤 영역, 신호 또는 레벨에 마우스를 올리면 설명이 차트에 직접 나타납니다. 블랙박스 없음, 맹목적인 주문 없음. 거래하면서 배웁니다. 전체 라인업을 여기서
Meridian Pro
Ottaviano De Cicco
5 (2)
Meridian Pro 2.00: Professional Multi-Timeframe Trend Matrix for MT5 Meridian Pro 2.00 is a professional adaptive trend matrix for MetaTrader 5. It combines the original Meridian trend engine, a clean chart ribbon, closed-bar signal arrows, an 8-timeframe dashboard, Fuel momentum, weighted consensus, synthetic HTF processing and chart-native higher-timeframe context lines. The goal is simple: read current trend, multi-timeframe structure, strength, momentum and EA-ready state from one discipline
FX Levels MT5
Daniel Stein
5 (14)
FX Levels: 모든 시장을 위한 뛰어난 정확도의 지지와 저항 간단 요약 통화쌍, 지수, 주식, 원자재 등 어떤 시장이든 믿을 만한 지지·저항 레벨을 찾고 싶나요? FX Levels 는 전통적인 “Lighthouse” 기법과 첨단 동적 접근을 결합해, 거의 보편적인 정확성을 제공합니다. 실제 브로커 경험을 반영하고, 자동화된 일별 업데이트와 실시간 업데이트를 결합함으로써 FX Levels 는 가격 반전 포인트를 파악하고, 수익 목표를 설정하며, 자신 있게 트레이드를 관리할 수 있게 돕습니다. 지금 바로 시도해 보세요—정교한 지지/저항 분석이 어떻게 여러분의 트레이딩을 한 단계 끌어올릴 수 있는지 직접 확인하세요! 1. FX Levels가 트레이더에게 매우 유용한 이유 뛰어난 정확도의 지지·저항 존 • FX Levels 는 다양한 브로커 환경에서도 거의 동일한 존을 생성하도록 설계되어, 데이터 피드나 시간 설정 차이로 인한 불일치를 해소합니다. • 즉, 어떤 브로커를 사용하
M1 Quantum MT5
Hamed Dehgani
M1 Quantum 은 M1 전용 전문 트레이딩 시스템으로, 손절(Stop Loss), 익절(Take Profit), 그리고 스마트 자금 관리 기능이 내장된 빠르고 정확한 거래 신호를 제공합니다. M1 Quantum 은 연속 수익 거래 에 집중하여 계좌를 빠르게 성장시키도록 설계된 전문 자금 관리 시스템을 포함하고 있습니다. M1 Quantum 인디케이터 의 주요 기능 M1 타임프레임 및 모든 주요 통화쌍 용으로 설계됨 모든 거래에 손절과 익절 적용 자금 관리 시스템 이 포함되어 트레이더가 쉽게 거래할 수 있도록 안내 높은 승률 및 높은 연속 수익률 리페인트 없음, 지연 없음 모든 트레이더가 쉽게 이해 가능 M1 Quantum 을 사용하려면 M1 Quantum Assistant 가 필요합니다. 이 강력한 도구는 모든 M1 Quantum 구매자에게 무료로 제공됩니다 . M1 Quantum Assistant 다운로드 최신 업데이트와 새로운 제품 출시 소식을 받으려면 제 MQL5 채널 에
Crystal Heikin Ashi Signals
Muhammad Jawad Shabir
5 (2)
Crystal Heikin Ashi Signals - Professional Trend & Signal Detection Indicator Advanced Heikin Ashi Visualization with Intelligent Signal System for Manual & Automated Trading Final Price: $149 ---------> Price goes up $10 after every 10 sales . Limited slots available — act fast . Overview Crystal Heikin Ashi Signals is a professional-grade MetaTrader 5 indicator that combines pure Heikin Ashi candle visualization with an advanced momentum-shift detection system. Designed for both manual traders
Market Structure Order Block Dashboard MT5는 시장 구조와 주요 가격 반응 구역을 차트에서 직접 읽고자 하는 트레이더를 위해 설계된 MT5 지표입니다. BOS, ChoCH, 오더 블록, Fair Value Gap (FVG), 유동성, Kill Zones, Volume Profile 그리고 빠른 분석을 위한 콤팩트한 대시보드를 결합합니다. 이 지표는 시장 구조, ICT 및 Smart Money 개념을 의사결정 프레임워크로 사용하는 트레이더를 대상으로 합니다. 추세 지속, 가능한 반전, 가격 불균형, 유동성 타겟 및 관심 구역을 보다 체계적으로 식별하는 데 도움을 줄 수 있습니다. 구매자를 위한 포함 리소스 구매 후 MQL5 개인 메시지로 요청하시면 완전한 PDF 사용 설명서와 파라미터 설정 팁을 제공해 드립니다. MQL5 개인 메시지를 통한 직접 기술 지원. 1.20 버전은 두 가지 주요 추가 기능을 제공합니다: Pending BOS / Pending
필터:
리뷰 없음
리뷰 답변