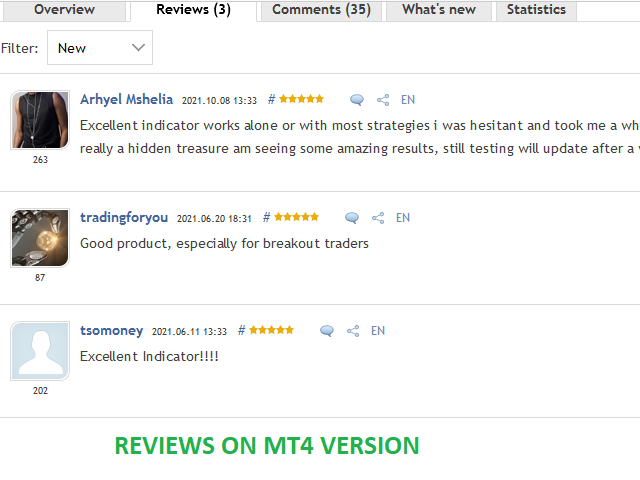
One to Three Trendline Breakout MT5


This indicator scans the 1-3 Trendline pattern . The indicator is a 100 % non repaint low risk breakout system. The patterns are formed around swing high and swing lows which make them a low risk pattern with high reward.
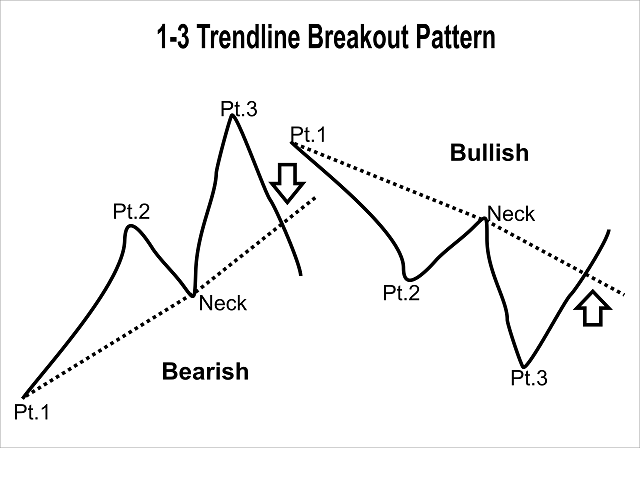
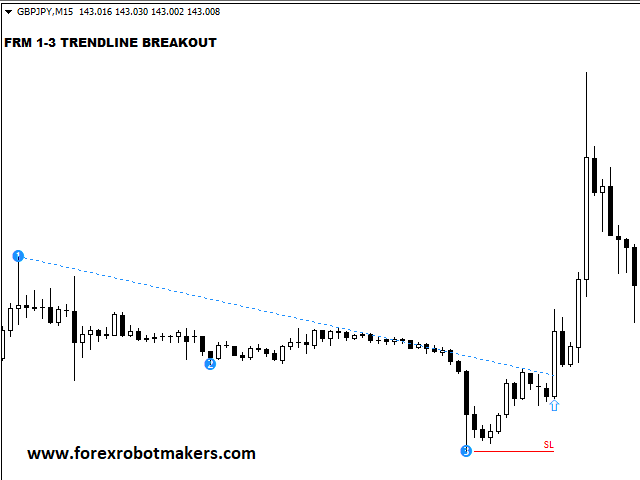
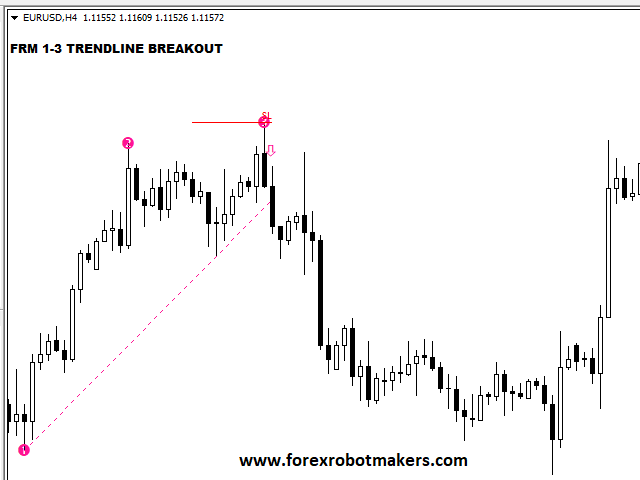
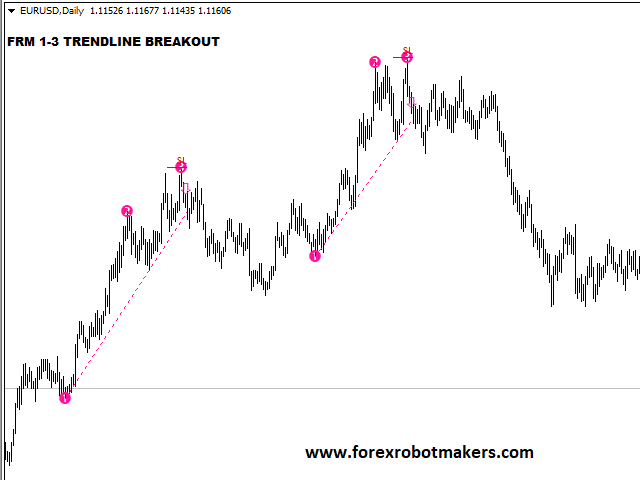
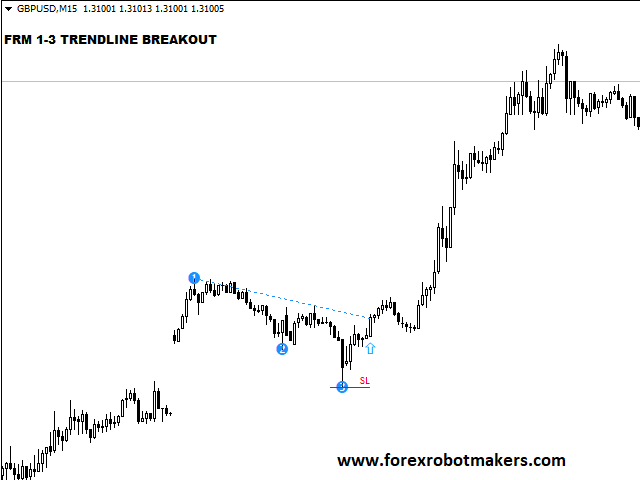
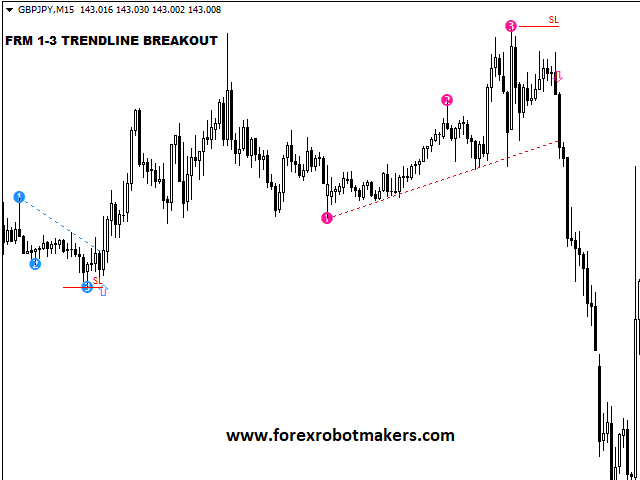
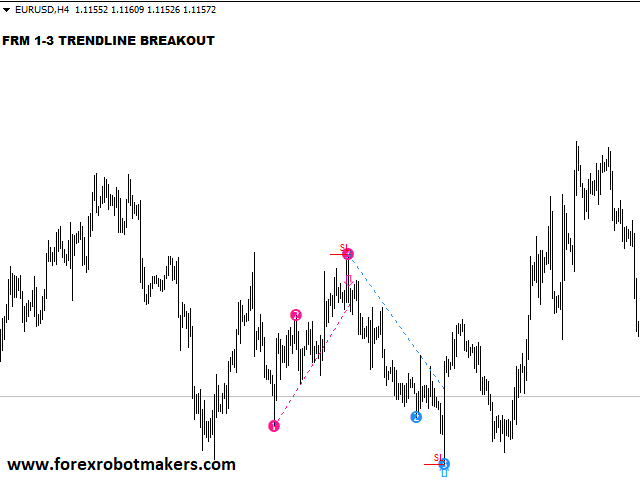
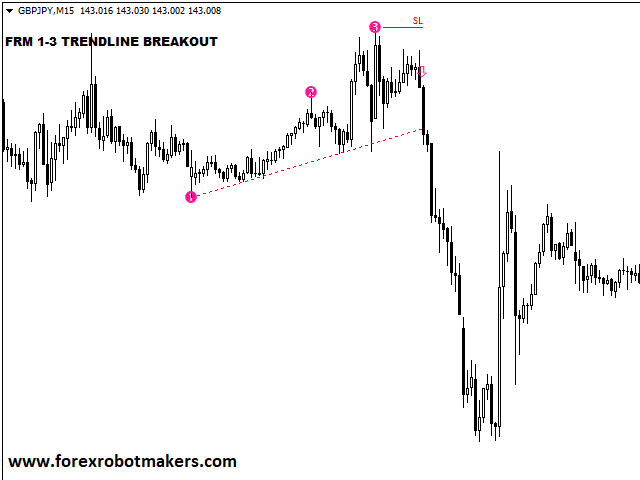

PATTERN BACKGROUND

The 1-3 Trendline Breakout pattern is formed by four(4) points which are composed of three (3) primary points and the pattern neck. A trendline is always formed by the point 1 and the neck of the pattern . When price breaks out of the trendline formed , it usually indicates a shift in supply and demand and thus a possible new trend. The 1-3 Trendline Pattern occurs in every market and it is formed by supply and demand. This means the pattern is not limited to forex market only but can also be used to trade commodities are stocks. 


HOW TO USE

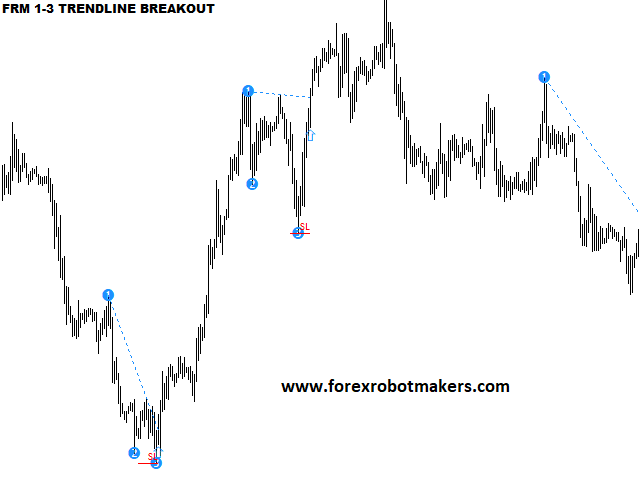
1. Spot the pattern when the signal comes up 

2. Make sure the trendline has not been broken before .When this happens in most cases it is usually a false pattern but there are also some successful pattern formed this way. Our advise is if you are going to risk taking this type of pattern , make sure the stop loss/risk level is very small.

3. Trade the signal

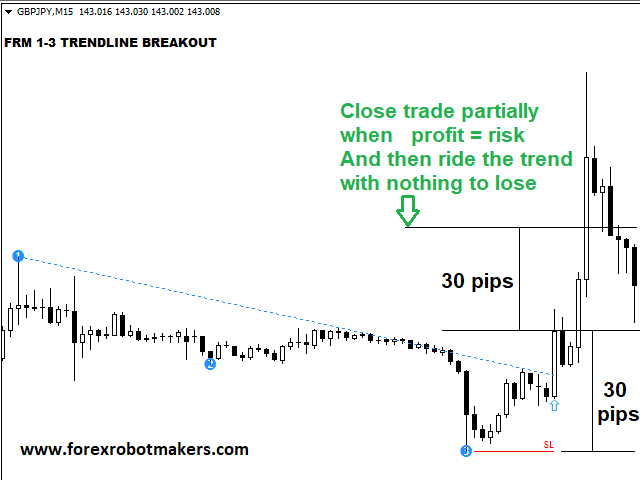
4. Close partial profit at a 1:1 risk to reward ratio. This means when price reaches a profit equals to the risk, close out part of the trade and ride out the rest profits.


INPUTs

1. Pattern Period : The pattern are created using zigzag. The pattern period is the zigzag period.

2. Bullish Pattern : Bullish pattern color

3. Bearish Pattern : Bearish Pattern color

4. PopUp Alert : True/false

5. Phone Notification : True/false

6. Email Notification : True/false


FINAL NOTE

Forex is market driven by sentiment and sentiments can change in seconds thus no forex strategy is a 100% profitable . Always trade with discretion , take calculated risks and don't stake what you are not ready to lose . Stay safe and stay green on the pips.


YOU CAN NOW DOWNLOAD FREE VERSIONS OF OUR PAID INDICATORS . IT'S OUR WAY OF GIVING BACK TO THE COMMUNITY !

>>>  GO HERE TO DOWNLOAD


추천 제품
This trading indicator is non-repainting, non-redrawing, and non-lagging, making it an ideal choice for both manual and automated trading. It is a Price Action–based system that leverages price strength and momentum to give traders a real edge in the market. With advanced filtering techniques to eliminate noise and false signals, it enhances trading accuracy and potential. By combining multiple layers of sophisticated algorithms, the indicator scans the chart in real-time and translates comple
With this easy to set up indicator you can display and set alerts for the following candlestick formations: Bull Breakout, Bear Breakout, Hammer, Pin, Bullish Engulfing, Bearish Engulfing. Input parameters: ShortArrowColor: The color of the Arrows, displaying a Bearish candle formation LongArrowColor: The color of the Arrows displaying a Bullish candle formation BullishEngulfing: Disabled/Enabled/EnabledwithAlert BearishEngulfing: Disabled/Enabled/EnabledwithAlert Pin:  Disabled/Enabled/Enabledw
FREE
Unlock the Market's Hidden Blueprint with Advanced Pattern Recognizer Tired of staring at charts, struggling to spot high-probability trading opportunities? What if you had a professional analyst scanning the markets 24/7, drawing perfect trendlines, and calculating precise profit targets for you? Introducing Advanced Pattern Recognizer for MetaTrader 5 – Your Automated Technical Analysis Powerhouse. This isn't just another indicator. It's a sophisticated algorithmic engine designed to do the he
The Optimized MACD Divergence indicator is a powerful tool designed to identify potential trading opportunities by detecting divergences between price action and the MACD indicator. It combines classic divergence analysis with candlestick pattern recognition and volume filtering to provide more accurate and reliable signals. How it Works The indicator operates on the following principles: MACD Calculation:   It calculates the MACD indicator using user-defined parameters for fast EMA, slow EMA,
ATrend
Zaha Feiz
4.82 (17)
ATREND: 작동 방식 및 사용 방법 ### 작동 방식 MT5 플랫폼을 위한 "ATREND" 지표는 기술 분석 방법론의 조합을 활용하여 트레이더에게 강력한 매수 및 매도 신호를 제공하도록 설계되었습니다. 이 지표는 주로 변동성 측정을 위해 평균 진폭 범위(ATR)를 활용하며, 잠재적인 시장 움직임을 식별하기 위한 트렌드 탐지 알고리즘과 함께 사용됩니다. 구매 후 메시지를 남기면 특별 보너스 선물을 받게 됩니다. ### 주요 특징: - 동적 트렌드 탐지: 이 지표는 시장 트렌드를 평가하고 신호를 조정하여 트레이더가 현재 시장 상황에 맞춰 전략을 조정할 수 있도록 돕습니다. - 변동성 측정: ATR을 사용하여 시장의 변동성을 측정하며, 이는 최적의 손절매(SL) 및 이익 실현(TP) 수준을 결정하는 데 중요합니다. - 신호 시각화: 이 지표는 차트에 매수 및 매도 신호를 시각적으로 표시하여 트레이더의 의사 결정을 향상시킵니다. ### 운영 단계 #### 입력 및 설정 - TimeFr
MercariaPattern1-2-3 відстежує рух ціни, знаходить трьоххвильові структури 1-2-3 та підсвічує момент, коли сценарій підтверджується пробоєм ключового рівня. MercariaPattern1-2-3 tracks price movement, detects three-leg 1-2-3 structures and highlights the moment when the scenario is confirmed by a key level breakout. Індикатор збирає локальні свінги в компактну фігуру 0–1–2–3 , чекає підтвердженого пробою та будує стрілку входу з готовими рівнями SL/TP. The indicator combines local swings into a
KasTon Trend System: The Complete 2-in-1 Trading Strategy Identify the Trend, Confirm the Signal, and Trade with Confidence! Do you suffer from confusion while trading? Do you find it difficult to determine the market's direction? Are you tired of losing money on false signals? The KasTon Trend System is here as an integrated solution to all these problems. This is not just an indicator; it is a complete trading strategy built on the synergy of two powerful, custom-built indicators. Our main g
Owl Smart Levels MT5
Sergey Ermolov
4.03 (32)
MT4 버전  |  FAQ Owl Smart Levels Indicator 는 Bill Williams 의 고급 프랙탈, 시장의 올바른 파동 구조를 구축하는 Valable ZigZag, 정확한 진입 수준을 표시하는 피보나치 수준과 같은 인기 있는 시장 분석 도구를 포함하는 하나의 지표 내에서 완전한 거래 시스템입니다. 시장과 이익을 취하는 장소로. 전략에 대한 자세한 설명 표시기 작업에 대한 지침 고문-거래 올빼미 도우미의 조수 개인 사용자 채팅 ->구입 후 나에게 쓰기,나는 개인 채팅에 당신을 추가하고 거기에 모든 보너스를 다운로드 할 수 있습니다 힘은 단순함에 있습니다! Owl Smart Levels 거래 시스템은 사용하기 매우 쉽기 때문에 전문가와 이제 막 시장을 연구하고 스스로 거래 전략을 선택하기 시작한 사람들 모두에게 적합합니다. 전략 및 지표에는 눈에 보이지 않는 비밀 공식 및 계산 방법이 없으며 모든 전략 지표는 공개되어 있습니다. Owl Smart Levels를 사
Oscillator trading signals - это динамический индикатор, определяющий состояние к продолжению тенденции роста или падению цены торгового инструмента и отсечению зон с нежелательной торговлей. Индикатор состоит из 2 линий осцилляторов. Медленная и быстрая сигнальная линия.  Шкала отображения перевернутая. Зоны вблизи 0 свидетельствуют о тенденции роста цены валютной пары. Зоны -100 свидетельствуют о падении цены валютной пары. На основном графике в виде стрелок отображается потенциально выгодные
Candle Pattern Pro MT5
Komang Putra Riswanjaya
Description : In the world of trading, candlestick patterns are a popular technical analysis tool used by many traders.   There are numerous candlestick patterns, ranging from reversal patterns to continuation patterns. However, remembering all these patterns can be challenging, especially for novice traders. This often leads to traders having to manually memorize and identify candlestick patterns, which can be time-consuming and prone to errors. Candle Pattern Pro is a powerful indicator desig
MarketMagnet
Kelly Adediran Raymond
Are you ready to take your trading journey to new heights? Look no further than MarketMagnet, this groundbreaking indicator designed to propel your trading success with excitement and accuracy. Powered by the convergence of Momentum and CCI (Commodity Channel Index), MarketMagnet equips traders with the ultimate tool to determine direction and entry prices for a wide range of recommended currency pairs and instruments. It is designed for traders seeking to scalp for a few pips on lower timeframe
Receive notifications for multi-trendline or single trendline breakout. Yes! You heard us right!  You will be notified the moment price crosses any and all the timeframe trendlines that you have chosen.  1.    ADDING MULTIPLE OR SINGLE TRENDLINES IN THE SAME DIRECTION To trigger a stronger trading opportunity you can require that price breaks one or more trend lines of different timeframes in the same direction. To do this navigate to the timeframe for which you want to add a trendline and click
Renko System
Marco Montemari
This indicator can be considered as a trading system. It offers a different view to see the currency pair: full timeless indicator, can be used for manual trading or for automatized trading with some expert advisor. When the price reaches a threshold a new block is created according to the set mode. The indicator beside the Renko bars, shows also 3 moving averages. Features renko mode median renko custom median renko 3 moving averages wicks datetime indicator for each block custom notification
SMC OrderBlocks AIO MT5
Catur Cipto Nugroho
Order Blocks All-in-One — SMC Indicator for MT5 For MT4 version :  https://www.mql5.com/en/market/product/166056 The only Order Block indicator you'll ever need. Track the complete lifecycle of every Order Block — from formation to mitigation to breakout — all in one single, powerful indicator. Built on Smart Money Concepts (SMC) originally introduced by the ICT community , this tool brings institutional-level market structure analysis dire
Golden Swings
Arnold Byarufu
"GoldenSwing" is a comprehensive MetaTrader 5 indicator meticulously crafted by Southern Star Trading, designed to enhance your trading strategies with precision swing high and swing low identification. Harnessing the power of swing analysis, this indicator provides traders with invaluable insights into market reversals and trend continuations, enabling them to make informed trading decisions. With its advanced algorithm, GoldenSwing detects significant swing highs and swing lows in real-time,
Limitless MT5
Dmitriy Kashevich
Limitless MT5 is a universal indicator suitable for every beginner and experienced trader. works on all currency pairs, cryptocurrencies, raw stocks Limitless MT5 - already configured and does not require additional configuration And now the main thing Why Limitless MT5? 1 complete lack of redrawing 2 two years of testing by the best specialists in trading 3 the accuracy of correct signals exceeds 80% 4 performed well in trading during news releases Trading rules 1 buy signal - the ap
Hunter trend
Yaroslav Varankin
Hunter Trend: Arrow Indicator for Binary Options Trading Hunter Trend is an arrow indicator designed for trading binary options (turbo options) on the M1 timeframe, allowing for short-term trading opportunities. How to Trade with this Tool: Signals may appear when a candlestick forms. Once such a signal appears, wait for the closure of that candlestick. Upon the opening of a new candlestick, open a trade for 1-2 candlesticks in the indicated direction. In this case, for 1-2 minutes. A blue dot
PREngulfing
Slobodan Manovski
PR EA - Engulfing Pattern Trading System Automated Engulfing Pattern Detection with MA Confirmation The PR EA is a Meta Trader 5 expert advisor that identifies and trades bullish/bearish engulfing candlestick patterns when confirmed by a moving average filter. Designed for swing trading on 30-minute charts with compatibility for M15 and H1 time frames. Key Features: Pattern Recognition - Detects valid bullish/bearish engulfing candle formations Trend Confirmation - 238-period SMA filter
PipFinite Breakout EDGE MT5
Karlo Wilson Vendiola
4.81 (93)
The Missing Edge You Need To Catch Breakouts Like A Pro. Follow a step-by-step system that detects the most powerful breakouts! Discover market patterns that generate massive rewards based on a proven and tested strategy. Unlock Your Serious Edge Important information here www.mql5.com/en/blogs/post/723208 The Reliable Expert Advisor Version Automate Breakout EDGE signals using "EA Breakout EDGE" Click Here Have access to the game changing strategy that will take your trading to the next l
RSI 다이버전스 스위트 프로 - 메타트레이더 5 고급 지표 개요 RSI 다이버전스 스위트 프로는 가격과 RSI 간의 다이버전스를 자동으로 감지하여 고정밀 거래 신호를 제공하는 메타트레이더 5용 고급 기술 지표입니다. 이 전문 지표는 RSI의 강력한 기능과 다이버전스 분석, 다중 시간대 지지/저항 및 완벽한 경고 시스템을 결합합니다. 주요 기능 고급 다이버전스 감지 4가지 유형의 다이버전스: 일반 상승 다이버전스: 가격은 저점을 낮추지만 RSI는 저점을 높일 때의 상승 신호 일반 하락 다이버전스: 가격은 고점을 높이지만 RSI는 고점을 낮출 때의 하락 신호 숨겨진 상승 다이버전스: 상승 추세 확인 (지속) 숨겨진 하락 다이버전스: 하락 추세 확인 (지속) 통합된 품질 필터: 최소 거래량 필터 ATR 변동성 필터 RSI 레벨 필터 (과매수/과매도) 캔들 거리 필터 2. 강도 분류 시스템 신호 자동 분류: 강함: 설정 가능한 임계값보다 큰 RSI 차이를 보이는 다이버전스 보통: 최소 기
무료 AUX 지표, EA 지원 및 전체 가이드를 얻으시려면 방문하세요 – https://www.mql5.com/en/blogs/post/763955 트렌드를 포착하세요. 패턴을 읽으세요. 진입 시점을 타이밍하세요. 30초 이내의 3단계! 분석 없이도 쉽게 거래하세요 — 당신의 스마트 어시스턴트가 워크플로우를 단순화해 드립니다. 더 이상 차트 과부하 없음. 스마트 바이어스 감지로 자신감 있게 거래하세요. 모든 통화, 암호화폐, 주식, 금속, 지수 및 모든 시간대와 호환됩니다. 그냥 클릭하고 실행하세요 — 정말 간단합니다. 속도와 명확성을 원하는 바쁜 트레이더에게 이상적입니다. TPTSyncX는 추세, 패턴, 그리고 캔들스틱 트리거 분석을 하나로 통합하여 깨끗하고 지능적인 시각 시스템으로 동기화하는 강력한 올인원 MetaTrader 5 인디케이터입니다. 명확성, 정밀성, 속도를 원하는 트레이더를 위해 설계되었으며, 가격 행동, 구조적 패턴 및 시장 타이밍 도구의 조합을 통해 높은 확
This indicator helps you to identify trends and patterns. It shows the short-term, medium-term and long-term trend at the same time on the screen. It supports every timeframe except monthly. This indicator NOT implement the ZigZag indicator, but it uses its own, fast react algorithm. Supported markets: -         Forex -         Metal -         Energies Spot -         in Energies Futures only o    US Crude Oils -         in Indices Spot only o    US Tech 100 Index o    UK 100 Index o    US Wall
PZ Swing Trading MT5
PZ TRADING SLU
5 (5)
Protect against whipsaws: revolutionize your swing trading approach Swing Trading is the first indicator designed to detect swings in the direction of the trend and possible reversal swings. It uses the baseline swing trading approach, widely described in trading literature. The indicator studies several price and time vectors to track the aggregate trend direction and detects situations in which the market is oversold or overbought and ready to correct. [ Installation Guide | Update Guide | Tro
Strong Candle2
Roberto Tavares
Strong Candle Indicates the size of each candlestick with the text value above it and indicates which candlestick has a body larger than the one specified in the parameters in percentage, that is, a strong candlestick (between Size_Min and Size_Max) with at least x% of body. The candlestick size is placed in the buffer and that is the buy or sell indication, where: value > 0 = bullish candle or value < 0 bearish candle, value = 0 means no indication (the candle did not match the desired pattern
SMC Trend Momentum – Adaptive Trend and Momentum Oscillator SMC Trend Momentum is a momentum oscillator plotted in a separate window. The indicator combines a Donchian position bias with a ZigZag leg normalization and transforms this into a smoothed, color‑coded histogram for assessing trend direction and momentum changes. Optionally, a higher timeframe filter can be applied. The indicator is designed to be flexible for different trading styles (short‑term, swing, indices, FX) using ready‑to‑u
Macd SnR Candle Premium
Syamsurizal Dimjati
MACD Support–Resistance Candle Analyzer — Professional This indicator enhances the classic MACD by combining   momentum analysis   with   dynamic Support & Resistance detection , giving traders a clearer view of breakout strength and market structure. It transforms price action into   color-coded MACD candles , highlights   SnR break levels , and provides clean visual confirmation of trend continuation or reversal. Ideal for scalpers, intraday traders, and swing traders who rely on fast, structu
GEN Swing Signal
Gede Egi Narditya
INDICATOR: GEN SWING SIGNAL Developer: gedeegi General Description GEN SWING SIGNAL is a specialized Price Action indicator designed to automate the detection of high-probability reversal patterns based on Smart Money Concepts (SMC). Unlike traditional oscillators, this system focuses on market structure and liquidity. The indicator specifically looks for Swing Failure Patterns (SFP)—where price sweeps a previous high or low to grab liquidity—and confirms the reversal using a Change in State of
"Hunttern harmonic pattern finder" base on the dynamic zigzag with the notification and prediction mode This version of the indicator identifies 11 harmonic patterns and predicts them in real-time before they are completely formed. It offers the ability to calculate the error rate of Zigzag patterns depending on a risk threshold. It moreover sends out a notification once the pattern is complete. The supported patterns: ABCD BAT ALT BAT BUTTERFLY GARTLEY CRAB DEEP CRAB CYPHER SHARK THREE DRIV
Visual Momentum Wave Sync Indicator
AL MOOSAWI ABDULLAH JAFFER BAQER
Visual Momentum Wave Sync: Master Market Momentum with Unmatched Clarity Unlock the market's rhythm and trade with confidence for just $30! Are you tired of noisy indicators that clutter your charts and provide conflicting signals? Do you struggle to accurately gauge market momentum and identify high-probability entry and exit points? The Visual Momentum Wave Sync indicator is the definitive tool designed to solve these problems, offering a crystal-clear view of market dynamics for traders who
Automated Trendlines MT5
Georgios Kalomoiropoulos
추세선은 외환 거래에서 기술적 분석의 가장 필수적인 도구입니다. 불행히도, 대부분의 거래자는 올바르게 그리지 않습니다. 자동 추세선 표시기는 시장의 추세 움직임을 시각화하는 데 도움이 되는 진지한 거래자를 위한 전문 도구입니다. 추세선 강세 추세선과 약세 추세선에는 두 가지 유형이 있습니다. 상승 추세에서 Forex 추세선은 가격 움직임의 가장 낮은 스윙 포인트를 통해 그려집니다. 최소 두 개의 "최저 저점"을 연결하면 추세선이 생성됩니다. 하락 추세에서 추세선은 가격 움직임의 가장 높은 스윙 포인트를 통해 그려집니다. 최소 두 개의 "최고 최고점"을 연결하면 추세선이 생성됩니다. 추세선이 깨질 때? 강세 추세선은 약세 양초가 강세 추세선 아래에서 닫히고 양초의 고점이 추세선 위에 있을 때 깨집니다. 약세 추세선은 강세 양초가 약세 추세선 위로 마감되고 양초 저점이 추세선 아래에 있을 때 깨집니다. 추세선이 삭제되면? 강세 추세선은 전체 양초가 강세 추세선 아래에
이 제품의 구매자들이 또한 구매함
ARICoins
Temirlan Kdyrkhan
ARICoin is a powerful trading companion designed to generate high-probability entry signals with dynamic TP/SL/DP levels based on volatility. Built-in performance tracking shows win/loss stats, PP1/PP2 hits, and success rates all updated live. Key Features: Buy/Sell signals with adaptive volatility bands Real-time TP/SL/DP levels based on ATR Built-in MA Filter with optional ATR/StdDev volatility Performance stats panel (Success, Profit/Loss, PP1/PP2) Alerts via popup, sound, push, or email Cust
AriX
Temirlan Kdyrkhan
1 (4)
AriX Indicator for MT5 A powerful trend-following and signal-evaluation tool AriX is a custom MT5 indicator that combines Moving Averages and ATR-based risk/reward logic to generate clear buy/sell signals. It visualizes dynamic SL/TP levels, evaluates past trade outcomes, and displays win/loss statistics in a clean on-chart panel. Key features include: Buy/Sell signals based on MA crossovers ATR-based SL/TP1/TP2/TP3 levels with visual lines and labels Signal outcome tracking with real-time stat
이 지표를 구매하면 제 프로페셔널 트레이드 매니저를 무료로 드립니다. 우선 이 거래 시스템이 리페인팅, 리드로잉 및 레이그 인디케이터가 아니라는 점을 강조하는 것이 중요합니다. 이는 수동 및 로봇 거래 모두에 이상적인 것으로 만듭니다. 온라인 강좌, 설명서 및 프리셋 다운로드. "스마트 트렌드 트레이딩 시스템 MT5"은 새로운 및 경험이 풍부한 트레이더를 위해 맞춤형으로 제작된 종합적인 거래 솔루션입니다. 10개 이상의 프리미엄 인디케이터를 결합하고 7개 이상의 견고한 거래 전략을 특징으로 하여 다양한 시장 조건에 대한 다목적 선택이 가능합니다. 트렌드 추종 전략: 효과적인 트렌드 추이를 타기 위한 정확한 진입 및 손절 관리를 제공합니다. 반전 전략: 잠재적인 트렌드 반전을 식별하여 트레이더가 범위 시장을 활용할 수 있게 합니다. 스캘핑 전략: 빠르고 정확한 데이 트레이딩 및 단기 거래를 위해 설계되었습니다. 안정성: 모든 인디케이터가 리페인팅, 리드로잉 및 레이그가 아니므로 신뢰
Divergence Bomber
Ihor Otkydach
4.89 (83)
이 지표를 구매하신 분께는 다음과 같은 혜택이 무료로 제공됩니다: 각 거래를 자동으로 관리하고, 손절/익절 수준을 설정하며, 전략 규칙에 따라 거래를 종료하는 전용 도우미 툴 "Bomber Utility" 다양한 자산에 맞게 지표를 설정할 수 있는 셋업 파일(Set Files) "최소 위험", "균형 잡힌 위험", "관망 전략" 모드로 설정 가능한 Bomber Utility의 셋업 파일 이 전략을 빠르게 설치, 설정, 시작할 수 있도록 돕는 단계별 영상 매뉴얼 주의: 위의 모든 보너스를 받기 위해서는 MQL5 개인 메시지 시스템을 통해 판매자에게 연락해 주세요. 독창적인 커스텀 지표인 “Divergence Bomber(다이버전스 봄버)”를 소개합니다. 이 지표는 MACD 다이버전스(괴리) 전략을 기반으로 한 올인원(All-in-One) 거래 시스템입니다. 이 기술 지표의 주요 목적은 가격과 MACD 지표 간의 다이버전스를 감지하고, **향후 가격이 어느 방향으로 움직일지를 알려주는
Market Flow Pro
Gabriele Sabatino
4 (1)
Market Flow Pro Market Flow Pro is an intelligent trading advisor for the MetaTrader 5 platform, designed for automatic trading on financial markets using algorithmic analysis and strict risk management. -Key features: - Fully automatic trading 24/5 - Adaptive trend and momentum entry algorithm -  Built-in risk management - Flexible lot settings (fixed/auto-calculation) - Support for major currency pairs and indices - Optimised for operation on various timeframes  How it works Market
Grabber System MT5
Ihor Otkydach
4.82 (22)
탁월한 기술적 지표인 Grabber를 소개합니다. 이 도구는 즉시 사용 가능한 “올인원(All-Inclusive)” 트레이딩 전략으로 작동합니다. 하나의 코드 안에 강력한 시장 기술 분석 도구, 매매 신호(화살표), 알림 기능, 푸시 알림이 통합되어 있습니다. 이 인디케이터를 구매하신 모든 분들께는 다음의 항목이 무료로 제공됩니다: Grabber 유틸리티: 오픈 포지션을 자동으로 관리하는 도구 단계별 영상 매뉴얼: 설치, 설정, 그리고 실제 거래 방법을 안내 맞춤형 세트 파일: 인디케이터를 빠르게 자동 설정하여 최고의 성과를 낼 수 있도록 도와줍니다 다른 전략은 이제 잊어버리세요! Grabber만이 여러분을 새로운 트레이딩의 정점으로 이끌어 줄 수 있습니다. Grabber 전략의 주요 특징: 거래 시간 프레임: M5부터 H4까지 거래 가능한 자산: 어떤 자산이든 사용 가능하지만, 제가 직접 테스트한 종목들을 추천드립니다 (GBPUSD, GBPCAD, GBPCHF, AUDCAD, AU
Quantum TrendPulse
Bogdan Ion Puscasu
5 (22)
SuperTrend   ,   RSI   ,   Stochastic   의 힘을 하나의 포괄적인 지표로 결합하여 트레이딩 잠재력을 극대화하는 궁극의 트레이딩 도구   인 Quantum TrendPulse를   소개합니다. 정밀성과 효율성을 추구하는 트레이더를 위해 설계된 이 지표는 시장 추세, 모멘텀 변화, 최적의 진입 및 종료 지점을 자신 있게 식별하는 데 도움이 됩니다. 주요 특징: SuperTrend 통합:   주요 시장 추세를 쉽게 따라가고 수익성의 물결을 타세요. RSI 정밀도:   매수 과다 및 매도 과다 수준을 감지하여 시장 반전 시점을 파악하는 데 적합하며 SuperTrend 필터로 사용 가능 확률적 정확도:   변동성이 큰 시장에서 숨겨진 기회를 찾기 위해 확률적 진동   을 활용하고 SuperTrend의 필터로 사용 다중 시간대 분석:   M5부터 H1 또는 H4까지 다양한 시간대에 걸쳐 시장을 최신 상태로 유지하세요. 맞춤형 알림:   맞춤형 거래 조건이 충족되면
RFI levels PRO MT5
Roman Podpora
3.67 (3)
이 지표는 추세 반전 지점과 가격 반등 영역을 정확하게 보여줍니다.       주요 투자자들   . 새로운 트렌드가 형성되는 곳을 파악하고 최대한 정확하게 의사결정을 내리며 모든 거래를 완벽하게 통제합니다. TREND LINES PRO   지표와 함께 사용할 때 최대의 잠재력을 발휘합니다.  VERSION MT4 지표가 보여주는 내용: 새로운 추세의 시작 시 활성화되는 반전 구조 및 반전 수준. 최소한의 위험 대비 수익률을 갖는 이익 실현   (TAKE PROFIT)   및   손절매(STOP LOSS)   레벨 표시       RR 1:2   . 지능형 손실 감소 로직이 적용된 손절매 기능. 지정된 지표에서 두 가지 추세 유형에 대한 반전 패턴을 표시합니다. 지표: 트렌드를 따라   트렌드 라인 프로   (글로벌 트렌드 변화) 트렌드 프로   (빠른 트렌드 변화) 간단하고 효과적입니다       스캐너       실시간 추세 (신규). 다중 시간 프레임 도구 필터링. 표시하다  
Atomic Analyst MT5
Issam Kassas
4.1 (29)
우선적으로 언급할 점은이 거래 지표가 다시 그리지 않고 지연되지 않으며 이를 통해 수동 및 로봇 거래 모두에 이상적이라는 점입니다. 사용자 매뉴얼: 설정, 입력 및 전략. Atomic Analyst는 가격의 강도와 모멘텀을 활용하여 시장에서 더 나은 이점을 찾는 PA Price Action Indicator입니다. 고급 필터를 장착하여 잡음과 거짓 신호를 제거하고 거래 잠재력을 높이는 데 도움이 됩니다. 복잡한 지표의 다중 레이어를 사용하여 Atomic Analyst는 차트를 스캔하고 복잡한 수학적 계산을 간단한 신호와 색상으로 변환하여 초보 트레이더가 이해하고 일관된 거래 결정을 내릴 수 있도록합니다. "Atomic Analyst"는 새로운 및 경험이 풍부한 트레이더를위한 종합적인 거래 솔루션입니다. 프리미엄 지표와 최고 수준의 기능을 하나의 거래 전략에 결합하여 모든 종류의 트레이더에 대한 다재다능한 선택지가되었습니다. 인트라데이 거래 및 스캘핑 전략 : 빠르고 정확한 일일
Azimuth Pro
Ottaviano De Cicco
5 (4)
LAUNCH PROMO Azimuth Pro price is initially set at 299$ for the first 100 buyers. Final price will be 499$ . THE DIFFERENCE BETWEEN RETAIL AND INSTITUTIONAL ENTRIES ISN'T THE INDICATOR — IT'S THE LOCATION. Most traders enter at arbitrary price levels, chasing momentum or reacting to lagging signals. Institutions wait for price to reach structured levels where supply and demand actually shift. Azimuth Pro maps these levels automatically: swing-anchored VWAP, multi-timeframe structure lines, an
Entry Points Pro for MT5
Yury Orlov
4.48 (138)
다시 색을 칠하지 않고 거래에 진입할 수 있는 정확한 신호를 제공하는 MT5용 지표입니다. 외환, 암호화폐, 금속, 주식, 지수 등 모든 금융 자산에 적용할 수 있습니다. 매우 정확한 추정값을 제공하고 매수와 매도의 가장 좋은 시점을 알려줍니다. 하나의 시그널로 수익을 내는 지표의 예와 함께 비디오 (6:22)시청하십시오! 대부분의 거래자는 Entry Points Pro 지표의 도움으로 첫 거래 주 동안 트레이딩 결과를 개선합니다. 저희의   Telegram Group 을 구독하세요! Entry Points Pro 지표의 좋은점. 재도색이 없는 진입 신호 신호가 나타나고 확인되면(시그널 캔들이 완성된 경우) 신호는 더 이상 사라지지 않습니다. 여타 보조지표의 경우 신호를 표시한 다음 제거되기 때문에 큰 재정적 손실로 이어집니다. 오류 없는 거래 게시 알고리즘을 통해 트레이드(진입 또는 청산)를 할 이상적인 순간을 찾을 수 있으며, 이를 통해 이를 사용하는 모든 거래자의 성공률이
Trend Lines PRO MT5
Roman Podpora
5 (1)
트렌드 라인즈 프로       이 지표는 시장이 실제로 어떤 방향으로 전환되는지 파악하는 데 도움이 됩니다. 실제 추세 반전 지점과 주요 시장 참여자들이 다시 진입하는 지점을 보여줍니다. 보시다시피       BOS 라인       복잡한 설정이나 불필요한 노이즈 없이 더 높은 시간대의 추세 변화와 주요 레벨을 확인할 수 있습니다. 신호는 차트에 다시 그려지지 않고 캔들이 마감된 후에도 계속 표시됩니다. MT4 버전   -   RFI LEVELS PRO   표시기   와 결합 시 최대 잠재력을 발휘합니다. 지표가 보여주는 내용: 실제 변화       추세(BOS 라인) 한 번 신호가 나타나면 그 신호는 계속 유효합니다! 이는 신호를 발생시킨 후 변경될 수 있는 리페인팅 방식의 지표와 중요한 차이점입니다. 리페인팅 방식의 지표는 잠재적으로 자금 손실로 이어질 수 있습니다. 이제 더욱 높은 확률과 정확도로 시장에 진입할 수 있습니다. 또한 화살표가 나타난 후 목표가(익절)에 도달하거나
RelicusRoad Pro MT5
Relicus LLC
5 (24)
RelicusRoad Pro: 퀀트 시장 운영 체제 70% 할인 평생 이용권 (한정 시간) - 2,000명 이상의 트레이더와 함께하세요 왜 대부분의 트레이더는 "완벽한" 지표를 가지고도 실패할까요? 진공 상태에서 단일 개념 만으로 거래하기 때문입니다. 문맥 없는 신호는 도박입니다. 지속적인 승리를 위해서는 컨플루언스(중첩) 가 필요합니다. RelicusRoad Pro는 단순한 화살표 지표가 아닙니다. 완전한 퀀트 시장 생태계 입니다. 독점적인 변동성 모델링을 사용하여 가격이 이동하는 "공정 가치 로드"를 매핑하고, 단순 노이즈와 실제 구조적 돌파를 구분합니다. 추측은 그만두세요. 기관급 로드 로직으로 거래를 시작하세요. 핵심 엔진: "Road" 알고리즘 시스템의 중심에는 시장 상황에 실시간으로 적응하는 동적 변동성 채널인 Road Algo 가 있습니다. 세이프 라인(평형) 과 가격이 수학적으로 반전될 가능성이 높은 확장 레벨 을 투영합니다. Simple Road: 일반적인 시장을 위
Candle Smart Range
Gianny Alexander Lugo Sanchez
MetaTrader 5용 Candle Smart Range (CSR) Candle Smart Range는 여러 타임프레임에서 가격 범위를 자동으로 식별하도록 설계된 기술 지표입니다. 이 도구는 캔들 형성 및 이전 고점/저점과의 상호작용을 바탕으로 시장 구조를 분석합니다. 주요 기능: 범위 감지: 급격한 변동 전의 횡보 구간을 자동으로 식별합니다. 거짓 돌파 식별: 가격이 이전 수준을 넘어섰으나 캔들 종가 기준으로 범위 내에서 마감된 경우를 표시합니다. 멀티 타임프레임 분석: 사용자 정의 주기를 포함하여 최대 19개의 타임프레임 데이터를 한 차트에 표시합니다. 내부 시각화 (줌): 차트 변경 없이 상위 타임프레임 캔들 내부의 가격 움직임을 확인할 수 있습니다. 시간 필터: 주요 시장 세션 등 특정 시간대에만 작동하도록 설정 가능합니다. 과거 데이터 복기 모드: 과거 데이터를 단계별로 탐색하며 지표의 작동을 분석할 수 있습니다. 알림 시스템: 캔들 마감 및 새로운 범위 감지에 대한 사용
ARIPoint
Temirlan Kdyrkhan
ARIPoint is a powerful trading companion designed to generate high-probability entry signals with dynamic TP/SL/DP levels based on volatility. Built-in performance tracking shows win/loss stats, PP1/PP2 hits, and success rates all updated live. Key Features: Buy/Sell signals with adaptive volatility bands Real-time TP/SL/DP levels based on ATR Built-in MA Filter with optional ATR/StdDev volatility Performance stats panel (Success, Profit/Loss, PP1/PP2) Alerts via popup, sound, push, or email Cu
소개       Quantum Breakout PRO   , 브레이크아웃 존 거래 방식을 변화시키는 획기적인 MQL5 지표! 13년 이상의 거래 경험을 가진 숙련된 트레이더 팀이 개발한       퀀텀 브레이크아웃 PRO       혁신적이고 역동적인 브레이크아웃 존 전략으로 거래 여정을 새로운 차원으로 끌어올리도록 설계되었습니다. Quantum Breakout Indicator는 5개의 이익 목표 영역이 있는 브레이크아웃 영역의 신호 화살표와 브레이크아웃 상자를 기반으로 한 손절 제안을 제공합니다. 초보자 거래자와 전문 거래자 모두에게 적합합니다. Quantum EA 채널:       여기를 클릭하세요 중요한! 구매 후 설치 매뉴얼을 받으려면 개인 메시지를 보내주십시오. 추천: 기간: M15 통화쌍: GBPJPY, EURJPY, USDJPY,NZDUSD, XAUUSD 계정 유형: 스프레드가 매우 낮은 ECN, Raw 또는 Razor 브로커 시간: GMT +3 중개인 :
Mirage Trading System — False Breakout (Fakey) Pattern Detector for MetaTrader 5 MANUAL   ,   MQL5 Channel Buy any indicator and get a FREE bonus indicator Phantom trading System, SMC retest Trading system, GOLD SCALP System! Send me a private message for details. Overview   Mirage Trading System detects the Fakey pattern (false breakout reversal) on completed bars and draws entry, stop loss, and take profit levels on the chart. Detection is non-repainting: signal values do not change after bar
CGE Trading Suite
Carl Gustav Johan Ekstrom
5 (1)
CGE Trading Suite delivers the analytical edge typically reserved for professional trading desks. The platform integrates a full suite of analytical tools into one seamless workflow: dynamic grid mapping, liquidity behavior analysis, ECM, trend lines, MIDAS, trade cycles, and directional channel projections. Together, these provide a unified view of market structure and momentum. Directional clarity is further enhanced by the capital flow index, which measures currency basket strength to identif
Trend Forecaster
Alexey Minkov
5 (7)
The Trend Forecaster indicator utilizes a unique proprietary algorithm to determine entry points for a breakout trading strategy. The indicator identifies price clusters, analyzes price movement near levels, and provides a signal when the price breaks through a level. The Trend Forecaster indicator is suitable for all financial assets, including currencies (Forex), metals, stocks, indices, and cryptocurrencies. You can also adjust the indicator to work on any time frames, although it is recommen
Bill Williams Advanced
Siarhei Vashchylka
5 (10)
Bill Williams Advanced is designed for automatic chart analysis using Bill Williams' "Profitunity" system. The indicator analyzes four timeframes at once. Manual (Be sure to read before purchasing) Advantages 1. Analyzes the chart using Bill Williams' "Profitunity" system. Signals are displayed in a table in the corner of the screen and on the price chart. 2. Finds all known AO and AC signals, as well as zone signals. Equipped with a trend filter based on the Alligator. 3. Finds "Divergence Bar
" Dynamic Scalper System MT5 " 지표는 추세 파동 내에서 스캘핑 방식으로 거래하도록 설계되었습니다. 주요 통화쌍 및 금에서 테스트되었으며, 다른 거래 상품과의 호환성이 가능합니다. 추가적인 가격 변동 지원을 통해 추세에 따라 단기 포지션 진입 신호를 제공합니다. 지표의 원리 큰 화살표는 추세 방향을 결정합니다. 작은 화살표 형태의 스캘핑 신호를 생성하는 알고리즘은 추세 파동 내에서 작동합니다. 빨간색 화살표는 상승 방향을, 파란색 화살표는 하락 방향을 나타냅니다. 민감한 가격 변동선은 추세 방향으로 그려지며, 작은 화살표의 신호와 함께 작용합니다. 신호는 다음과 같이 작동합니다. 적절한 시점에 선이 나타나면 진입 신호가 형성되고, 선이 있는 동안 미결제 포지션을 유지하며, 완료되면 거래를 종료합니다. 권장되는 작업 시간대는 M1~H4입니다. 화살표는 현재 캔들에 형성되며, 다음 캔들이 이미 시작되었더라도 이전 캔들의 화살표는 다시 그려지지 않습니다. 입
Advanced Currency Strength28 MT5
Bernhard Schweigert
5 (3)
초보자 또는 전문가 트레이더를 위한 최고의 솔루션! 이 지표는 우리가 독점 기능과 새로운 공식을 통합했기 때문에 독특하고 고품질이며 저렴한 거래 도구입니다. 단 하나의 차트로 28 Forex 쌍의 통화 강도를 읽을 수 있습니다! 새로운 추세 또는 스캘핑 기회의 정확한 트리거 포인트를 정확히 찾아낼 수 있기 때문에 거래가 어떻게 개선될지 상상해 보십시오. 사용 설명서: 여기를 클릭  https://www.mql5.com/en/blogs/post/697384 그것이 첫 번째, 원본입니다! 쓸모없는 지망생 클론을 사지 마십시오. 더 스페셜  강력한 통화 모멘텀을 보여주는 하위 창의 화살표 GAP가 거래를 안내합니다! 기본 또는 호가 통화가 과매도/과매도 영역(외부 시장 피보나치 수준)에 있을 때 개별 차트의 기본 창에 경고 표시가 나타납니다. 통화 강도가 외부 범위에서 떨어질 때 풀백/반전 경고. 교차 패턴의 특별 경고 추세를 빠르게 볼 수 있는 다중 시간 프레임 선택이 가능합
Gold Sniper Scalper Pro
Ich Khiem Nguyen
3.78 (9)
Gold Sniper Scalper Pro — False Breakout Detector with Gold-Specific Filters for MetaTrader 5 MANUAL   ,   MQL5 Channel Buy any indicator and get a FREE bonus indicator Phantom trading System, SMC retest Trading system, Mirage Trading  System! Send me a private message for details. Overview   Gold Sniper Scalper Pro detects the Fakey pattern (false breakout reversal) on completed bars and applies three additional validation layers designed for XAUUSD characteristics: a 7-timeframe trend consens
MetaBands M5
Vahidreza Heidar Gholami
4.5 (2)
MetaBands uses powerful and unique algorithms to draw channels and detect trends so that it can provide traders with potential points for entering and exiting trades. It’s a channel indicator plus a powerful trend indicator. It includes different types of channels which can be merged to create new channels simply by using the input parameters. MetaBands uses all types of alerts to notify users about market events. Features Supports most of the channel algorithms Powerful trend detection algorith
Gartley Hunter Multi
Siarhei Vashchylka
5 (11)
Gartley Hunter Multi - An indicator for searching for harmonic patterns simultaneously on dozens of trading instruments and on all possible timeframes. Manual (Be sure to read before purchasing) | Version for MT4 Advantages 1. Patterns: Gartley, Butterfly, Shark, Crab. Bat, Alternate Bat, Deep Crab, Cypher 2. Simultaneous search for patterns on dozens of trading instruments and on all possible timeframes 3. Search for patterns of all possible sizes. From the smallest to the largest 4. All fou
Volatility Master for MetaTrader is a real-time dashboard tool that scans up to 56 symbols using up to 2 flexible dashboards on different charts to identify high-volatility, trending markets instantly. With clear bullish/bearish signals, customizable alerts, and a user-friendly interface, it helps you avoid range-bound conditions and focus on high-probability trades. Clarity leads to confidence. Trade confidently and protect your capital effectively with this powerful dashboard. Setup & Guide: 
우선적으로, 이 거래 도구는 전문적인 거래에 이상적인 비-다시 그리기 및 지연되지 않는 지표입니다.  온라인 강좌, 사용자 매뉴얼 및 데모. 스마트 가격 액션 컨셉트 인디케이터는 신규 및 경험 많은 트레이더 모두에게 매우 강력한 도구입니다. Inner Circle Trader Analysis 및 Smart Money Concepts Trading Strategies와 같은 고급 거래 아이디어를 결합하여 20가지 이상의 유용한 지표를 하나로 결합합니다. 이 인디케이터는 스마트 머니 컨셉트에 중점을 두어 대형 기관의 거래 방식을 제공하고 이동을 예측하는 데 도움을 줍니다.  특히 유동성 분석에 뛰어나 기관이 어떻게 거래하는지 이해하는 데 도움을 줍니다. 시장 트렌드를 예측하고 가격 변동을 신중하게 분석하는 데 탁월합니다. 귀하의 거래를 기관 전략에 맞추어 시장의 동향에 대해 더 정확한 예측을 할 수 있습니다. 이 인디케이터는 시장 구조를 분석하고 중요한 주문 블록을 식별하고 다양
Cyclic Impulse MT5 — 이 기술 지표는 차트 구조를 분석하여 주기적인 가격 움직임을 식별합니다. 이를 통해 주기적인 가격 움직임의 반전과 진입 신호를 찾을 수 있습니다. 지표 작동 방식 주기적인 하락 움직임이 감지되면 캔들 마감 후 파란색 하락 막대가 생성됩니다. 현재 캔들에서 잠시 깜빡일 수 있으며, 신호는 아직 확정되지 않았습니다. 파란색 화살표는 가격 차트에 중복 표시됩니다. 주기적인 상승 움직임이 감지되면 캔들 마감 후 빨간색 상승 막대가 생성됩니다. 현재 캔들에서 잠시 깜빡일 수 있으며, 신호는 아직 확정되지 않았습니다. 주황색 ​​화살표는 가격 차트에 중복 표시됩니다. 모든 차트, 시간 프레임, 거래 상품에 사용 가능합니다. 다양한 알림 유형을 제공합니다. 가격 차트에 추가 화살표를 표시합니다. 과거 차트에는 다시 그려지지 않으며, 캔들 마감 시에만 작동합니다. 캔들이 마감되더라도 화살표나 막대는 사라지지 않습니다. 사용 및 매개변수 설정이 간편하며,
Transaction Speed MT5
Ivan Stefanov
5 (3)
이 지표는 시장에서 관심이 나타나는 영역 을 강조 표시한 후, 주문이 누적되는 영역 을 보여줍니다. 이는 **대규모 오더북(호가창)**처럼 작동합니다. 이것은 거대한 자금 을 위한 인디케이터입니다. 성능은 탁월하며, 시장에서 어떤 관심이 있든 반드시 포착할 수 있습니다 . (이것은 완전히 새로 작성되고 자동화된 버전 입니다 – 이제 수동 분석은 필요하지 않습니다.) **거래 속도(Transaction Speed)**는 새로운 개념의 인디케이터로, 시장에 대규모 주문이 언제, 어디에 쌓이는지를 보여주며 , 그 이점을 분석합니다. 매우 초기 단계에서 트렌드 전환 을 감지할 수 있습니다. FX 시장에서 흔히 사용하는 "거래량(volume)"은 오해입니다. 실제로는 시간당 가격 변화량 이므로, 올바른 용어는 거래 속도 입니다. 우리가 어떻게 사고하고, 행동하며, 분석하느냐 가 가장 중요합니다. 분석 패러다임의 전환 은 필수적입니다. 이 인디케이터는 외환 시장에서의 볼륨 개념을 논리적으로
Ultimate SMC Indicator
Hicham Mahmoud Almoustafa
1 (1)
ULTIMATE SMC INDICATOR — PRO EDITION     Trade Like Institutional Traders Are you tired of losing trades because you don't  know WHERE the big money is positioned? The Ultimate SMC Indicator reveals the hidden  footprints of banks and institutions directly on  your chart — giving you the edge that professional  traders use every day. WHAT IS SMC
제작자의 제품 더 보기
CONGESTION BREAKOUT PRO This indicator scans the breakout of congestion zones . This indicator unlike any other congestion indicator you will find in the market right now,  it uses an advanced algorithm not peculiar to most traditional congestion indicators available today . The advanced algorithm used to define the congestions  is greatly responsible for the high rate real congestion zones and low rate fake congestion zones spotted by this product. UNDERSTANDING CONGESTION Congestion are ar
YOU CAN NOW DOWNLOAD FREE VERSIONS OF OUR PAID INDICATORS . IT'S OUR WAY OF GIVING BACK TO THE COMMUNITY ! >>>    GO HERE TO DOWNLOAD This system is an Heiken Ashi system based on RSI calculations . The system is a free open source script originally published on TradingView by JayRogers . We have taken the liberty of converting the pine script to Mq4 indicator . We have also added a new feature which enables to filter signals and reduces noise on the arrow signals. Background HEIKEN ASHI Th
FREE
M & W Pattern Pro is an advanced scanner for M and W patters , it uses extra filters to ensure scanned patterns are profitable. The indicator can be used with all symbols and time frames. The indicator is a non repaint indicator with accurate statistics calculations. To use , simply scan the most profitable pair using the statistics dashboard accuracy , then enter trades on signal arrow and exit at the TP and SL levels. STATISTICS : Accuracy 1 : This is the percentage of the times price hits TP
YOU CAN NOW DOWNLOAD FREE VERSIONS OF OUR PAID INDICATORS . IT'S OUR WAY OF GIVING BACK TO THE COMMUNITY ! >>>    GO HERE TO DOWNLOAD More About Advanced Currency Meter Every good forex system has the following basic components: Ability to recognize the trend direction. Ability to identify the strength of the trend and answer the basic question Is the market trending or is it in a range? Ability to identify safe entry points that will give a perfect risk to reward (RR) ratio on every position.
FREE
Volatility Ratio
Noiros Tech
4.27 (15)
YOU CAN NOW DOWNLOAD FREE VERSIONS OF OUR PAID INDICATORS . IT'S OUR WAY OF GIVING BACK TO THE COMMUNITY ! >>>    GO HERE TO DOWNLOAD The Volatility Ratio was developed by Jack D. Schwager to identify trading range and signal potential breakouts. The volatility ratio is defined as the current day's true range divided by the true range over a certain number of days N (i.e. N periods). The following formula is used to calculate the volatility ratio: Volatility Ratio (VR) = Today's True Range/Tru
FREE
Volatility Ratio Mt5
Noiros Tech
5 (2)
YOU CAN NOW DOWNLOAD FREE VERSIONS OF OUR PAID INDICATORS . IT'S OUR WAY OF GIVING BACK TO THE COMMUNITY ! >>>    GO HERE TO DOWNLOAD The   Volatility Ratio   was developed by Jack D. Schwager to identify trading range and signal potential breakouts. The volatility ratio is defined as the current day's true range divided by the true range over a certain number of days N (i.e. N periods). The following formula is used to calculate the volatility ratio: Volatility Ratio (VR) = Today's True Range
FREE
Heiken Ashi RSI Oscillator
Noiros Tech
4.94 (17)
YOU CAN NOW DOWNLOAD FREE VERSIONS OF OUR PAID INDICATORS . IT'S OUR WAY OF GIVING BACK TO THE COMMUNITY ! >>>    GO HERE TO DOWNLOAD This system is an Heiken Ashi system based on RSI calculations . The system is a free open source script originally published on TradingView by JayRogers . We have taken the liberty of converting the pine script to Mq4 indicator . We have also added a new feature which enables to filter signals and reduces noise on the arrow signals. Background HEIKEN ASHI Th
FREE
Volume Strength 28
Noiros Tech
3.75 (8)
Version 1.6 ! Volume Strength 28 is better , easier to use and more awesome ! Based on complaint we got from the reviews, we understood many don't know how to really use the time frame setting on the input menu thus they have complaints of volatility, thus we have designed an Automatic Time Frame selection system that is suitable for novice traders.! The design of the indicator has been changed along with some calculation metrics. Based on complaints of high volatility we have been getting ,we
FRM Half Trend
Noiros Tech
3.5 (2)
YOU CAN NOW DOWNLOAD FREE VERSIONS OF OUR PAID INDICATORS . IT'S OUR WAY OF GIVING BACK TO THE COMMUNITY ! >>>    GO HERE TO DOWNLOAD   The system is a free open source pine script originally published on TradingView by everget   . It was converted to Mt4 by Forex Robot Makers. This system is a  popular trend indicator based on ATR ( Average True Range ) , Moving Averages and the Donchian channel . System BackGround ATR The average true range is an indicator of the price volatility of an asse
FREE
High Volume Turns
Noiros Tech
4.86 (7)
YOU CAN NOW DOWNLOAD FREE VERSIONS OF OUR PAID INDICATORS . IT'S OUR WAY OF GIVING BACK TO THE COMMUNITY ! >>>  GO HERE TO DOWNLOAD Most of the time, market reversals / pull backs usually follow volume and price spikes thus  these spikes could be the first indication of an exhaustion and possible reversal/pullback. High volume Turns is an indicator that scans the market for price and volume spikes around over-bought/over-sold market conditions. These spikes when spotted serves as the first indi
FREE
YOU CAN NOW DOWNLOAD FREE VERSIONS OF OUR PAID INDICATORS . IT'S OUR WAY OF GIVING BACK TO THE COMMUNITY ! >>>    GO HERE TO DOWNLOAD Camarilla Pivots Historical plots the historical data of the camarilla pivot point levels on the chart. The Camarilla Pivot levels was originated in 1989 by Nick Scott. The levels are used as primary support and resistance levels by Intraday traders. The levels are calculated with the following formula: R4 = C + RANGE * 1.1/2 R3 = C + RANGE * 1.1/4 R2 = C + RANG
FREE
Good News ! Advanced Currency Meter is more awesome now ! If you have been a fan of the free version of Advanced Currency Meter then I will implore you not to be discourage because you will soon find that the new paid version is worth every dime. Unlike the free version the new paid version of Advanced Currency Meter now has a newly added panel called the “% Daily Range” . Why A Paid Version Now? We believe you like good things and many who has used Advanced Currency Meter over the years will te
V1 Scalper
Noiros Tech
YOU CAN NOW DOWNLOAD FREE VERSIONS OF OUR PAID INDICATORS . IT'S OUR WAY OF GIVING BACK TO THE COMMUNITY ! >>>    GO HERE TO DOWNLOAD V1 Scalper is an easy to use tool designed for trend scalping. It tries to spot good entry points in a major trend by using swing high and lows formed along the trend . This tool can be used on Fx Pairs , Indices , Commodities and stocks. Not often  but in some signals , the arrow might repaint on the current candle so extra confirmation tools are advised for tr
FREE
Daily Correlated Pairs
Noiros Tech
4.8 (5)
YOU CAN NOW DOWNLOAD FREE VERSIONS OF OUR PAID INDICATORS . IT'S OUR WAY OF GIVING BACK TO THE COMMUNITY ! >>>    GO HERE TO DOWNLOAD The popular saying in forex  "The Trend is your friend"   has always stood the test of time because it is valid statement for every generation of traders and in every market. Most successful traders do not fight against the trend but lend to flow with it.  Sometimes finding the best pair to trade can be a daunting task even when you have a good strategy . Some
FREE
Mommentum Channel
Noiros Tech
5 (2)
YOU CAN NOW DOWNLOAD FREE VERSIONS OF OUR PAID INDICATORS . IT'S OUR WAY OF GIVING BACK TO THE COMMUNITY ! >>>    GO HERE TO DOWNLOAD Momentum channel is a simple momentum based system yet with a great degree of accuracy in detecting turning points. The market momentum are defined by Average True Range Channels . When price breaks these channels most times , it is an indication of a shift in market momentum and thus a possible new trend formation. The system can be traded on any time frame and
FREE
Ask any successful forex traders the secret of their success and they will tell you that the first key to a successful forex trading is proper trade management. Trade management is what differentiates the rookie from the pro in Forex. While the rookie trades based on emotions and greed, the pro trades based on certain logic and rules . These logic and rules are all embodied in a successful Trade Management System. Advanced Trade Manager is a combination of different trade management systems desi
This Currency Meter Calculates Strength Using a currency basket of 28 pairs? This Currency Meter uses a basket of 28 currency pair to define strength. This is very important because it gives an wholesome view of the strength of a currency by considering its reaction to all major currencies paired with it. This Currency Meter is Multi-timeframe!!! Majority of the currency strength indicators around the market today only has a single time frame view. Even with the so called multi-timeframe versi
Pivots Dashboard
Noiros Tech
5 (1)
Pivots Dashboard is the single most complete instruments set for Pivot Points trading currently available in the market. We have done a comprehensive research prior to the product design to make sure that this product meets every need of Pivot Point trading. Pivots Points are significant levels technical analysts can use to determine directional movement and potential support/resistance levels. Pivot Points are thus predictive or leading indicators. While the points were originally used by floor
Note : The slow loading of the indicator issue has been addressed . This new version loads fast and does not slow the platform. Version 1.3 : We have updated the indicator to include an historical bar scanning option . So instead of scanning all bars in the history (which can make the indicator slow sometimes ) , you can select the maximum number of bars it can scan which can increase the performance and make the indicator faster. This indicator scans the 1-3 Trendline pattern . The indicato
Wolfe Scanner Pro
Noiros Tech
3 (1)
WOLFE WAVE PATTERNs First discovered by Bille Wolfe . The wolfe wave  is a 5 wave price action pattern that is formed by supply and demand in a market and the fight to reach equilibrium in the market . The entry spot of the pattern is defined by the breakout of the trend created by wave 1 and wave 3 . This pattern forms in any market where there is supply and demand thus it can also be used to trade commodities and stocks. Wolfe Waves are reversal patterns that usually carry a low risk margin. P
Swing Continuation
Noiros Tech
2.6 (5)
The swing continuation pattern happens in a trend direction after a short reversal / pull back . As the name suggests , these patterns occurs along the swing high and swing lows of a trend , this makes the patterns very low risk patterns with potential high rewards . The swing continuation indicator also combines Currency Meter as a filter for its execution. The idea is to go with both the price trend flow and currency trend flow. Which means the price action must be supported by the currency st
M W Pattern Pro
Noiros Tech
4.14 (7)
M & W Pattern Pro is an advanced scanner for M and W patters , it uses extra filters to ensure scanned patterns are profitable. The indicator can be used with all symbols and time frames. The indicator is a non repaint indicator with accurate statistics calculations. To use , simply scan the most profitable pair using the statistics dashboard accuracy , then enter trades on signal arrow and exit at the TP and SL levels. STATISTICS : Accuracy 1 : This is the percentage of the times price hits TP
Flag Pattern Pro
Noiros Tech
5 (3)
Flag Pattern pro is a   Price Action (PA)   analytical tool that scans the   continuation patterns   known as   "Flag and Pennant Patterns"   . Flag and Pennant patterns are continuation patterns characterized by a move in a previous trend direction after a shallow retracement usually below 50% of the original move . Deep retracements can however be sometimes found at the 61.8 % levels. The original move is know as the   flag pole   and the   retracement   is called the flag.   Indicator Funda
Channel Vertex Pro
Noiros Tech
5 (1)
Channel Vertex is a price action pattern formed by price Chanel and a triangle pattern . Price channels basically indicates possible support and resistance zones around a price movement and retracement    or breakout at these levels can indicate possible trend continuation or reversal .  Majority of the times price fluctuations forms triangle patterns defined by 3 vertexes , these triangle patterns most times defines a trend continuation.  A triangle pattern is a trend continuation pattern that
The market session currency meter is an advanced currency meter designed majorly for intra-day trading. The meter tracks price movements and volatilities across the different market sessions daily. With this market meter you will be able to see how price moved within the four (4) major market sessions ( SYDNEY , TOKYO , LONDON and NEW YORK ). The indicator comes with an inbuilt daily savers time adjuster that automatically adjusts the hours for each session when ever the daily savers time (DST)
This Currency Meter Calculates Strength Using a currency basket of 28 pairs? This Currency Meter uses a basket of 28 currency pair to define strength. This is very important because it gives an wholesome view of the strength of a currency by considering its reaction to all major currencies paired with it. This Currency Meter is Multi-timeframe!!! Majority of the currency strength indicators around the market today only has a single time frame view. Even with the so called multi-timeframe versio
Flag Pattern pro is a   Price Action (PA)   analytical tool that scans the   continuation patterns   known as   "Flag and Pennant Patterns"   . Flag and Pennant patterns are continuation patterns characterized by a move in a previous trend direction after a shallow retracement usually below 50% of the original move . Deep retracements can however be sometimes found at the 61.8 % levels. The original move is know as the   flag pole   and the   retracement   is called the flag. Indicator Fundam
Channel Vertex is a price action pattern formed by price Chanel and a triangle pattern . Price channels basically indicates possible support and resistance zones around a price movement and retracement    or breakout at these levels can indicate possible trend continuation or reversal .  Majority of the times price fluctuations forms triangle patterns defined by 3 vertexes , these triangle patterns most times defines a trend continuation.  A triangle pattern is a trend continuation pattern that
CONGESTION BREAKOUT PRO This indicator scans the breakout of congestion zones . This indicator unlike any other congestion indicator you will find in the market right now,  it uses an advanced algorithm not peculiar to most traditional congestion indicators available today . The advanced algorithm used to define the congestions  is greatly responsible for the high rate real congestion zones and low rate fake congestion zones spotted by this product. UNDERSTANDING CONGESTION Congestion are ar
필터:
리뷰 없음
리뷰 답변