Wolfe Scanner Pro
- 지표
- 버전: 1.5
- 업데이트됨: 22 1월 2024
- 활성화: 5

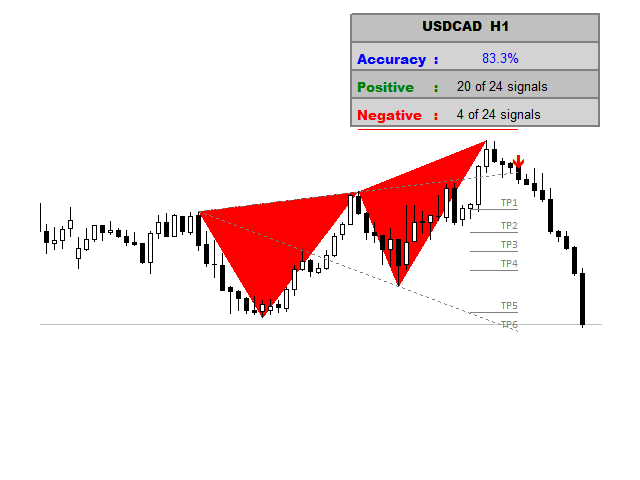
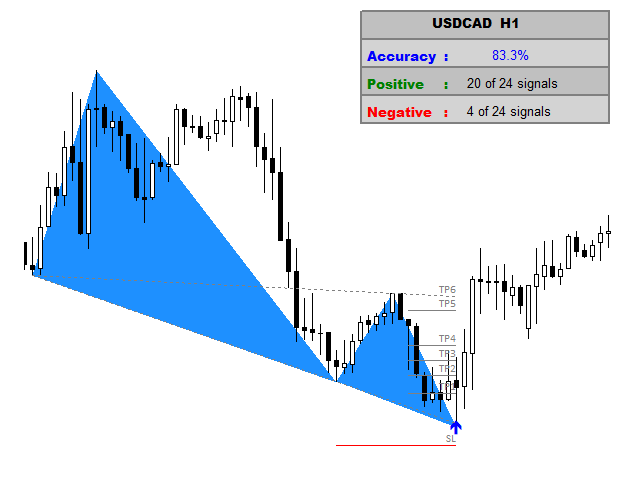
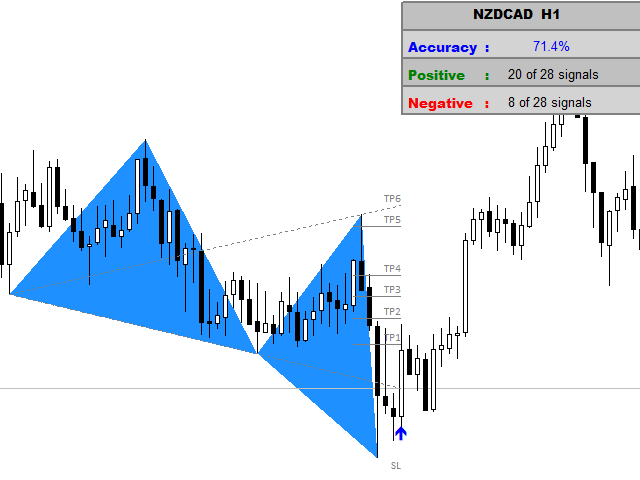
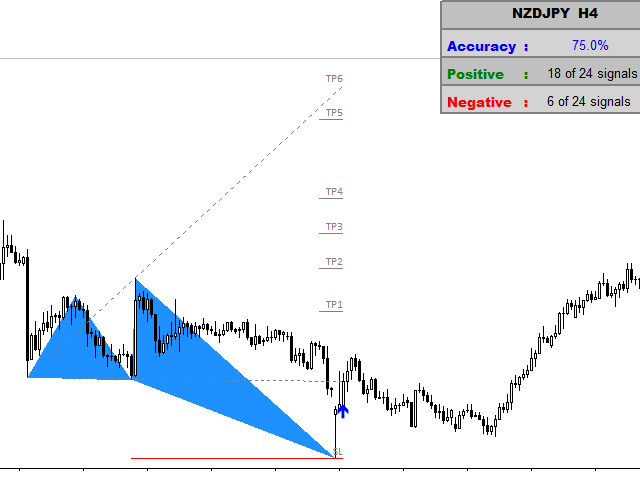
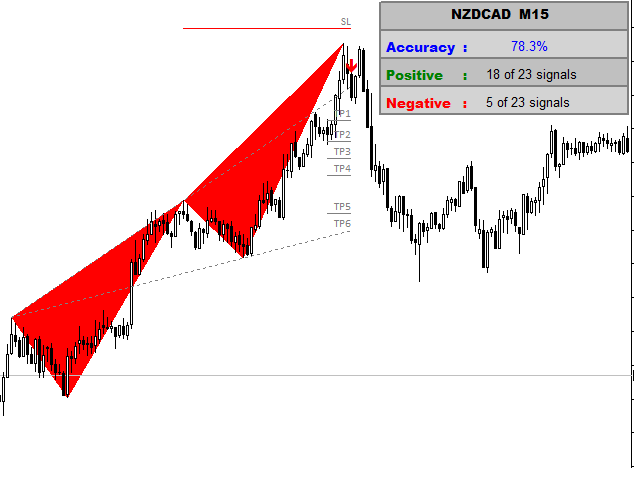
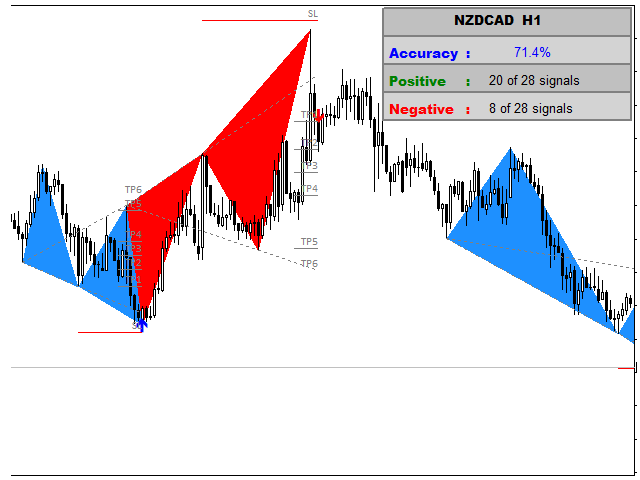
WOLFE WAVE PATTERNs
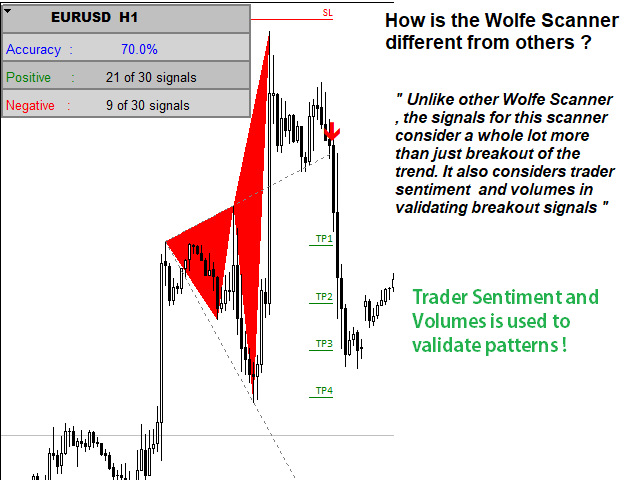
First discovered by Bille Wolfe . The wolfe wave is a 5 wave price action pattern that is formed by supply and demand in a market and the fight to reach equilibrium in the market. The entry spot of the pattern is defined by the breakout of the trend created by wave 1 and wave 3 . This pattern forms in any market where there is supply and demand thus it can also be used to trade commodities and stocks. Wolfe Waves are reversal patterns that usually carry a low risk margin.
Product Features
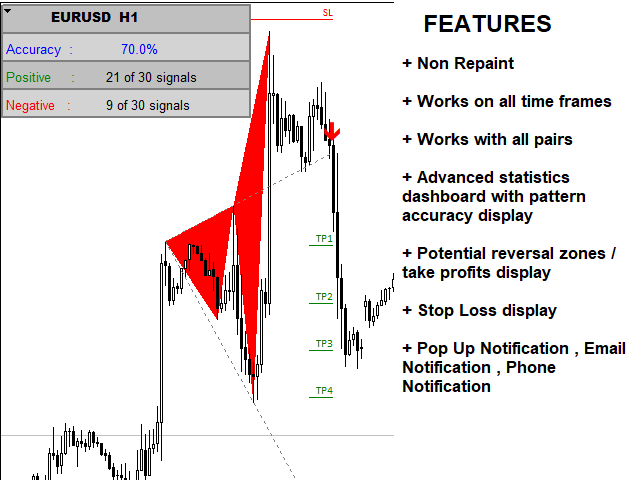
- The Pattern Signals are non-repaint
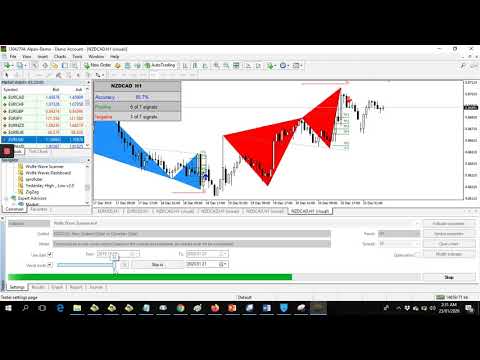
- The product scans Wolfe wave patterns on any time frame and currency pair.
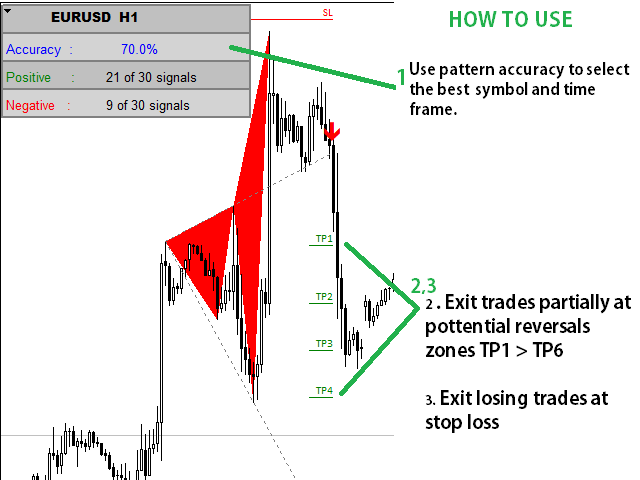
- It comes with a statistics dashboard that shows pattern accuracy.
- Each pattern has a stop loss and 5 Fibonacci targets .
- The scanner also comes with a notification system for when patterns are formed.
INPUTs
- Scan Range : Numbers of history bars to scan
- Pattern Period : Used to define pattern points, lower period will scan closer pattern points
- TP1 : First Target Fibonacci Ratio
- TP2 : Second Target Fibonacci Ratio
- TP3 : Third Target Fibonacci Ratio
- TP4 : Fourth Target Fibonacci Ratio
- TP5 : Fifth Target Fibonacci Ratio
- TP6 : Sixth Target Fibonacci Ratio
- Pop Up : Pop Up Alert
- Email : Email Alerts
- Phone : Phone Notifications
YOU CAN NOW DOWNLOAD FREE VERSIONS OF OUR PAID INDICATORS . IT'S OUR WAY OF GIVING BACK TO THE COMMUNITY !


The indicator finds many WolfeWave. But you have to change the parameters repeatedly. This leads to the fact that you have to go into the settings all the time to get 100% or 75%. I have set up several time units and adjusted various parameters. For example M5 with 500/12, M5 with 500/4, M30 with 500/12 and M30 with 1300/10. Unfortunately, the Metatrader is completely overtaxed with it. It often does not react, crashes, the display freezes. I have opened a new Metatrader only for the WolfeWave. But even if you only run the WolfeWave and no other indicators, the display freezes constantly, I can't make changes. The found WolfeWave are good. It often runs every point exactly. However, then there is only TP1 or TP2, but no exact price information. There is an alarm when a new WolfeWave is found, but I would prefer it if there would also be an alarm when the TPs are reached. Another problem is: If you want to open the Metatrader, the WolfeWave shows all last alarms in an extra window. These are actually done. Thus it can happen that the Metatrader does not open or the display freezes. This should be changed by the programmer, so that the Metatrader can open without alarms of the WolfeWave. All in all there are too many technical problems. This is more than annoying, because you don't know that before you buy it.