Cybertrade ATR Trend Zone
- 지표
- 버전: 1.0

Cybertrade ATR Trend Zone - MT5
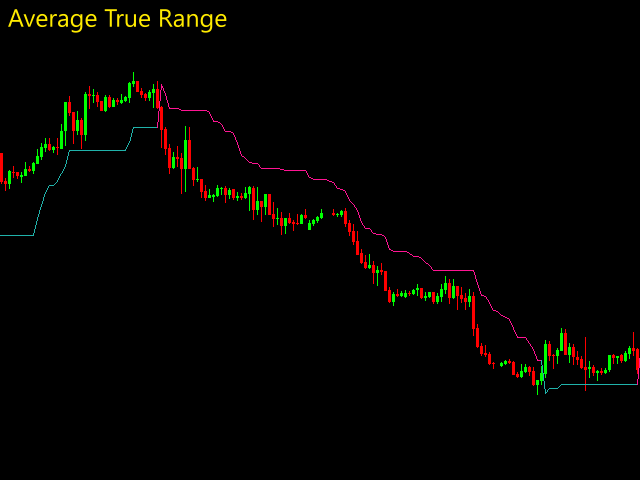
The indicator shows, by calculating the ATR (Average True Range), the zone of probable price resistance.
Indicated to be used as a probable exit point of an operation.
It works on periods longer than the period visible on the chart.
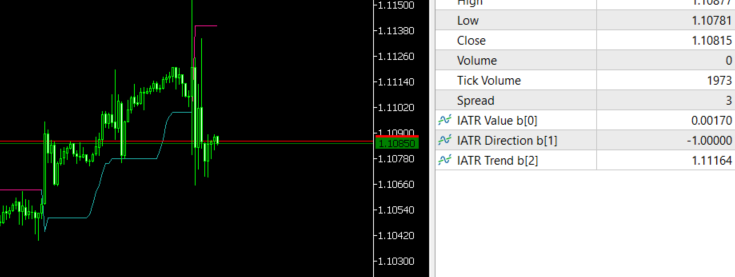
All values are available in the form of buffers to simplify possible automations.
This indicator is the same one we use in our EA.
Also check out our other products.


Super