Inguz 4
- 지표
-
Maxim Kuznetsov
 My big personal project : http://nektomk.ru/en:atcl:start
Integration MT4 with world via Tcl :-) Excel, Mail, Networking, Rest-API, Websockets and many many others are accessable from MetaTrader. - 버전: 1.4
- 업데이트됨: 10 10월 2021
- 활성화: 5
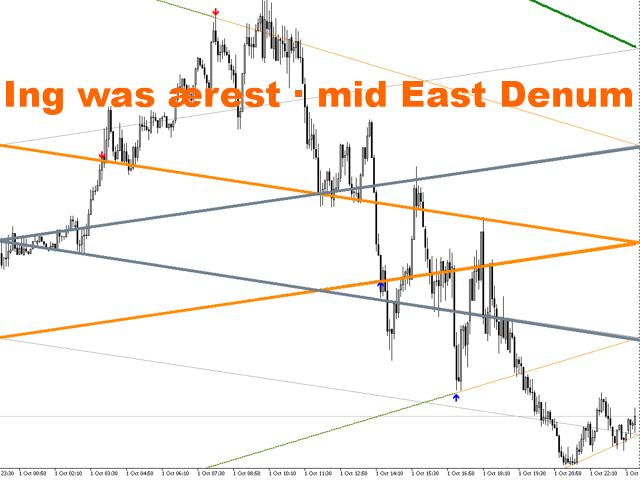
Ing (inguz,ingwar) - the 23rd rune of the elder Futhark ᛝ, Unicode+16DD. Add some runic magic to your trading strategies. The correct marking of the daily chart will indicate to you the successful moments for counter-trend trading. Simple to use, has high efficiency in volatile areas. Be careful in lateral movements.
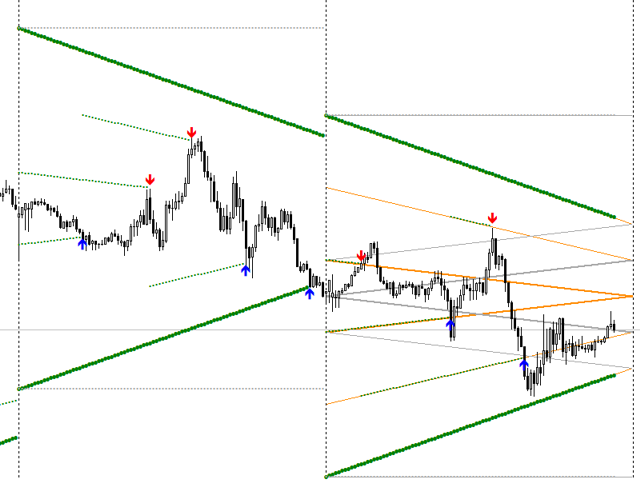
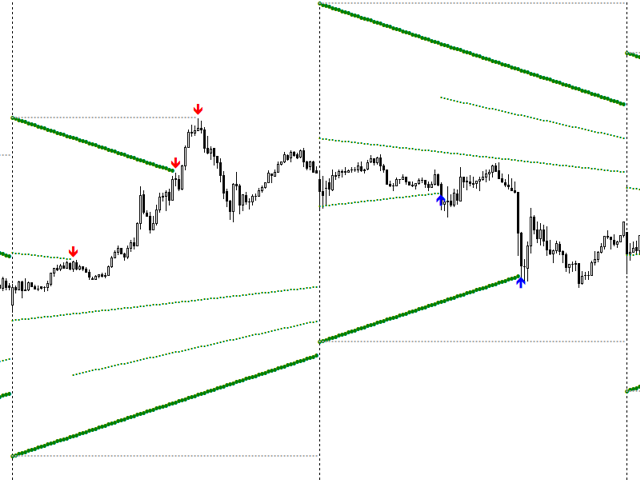
Signals ᛝ are generated when the main lines of construction intersect.
Red arrow down - recommended sales
Blue up arrow - recommended purchases
rare purple arrows indicate excessive movement, it is recommended to fix a position, exit the market and skip the next day.
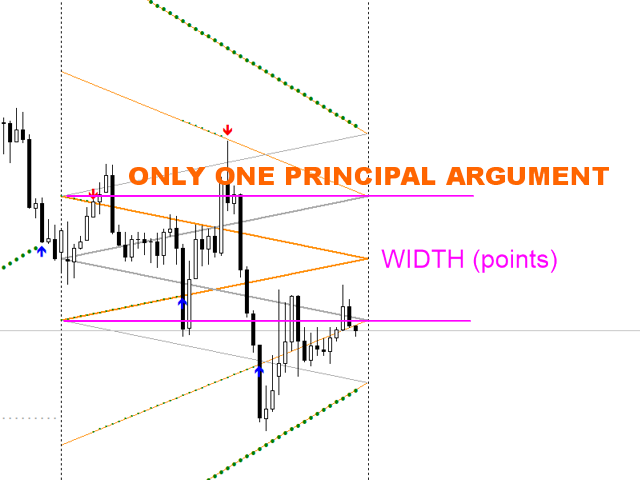
Settings:
The main and main parameter is the size of the rune, "Rune Width". Set in points. At the first trial run, you can specify 0, then the indicator will determine the approximate value of the parameter according to the statistics of the tool.
For trading on non-round-the-clock instruments, the "Hours in trading day" parameter is important - specify the number of hours in the trading day.
The other options specify the generation of signals:
"Triggered Mode" - switch signals from volatility. Enabled by default
"Point to NearLevel" - points to the near level to generate a signal. Similar to "Point to MediumLevel", "Points to Far Level"
"don't signal before Midnight" - how many minutes BEFORE midnight to prohibit the generation of signals. By default 90
"don't signal after Midnight" - how many minutes AFTER midnight not to generate signals. By default 180
"Allow ALERTS" - enable terminal alerts. Enabled by default
"Allow MOBILE" - allow PUSH notifications to the phone.
Additionally, you can specify whether or not to display runes and signals on the chart.
Good luck! I hope that rune magic will help you