NeuroScalperMT5

MT4 indicator version

https://www.mql5.com/en/market/product/72342


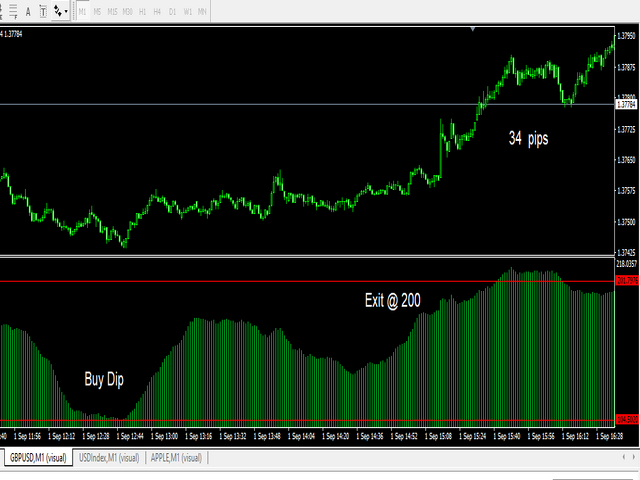
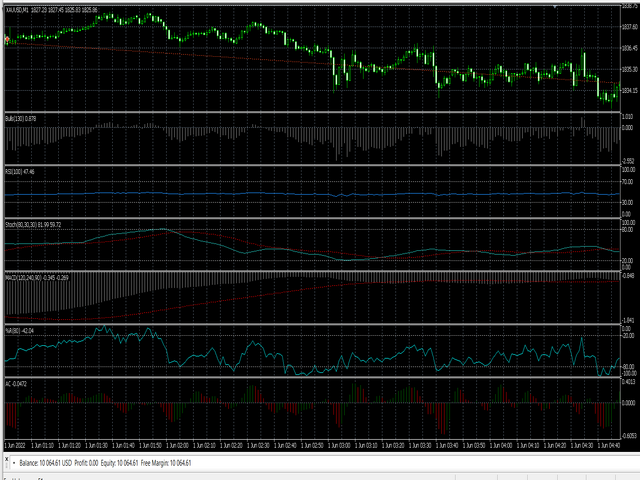
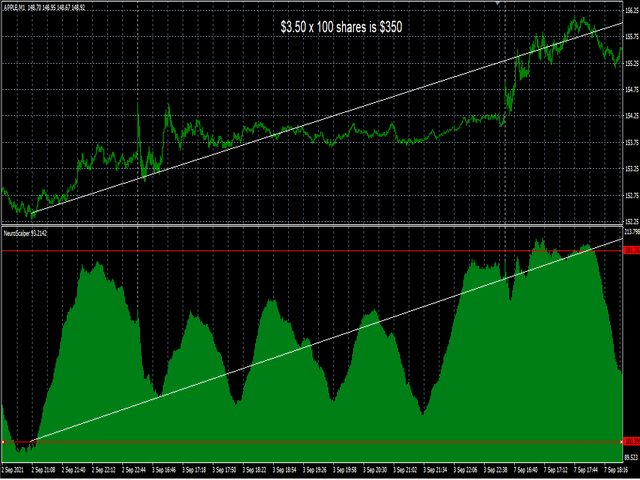
I personally use this indicator to scalp.  Accurate for accessing extremes and supports for buy positions primarily for 1 minute time frames.  Other time frames can be used but the levels are different. Its a better oscillator and compare with others to see the difference.  


Day trade using neuro network concepts.  This indicator uses elementary forms of neuro networks to generate signals to buy and sell. Use the indicator on 1 minute charts.  Indicator does not repaint.   Download and run on tester using 1 minute charts or other charts using different levels, analyze the trades to see for yourself. Many opportunities to scalp the markets.  Can be used on higher time frames but the levels should be changed according to your discretion.  Higher time frames have higher ranges.


Concept and things to consider with this model:

Multiple indicators are used, weights applied and 2 data points for the max an min.
This indicator is for trading uptrends mainly 
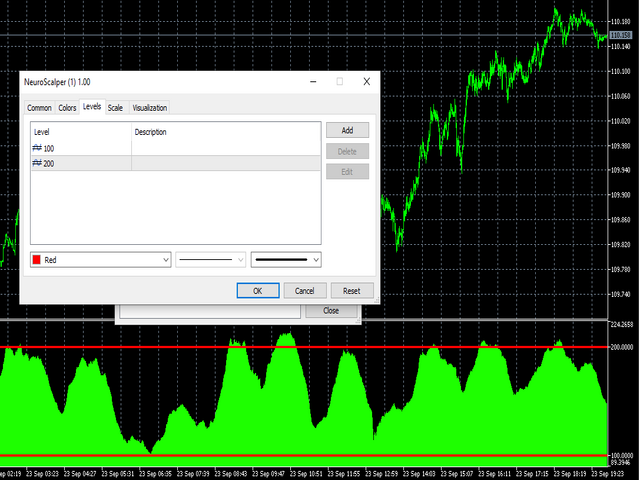
Add levels in settings(see picture) 100 and 200 for the oscillator, or other levels if using different time frames.
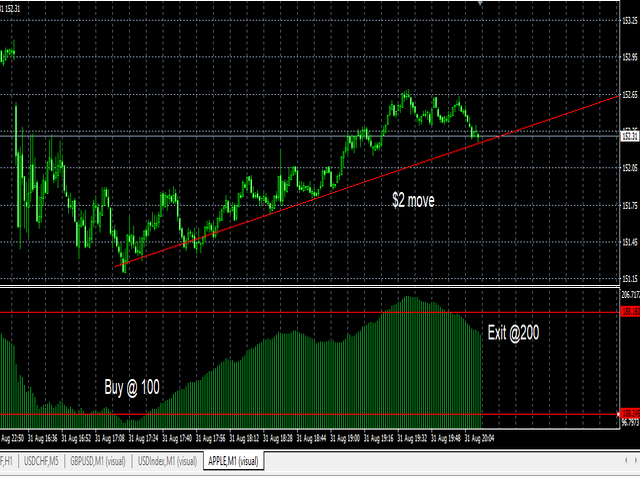
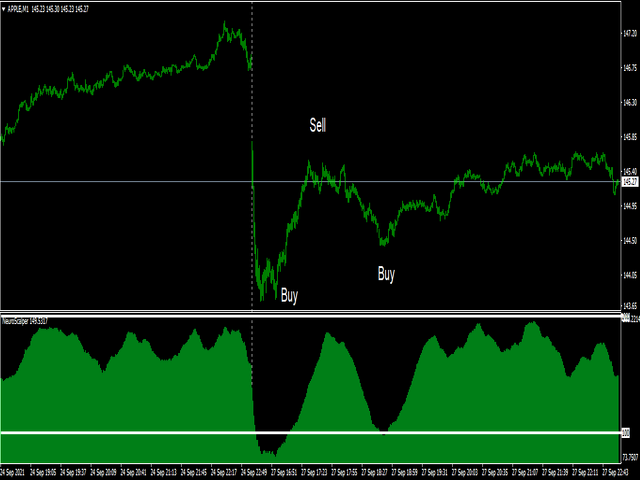
Buy when the price dips below lowest levels for the pair and time frame.  This is the cluster with good accuracy on 1 minutes.

    Rules:

    • Buy below 100 level and exit at 200.

    Download and run on tester using on the charts to see what levels are the best for buying.  Analyze the trades to see for yourself. Many opportunities to scalp the markets.


    추천 제품
    Raymond Cloudy Day
    The Hung Ngo
    5 (3)
    Raymond Cloudy Day Indicator for MT5 – Pivot-Based Reversal and Trend Levels Raymond Cloudy Day Indicator is a pivot-based level indicator for MetaTrader 5 (MT5). It was developed by Ngo The Hung based on Raymond’s original idea and is designed to give a structured view of potential reversal zones, trend extensions and support/resistance levels directly on the chart. The default settings are optimised for XAUUSD on the H1 timeframe, but the indicator can be tested and adjusted for other symbols
    FREE
    Rainbow MT5
    Jamal El Alama
    4 (1)
    Description : Rainbow MT5 is a technical indicator based on Moving Average with period 34 and very easy to use. When price crosses above MA and MA changes color to green, then this is a signal to buy. When price crosses below MA and MA changes color to red, then this is a signal to sell. The Expert advisor ( Rainbow EA MT5 ) based on Rainbow MT5 indicator is now available here . MT4 version is available here .
    FREE
    Follow The Line MT5
    Oliver Gideon Amofa Appiah
    4.6 (35)
    This indicator obeys the popular maxim that: "THE TREND IS YOUR FRIEND" It paints a GREEN line for BUY and also paints a RED line for SELL. (you can change the colors). It gives alarms and alerts of all kinds. IT DOES NOT REPAINT and can be used for all currency pairs and timeframes. Yes, as easy and simple as that. Even a newbie can use it to make great and reliable trades. NB: For best results, get my other premium indicators for more powerful and reliable signals. Get them here: https://www.m
    FREE
    Key level wedge MT5
    Presley Annais Tatenda Meck
    The   Key level wedge MT5   indicator automatically draws rising wedge pattern and falling wedge pattern for you on the chart. This pattern is really good when used as a confirmation entry at key support & resistance, supply & demand and reversal zones. Advantages  The   Key level wedge MT5   block DOES NOT RE-PAINT, giving you confidence when a signal appears and also helps when looking back.  The   Key level wedge MT5   includes an on/off button on the chart to easily keep the charts clean
    Price Magnet — Price Density and Attraction Levels Indicator Price Magnet is a professional analytical tool designed to identify key support and resistance levels based on statistical Price Density. The indicator analyzes a specified historical period and detects price levels where the market spent the most time. These zones act as “magnets,” attracting price action or forming a structural base for potential reversals. Unlike traditional Volume Profile tools, Price Magnet focuses on price-time d
    Pivot MT5
    Dmitrij Isaenko
    The indicator draws daily support and resistance lines on the chart, as well as the Pivot level (reversal level). Adapted to work in MT5 The standard timeframe for calculating support and resistance levels is D1. You can choose other timeframes according to your strategy (for example, for M1-M15, the optimal timeframe for calculations is H1) The function for calculating support and resistance levels has been updated; in this calculation option, fibonacci levels are taken into account, respec
    FREE
    Donchian Breakout And Rsi
    Mattia Impicciatore
    4.5 (2)
    개요 이 지표는 클래식 돈치안 채널(Donchian Channel) 의 향상된 버전으로, 실전 트레이딩을 위한 다양한 기능이 추가되었습니다. 표준 세 개의 선(상단, 하단, 중앙선) 외에도 브레이크아웃 을 감지하여 차트에 화살표로 시각적으로 표시하며, 차트를 깔끔하게 보기 위해 현재 추세 방향의 반대 라인만 표시 합니다. 지표 기능: 시각적 신호 : 브레이크아웃 시 컬러 화살표 표시 자동 알림 : 팝업, 푸시 알림, 이메일 RSI 필터 : 시장의 상대 강도를 기반으로 신호 검증 사용자 맞춤 설정 : 색상, 선 두께, 화살표 코드, RSI 임계값 등 동작 원리 돈치안 채널은 다음을 계산합니다: 상단선 : 최근 N개의 종가 완료 캔들에서 가장 높은 고가 하단선 : 최근 N개의 종가 완료 캔들에서 가장 낮은 저가 중앙선 : 고가와 저가의 평균값 상방 브레이크아웃 은 종가가 상단선을 돌파할 때 발생하며, 하방 브레이크아웃 은 종가가 하단선 아래로 내려갈 때 발생합니다. 이 지표는: 세 개의
    FREE
    Weis Waves
    Flavio Javier Jarabeck
    2.83 (18)
    The original author is David Weis, an expert in the Wyckoff Method. The Weis Wave is a modern adaptation of the 1930's Wyckoff Method, another expert in Tape Reading techniques and Chart Analysis. Weis Waves takes market volume and stacks it into waves according to price conditions giving the trader valuable insights about the market conditions. If you want to learn more about this subject you can find tons of videos in YouTube. Just look for "The Wickoff Method", "Weis Wave" and "Volume Spread
    FREE
    PZ Penta O MT5
    PZ TRADING SLU
    3.5 (4)
    The Penta-O is a 6-point retracement harmonacci pattern which usually precedes big market movements. Penta-O patterns can expand and repaint quite a bit. To make things easier this indicator implements a twist: it waits for a donchian breakout in the right direction before signaling the trade. The end result is an otherwise repainting indicator with a very reliable trading signal. The donchian breakout period is entered as an input. [ Installation Guide | Update Guide | Troubleshooting | FAQ | A
    FREE
    BTFX Pivot Points
    Bradley Thomas Farrington
    The BTFX Pivot Points is an indicator which calculates the Support and Resistance levels for each day. By using this indicator the pivot levels point out clear targets to aim for. The resistance levels are shown in purple above the silver pivot line. The support levels are shown in Orange and can be found below the silver pivot line. This indicators works very well when used with The BTFX Daybreak Indicator. For a more in depth explanation of these indicators please watch the Youtube video attac
    "Adjustable Fractals"는 프랙탈 지표의 고급 버전으로, 매우 유용한 거래 도구입니다! .................................................................................................................. - 알다시피 표준 프랙탈 MT5  지표에는 설정이 전혀 없습니다. 이는 거래자에게 매우 불편합니다. - Adjustable Fractals는 이 문제를 해결했습니다. 필요한 모든 설정이 있습니다. - 지표의 조정 가능한 기간(권장 값 - 7 이상). - 가격의 고점/저점으로부터 조정 가능한 거리. - 프랙탈 화살표의 조정 가능한 디자인. - 표시기에는 모바일 및 PC 알림 기능이 내장되어 있습니다. 여기를 클릭하여 고품질 트레이딩 로봇과 지표를 확인하세요! 이 MQL5 웹사이트에서만 제공되는 오리지널 제품입니다.
    Indicator Description 4 Hull MA Color + Envelopes is a powerful trend-following indicator for MetaTrader 5 that combines four Hull Moving Averages (HMA) with Moving Average Envelopes to clearly identify market direction, trend strength, and potential reversal or pullback zones. This indicator is designed to reduce noise, react quickly to price movement, and provide a clean visual structure for professional trading.   Key Features   4 Hull Moving Averages (20, 50, 100, 200) Automatic color change
    FREE
    마켓 익소스천 인디케이터 가격: $0 플랫폼: MetaTrader 5 유형: 기술적 지표 (자동매매 아님) 개요 Market Exhaustion Indicator 는 시장 구조 기반 기술적 분석 도구로, GomerAI 시장 연구 프레임워크의 일부로 개발되었습니다. 이 지표는 객관적인 시장 구조 분석을 통해 단기적인 가격 극단과 잠재적인 되돌림 구간을 식별하도록 설계되었습니다. 단순한 캔들 카운트나 일반적인 과매수/과매도 지표에만 의존하는 대신, 이 지표는 낮은 시간 프레임의 시장 구조를 분석하여 다음을 식별합니다. 확인된 스윙 고점과 스윙 저점 최근 구조적 극단을 넘어서는 가격 이동 강한 방향성 움직임 이후 발생할 수 있는 시장 피로 또는 소진 이전 구조 영역으로의 되돌림 조건 이 지표는 자동 거래가 아닌, 객관적이고 규칙 기반의 방식으로 시장 소진을 식별하려는 트레이더를 위해 설계되었습니다. 기능 설명 이 지표는 다음을 지속적으로 분석합니다. 확인된 스윙 고점 및 저점 탐지 단기
    FREE
    Gekko ADX Plus
    Rodrigo Galeote
    This is Gekko's Cutomized Cutomized Average Directional Index (ADX), a customized version of the famous ADX indicator. Use the regular ADX and take advantage two entry signals calculations and different ways of being alerted whenever there is potential entry or exit point. Inputs Period: Period for the ADX calculation; PlotSignalType: How will the indicator calculate entry (swing) signals: 1- ShowSwingsOnTrendLevel : Show Signals for Trend Confirmation Swings; 2- ShowSwingsOnTrendLevelDirection
    Best SAR MT5
    Ashkan Hazegh Nikrou
    4.33 (3)
    설명 :  우리는 외환 시장(PSAR)에서 전문적이고 인기 있는 지표 중 하나를 기반으로 하는 새로운 무료 지표를 도입하게 된 것을 기쁘게 생각합니다. 이 지표는 원래 포물선 SAR 지표에 대한 새로운 수정이며, 프로 SAR 지표에서 점과 가격 차트 사이의 교차를 볼 수 있습니다. 교차는 신호가 아니지만 이동 가능성의 끝을 말하는 것입니다. 새로운 파란색 점으로 매수를 시작하고 첫 번째 파란색 점 앞에 손절매를 1 attr 배치하고 마지막으로 점이 가격 차트를 교차하는 즉시 종료할 수 있습니다. 매수 또는 매도 신호를 여는 방법은 무엇입니까? 첫 번째 파란색 점으로 공개 매수 거래 및 첫 번째 빨간색 점으로 공개 매도 거래 정확한 손절매는 어디에 있습니까? 안전한 정지 손실은 첫 번째 점에 있을 수 있습니다(구매의 경우 첫 번째 파란색 점, 매도의 경우 첫 번째 빨간색 점) 올바른 이익실현은 어디에 있습니까? 이익실현은 손절매 거리와 RR에 따라 조정할 수 있으므로 내 제
    FREE
    Better Moving Average MT5
    Vincent Jose Proenca
    STRUCTURAL TREND LINES - MT4/MT5 Indicator Simple indicator that automatically draws trend lines based on market structure. Features: - 3 degrees of structure detection (short, medium, long term) - Configurable swing strength for each degree - Single color per degree for clean visualization - Adjustable number of lines per degree - Customizable colors and line widths How it works: The indicator identifies swing highs and lows based on the strength parameter, then connects these points to crea
    FREE
    Moving line
    Jun Chao Jiang
    The one minute chart has a bug, but the one-day chart can still be used after deleting the bug and reloading the indicators, This indicator can be used to determine how far the indicator goes up to place an order to buy, how far it goes down to place an order to sell, and not placing an order until it reaches this distance, which is considered oscillation, open an account gift index
    FREE
    Trendline mt5 indicator
    David Muriithi
    4 (2)
    Are you tired of drawing trendlines every time you're analyzing charts? Or perhaps you would like more consistency in your technical analysis. Then this is for you. This indicator will draw trend lines automatically when dropped on a chart. How it works Works similar to standard deviation channel found on mt4 and mt5. It has 2 parameters: 1. Starting Bar 2. Number of bars for calculation The   starting bar   is the bar which drawing of the trend lines will begin, while the   number of bars for c
    FREE
    Basic Vwap
    james mugendi
    4 (1)
    Simple Vwap with the daily, weekly and monthly VWAP is the abbreviation for   volume-weighted average price , which is a technical analysis tool that shows the ratio of an asset's price to its total trade volume. It provides traders and investors with a measure of the average price at which a stock is traded over a given period of time. How it's used Identify entry and exit points:   Traders can use VWAP to determine when to buy or sell an asset.   Understand price trends :  Traders can use V
    FREE
    Prometheus Analyst
    Humphrey Mangera
    PROMETHEUS TECHNICAN VERSION Free | By THE SONS A gift from The Sons — no strings, no trial, no expiry. Every trader deserves access to professional-grade market intelligence. That belief is why Prometheus Technical Version exists, and why it costs nothing. Consider it our handshake to the trading community. What You're Getting This is not a simplified tool dressed up as a gift. Prometheus Technican Version is a fully built, institutional-quality technical analysis indicator running a dual-model
    FREE
    VisualVol EURUSD
    Maxim Kuznetsov
    The indicator highlights the points that a professional trader sees in ordinary indicators. VisualVol visually displays different volatility indicators on a single scale and a common align. Highlights the excess of volume indicators in color. At the same time, Tick and Real Volume, Actual range, ATR, candle size and return (open-close difference) can be displayed. Thanks to VisualVol, you will see the market periods and the right time for different trading operations. This version is intended f
    FREE
    Mini Charts MTF EMA Mini Charts MTF EMA is a MetaTrader 5 indicator that displays multiple mini charts from selected timeframes directly on the main chart. It helps traders monitor multi-timeframe price movement and EMA direction in one clean visual layout. Main Features Multiple mini charts on the main chart Custom timeframe selection for each mini chart Up to 4 EMA lines for every mini chart Custom EMA period, shift, method, applied price, color, style, and width Custom mini chart width, heigh
    FREE
    Caicai L&S Yield Histogram Important Notice: This indicator is an integral tool of the automated EA Caicai Long and Short Pair Trading . This indicator visually displays the percentage deviation (Yield %) of a pair's current spread relative to its own historical mean. It is an excellent tool for quickly visualizing the gross financial potential of a market distortion in Long & Short operations. Main Features: Percentage Visualization: Understand the size of the distortion in palpable percentage
    LT Donchian Channel
    Thiago Duarte
    4.86 (7)
    Donchian Channel is an indicator created by Richard Donchian. It is formed by taking the highest high and the lowest low of the last specified period in candles. The area between high and low is the channel for the chosen period. Its configuration is simple. It is possible to have the average between the upper and lower lines, plus you have alerts when price hits one side. If you have any questions or find any bugs, please contact me. Enjoy!
    FREE
    FlatBreakout MT5
    Aleksei Vorontsov
    FlatBreakout MT5 (Free Version) Flat Range Detector and Breakout Panel for MT5 — GBPUSD Only FlatBreakout MT5   is the free version of the professional FlatBreakoutPro MT5 indicator, specially designed for flat (range) detection and breakout signals on the   GBPUSD   pair only. Perfect for traders who want to experience the unique fractal logic of FlatBreakout MT5 and test breakout signals on a live market without limitations. Who Is This Product For? For traders who prefer to trade breakout of
    FREE
    Girassol Sunflower MT5 Indicator
    Saullo De Oliveira Pacheco
    3.86 (7)
    This is the famous Sunflower indicator for Metatrader5. This indicator marks possible tops and bottoms on price charts. The indicator identifies tops and bottoms in the asset's price history, keep in mind that the current sunflower of the last candle repaints, as it is not possible to identify a top until the market reverses and it is also not possible to identify a bottom without the market stop falling and start rising. If you are looking for a professional programmer for Metatrader5, please
    FREE
    Macro-R Pro Signal — Advanced Trading Signal Indicator Macro-R Pro Signal is a professional trading indicator designed to deliver high-quality BUY and SELL signals with enhanced precision and reduced market noise. By combining Bollinger Bands, RSI, and adaptive volatility filtering , this indicator helps traders identify high-probability reversal points while avoiding unfavorable market conditions. How the Strategy Works This indicator is built on a mean reversion + momentum confirmation concep
    FREE
    Value Chart Candlesticks
    Flavio Javier Jarabeck
    4.69 (13)
    The idea of a Value Chart indicator was presented in the very good book I read back in 2020 , " Dynamic Trading Indicators: Winning with Value Charts and Price Action Profile ", from the authors Mark Helweg and David Stendahl. The idea is simple and the result is pure genius: Present candlestick Price analysis in a detrended way! HOW TO READ THIS INDICATOR Look for Overbought and Oversold levels. Of course, you will need to test the settings a lot to find the "correct" one for your approach. It
    FREE
    VFI Quantum
    Nikita Berdnikov
    5 (1)
    Introducing VFI (Volume Flow Indicator) – a trading indicator that analyzes the relationship between volume and price movement to identify key trading opportunities. The indicator displays the strength and direction of volume flow, providing clear signals about potential entry and exit points. Signals are formed based on zero line crossovers, crossovers between the VFI line and its exponential moving average (EMA), and when the indicator exits overbought and oversold zones. Attention! This stra
    FREE
    Donchian Pro
    Paulo Henrique Faquineli Garcia
    4.75 (4)
    The Donchian Channel Channels are among the most popular tools of technical analysis, as they visually convey to the analyst the limits within which most price movement tends to occur. Channel users know that valuable information can be obtained at any time, whether prices are in the central region of a band or close to one of the border lines. One of the best known techniques to explore these concepts is Bollinger Bands. However, John Bollinger was not the only one to research the application
    FREE
    이 제품의 구매자들이 또한 구매함
    SuperScalp Pro
    Van Minh Nguyen
    4.59 (22)
    SuperScalp Pro – 고급 멀티 필터 스캘핑 지표 시스템 SuperScalp Pro는 클래식 Supertrend와 여러 지능형 확인 필터를 결합한 고급 스캘핑 지표로, 거래 기회를 식별하는 데 도움을 줍니다. M1부터 H4까지 다양한 시간대에서 효율적으로 작동하며, XAUUSD, BTCUSD 및 주요 Forex 통화쌍에 최적화되어 있습니다. 이 지표는 명확한 매수 및 매도 신호를 제공하며, ATR 기반으로 진입가, 손절가, 익절가를 자동 계산하여 보다 효과적인 리스크 관리를 지원합니다. Fibonacci Take Profit 기능은 중요한 가격 구간에서 더 빠르게 포지션을 청산할 수 있도록 하며, 해당 수준 도달 시 알림을 전송합니다. 기본 설정은 Fibonacci Take Profit이 활성화된 상태로 최적화되어 있으며, 보다 안정적이고 일관된 거래 경험에 중점을 둡니다. 차트에 적용하는 것만으로 즉시 사용할 수 있습니다. 고급 사용자를 위해 모든 파라미터는 자유롭게 사용
    Entry In The Zone and SMC Multi Timeframe is a real-time 2-in-1 market analysis tool that combines market structure analysis and a No Repaint BUY / SELL signal system into a single indicator, built on Smart Money Concepts (SMC) — a widely adopted framework used by professional traders to understand market structure. This indicator helps you see the market more clearly, make decisions based on structure rather than guesswork, and focus on high-probability zones where price is more likely to react
    Divergence Bomber
    Ihor Otkydach
    4.9 (87)
    이 지표를 구매하신 분께는 다음과 같은 혜택이 무료로 제공됩니다: 각 거래를 자동으로 관리하고, 손절/익절 수준을 설정하며, 전략 규칙에 따라 거래를 종료하는 전용 도우미 툴 "Bomber Utility" 다양한 자산에 맞게 지표를 설정할 수 있는 셋업 파일(Set Files) "최소 위험", "균형 잡힌 위험", "관망 전략" 모드로 설정 가능한 Bomber Utility의 셋업 파일 이 전략을 빠르게 설치, 설정, 시작할 수 있도록 돕는 단계별 영상 매뉴얼 주의: 위의 모든 보너스를 받기 위해서는 MQL5 개인 메시지 시스템을 통해 판매자에게 연락해 주세요. 독창적인 커스텀 지표인 “Divergence Bomber(다이버전스 봄버)”를 소개합니다. 이 지표는 MACD 다이버전스(괴리) 전략을 기반으로 한 올인원(All-in-One) 거래 시스템입니다. 이 기술 지표의 주요 목적은 가격과 MACD 지표 간의 다이버전스를 감지하고, **향후 가격이 어느 방향으로 움직일지를 알려주는
    Power Candles MT5
    Daniel Stein
    5 (8)
    Power Candles V3 - 자체 최적화 강도 지표 파워 캔들 V3는 적용된 모든 차트에서 통화 및 상품의 강세를 실행 가능한 거래 계획으로 전환합니다. 단순히 캔들에 색상을 입히는 대신, 백그라운드에서 실시간 자동 최적화를 수행하여 현재 보고 있는 종목에 대한 최적의 손절매, 익절 및 신호 임계값을 제공합니다. 한 번의 클릭으로 실시간 거래에 적용할 수 있으며, 진입점, 손절매 및 익절 선이 정확한 가격에 맞춰 차트에 표시되고, 방향과 함께 알림이 발령됩니다. 이 도구는 Stein Investments 에코시스템의 일부입니다. 18개 이상의 도구와 함께 당신의 1대1 AI 트레이딩 멘토 Max.  항상 대기 중, 모든 인디케이터를 깊이 있게 이해, 무언가를 차근차근 생각해보고 싶은 순간에 도움을 줍니다.  https://stein.investments 에서 만나보세요 매 종가 바마다 3,000회 이상의 트레이딩 시뮬레이션. 9가지 강도 상태. 2가지 전략을 병렬로 테스트.
    SignalTech MT5
    Yue Wang
    5 (11)
    SignalTech MT5 is a trading system for EURUSD, USDCHF, USDJPY, AUDUSD, NZDUSD, EURJPY, AUDJPY, NZDJPY, CADJPY H2 and H3 Timeframe.  It can generate signals with Buy/Sell Arrows and Pop-Up/Sound Alerts. Each signal has clear Entry and Stop Loss levels, which should be automatically flagged on the chart, as well as potential Targets 1, 2, and 3. The Entry and TP levels are fixed after the trade is taken. The exit level is dynamic. If there are signs of a potential short-term trend reversal, the
    Grabber System MT5
    Ihor Otkydach
    4.83 (23)
    탁월한 기술적 지표인 Grabber를 소개합니다. 이 도구는 즉시 사용 가능한 “올인원(All-Inclusive)” 트레이딩 전략으로 작동합니다. 하나의 코드 안에 강력한 시장 기술 분석 도구, 매매 신호(화살표), 알림 기능, 푸시 알림이 통합되어 있습니다. 이 인디케이터를 구매하신 모든 분들께는 다음의 항목이 무료로 제공됩니다: Grabber 유틸리티: 오픈 포지션을 자동으로 관리하는 도구 단계별 영상 매뉴얼: 설치, 설정, 그리고 실제 거래 방법을 안내 맞춤형 세트 파일: 인디케이터를 빠르게 자동 설정하여 최고의 성과를 낼 수 있도록 도와줍니다 다른 전략은 이제 잊어버리세요! Grabber만이 여러분을 새로운 트레이딩의 정점으로 이끌어 줄 수 있습니다. Grabber 전략의 주요 특징: 거래 시간 프레임: M5부터 H4까지 거래 가능한 자산: 어떤 자산이든 사용 가능하지만, 제가 직접 테스트한 종목들을 추천드립니다 (GBPUSD, GBPCAD, GBPCHF, AUDCAD, AU
    FX Trend MT5 NG
    Daniel Stein
    5 (4)
    FX Trend NG: 차세대 멀티 마켓 트렌드 인텔리전스 개요 FX Trend NG 는 다중 시간 프레임 기반의 전문 트렌드 분석 및 시장 모니터링 도구입니다. 몇 초 만에 전체 시장 구조를 파악할 수 있도록 설계되었습니다. 여러 차트를 일일이 전환할 필요 없이, 어떤 종목이 추세에 있는지, 어디에서 모멘텀이 약화되고 있는지, 그리고 어떤 시간 프레임이 서로 정렬되어 있는지 즉시 확인할 수 있습니다. 출시 기념 특별 혜택 – FX Trend NG 를 $30 (6개월) 또는 $80 평생 라이선스 로 이용할 수 있습니다. 이미 Stein Investments 고객이신가요? -> 메시지를 보내 전용 고객 그룹에 참여하세요. 설정이나 사용 방법이 필요하신가요? -> Stein Investments 공식 페이지 를 방문하세요. 1. FX Trend NG가 특별한 이유 3단계 추세 로직 – 단순한 Buy / Sell이 아닙니다 • 대부분의 지표는 Buy 또는 Sell 두 가지 상태만 제
    이 지표를 구매하면 제 프로페셔널 트레이드 매니저를 무료로 드립니다. 우선 이 거래 시스템이 리페인팅, 리드로잉 및 레이그 인디케이터가 아니라는 점을 강조하는 것이 중요합니다. 이는 수동 및 로봇 거래 모두에 이상적인 것으로 만듭니다. 온라인 강좌, 설명서 및 프리셋 다운로드. "스마트 트렌드 트레이딩 시스템 MT5"은 새로운 및 경험이 풍부한 트레이더를 위해 맞춤형으로 제작된 종합적인 거래 솔루션입니다. 10개 이상의 프리미엄 인디케이터를 결합하고 7개 이상의 견고한 거래 전략을 특징으로 하여 다양한 시장 조건에 대한 다목적 선택이 가능합니다. 트렌드 추종 전략: 효과적인 트렌드 추이를 타기 위한 정확한 진입 및 손절 관리를 제공합니다. 반전 전략: 잠재적인 트렌드 반전을 식별하여 트레이더가 범위 시장을 활용할 수 있게 합니다. 스캘핑 전략: 빠르고 정확한 데이 트레이딩 및 단기 거래를 위해 설계되었습니다. 안정성: 모든 인디케이터가 리페인팅, 리드로잉 및 레이그가 아니므로 신뢰
    Btmm state engine pro
    Garry James Goodchild
    5 (4)
    BTMM State Engine Pro is a MetaTrader 5 indicator for traders who use the Beat The Market Maker approach: Asian session context, kill zone timing, level progression, peak formation detection, and a multi-pair scanner from a single chart. It combines cycle state logic with a built-in scanner dashboard so you do not need the same tool on many charts at once. What it does Draws the Asian session range; session times can follow broker server offset or be set in inputs. Tracks level progression (L
    Gann Made Easy MT5
    Oleg Rodin
    5 (3)
    Gann Made Easy 는 mr.의 이론을 사용하여 최고의 거래 원칙을 기반으로 하는 전문적이고 사용하기 쉬운 Forex 거래 시스템입니다. W.D. 간. 이 표시기는 Stop Loss 및 Take Profit Levels를 포함하여 정확한 BUY 및 SELL 신호를 제공합니다. PUSH 알림을 사용하여 이동 중에도 거래할 수 있습니다. 구매 후 거래 방법 안내 및 유용한 추가 지표를 무료로 받으시려면 저에게 연락주세요! 아마도 Gann 거래 방법에 대해 이미 여러 번 들었을 것입니다. 일반적으로 Gann의 이론은 초보자 거래자뿐만 아니라 이미 거래 경험이 있는 사람들에게도 매우 복잡한 것입니다. Gann의 거래 방식은 이론적으로 적용하기 쉽지 않기 때문입니다. 나는 그 지식을 연마하고 Forex 지표에 최고의 원칙을 적용하기 위해 몇 년을 보냈습니다. 표시기는 적용하기가 매우 쉽습니다. 차트에 첨부하고 간단한 거래 권장 사항을 따르기만 하면 됩니다. 지표는 지속적으로 시장 분석
    Quantum TrendPulse
    Bogdan Ion Puscasu
    5 (23)
    SuperTrend   ,   RSI   ,   Stochastic   의 힘을 하나의 포괄적인 지표로 결합하여 트레이딩 잠재력을 극대화하는 궁극의 트레이딩 도구   인 Quantum TrendPulse를   소개합니다. 정밀성과 효율성을 추구하는 트레이더를 위해 설계된 이 지표는 시장 추세, 모멘텀 변화, 최적의 진입 및 종료 지점을 자신 있게 식별하는 데 도움이 됩니다. 주요 특징: SuperTrend 통합:   주요 시장 추세를 쉽게 따라가고 수익성의 물결을 타세요. RSI 정밀도:   매수 과다 및 매도 과다 수준을 감지하여 시장 반전 시점을 파악하는 데 적합하며 SuperTrend 필터로 사용 가능 확률적 정확도:   변동성이 큰 시장에서 숨겨진 기회를 찾기 위해 확률적 진동   을 활용하고 SuperTrend의 필터로 사용 다중 시간대 분석:   M5부터 H1 또는 H4까지 다양한 시간대에 걸쳐 시장을 최신 상태로 유지하세요. 맞춤형 알림:   맞춤형 거래 조건이 충족되면
    Trend Screener Pro MT5
    STE S.S.COMPANY
    4.85 (104)
    트렌드 표시기, 트렌드 트레이딩 및 필터링을 위한 획기적인 고유 솔루션, 하나의 도구 안에 내장된 모든 중요한 트렌드 기능! Forex, 상품, 암호 화폐, 지수 및 주식과 같은 모든 기호/도구에 사용할 수 있는 100% 다시 칠하지 않는 다중 시간 프레임 및 다중 통화 표시기입니다. Trend Screener는 차트에 점이 있는 화살표 추세 신호를 제공하는 효율적인 지표 추세 추종 지표입니다. 추세 분석기 표시기에서 사용할 수 있는 기능: 1. 트렌드 스캐너. 2. 최대 이익 분석이 있는 추세선. 3. 추세 통화 강도 측정기. 4. 경고가 있는 추세 반전 점. 5. 경고가 있는 강력한 추세 점. 6. 추세 화살표 Trend Screener Indicator가 있는 일일 분석 예, 일일 신호 성능...등은 여기에서 찾을 수 있습니다. 여기를 클릭하십시오. LIMITED TIME OFFER : Trend Screener Indicator는 50$ 및 평생 동안만 사용할 수 있습니다.
    소개       Quantum Breakout PRO   , 브레이크아웃 존 거래 방식을 변화시키는 획기적인 MQL5 지표! 13년 이상의 거래 경험을 가진 숙련된 트레이더 팀이 개발한       퀀텀 브레이크아웃 PRO       혁신적이고 역동적인 브레이크아웃 존 전략으로 거래 여정을 새로운 차원으로 끌어올리도록 설계되었습니다. Quantum Breakout Indicator는 5개의 이익 목표 영역이 있는 브레이크아웃 영역의 신호 화살표와 브레이크아웃 상자를 기반으로 한 손절 제안을 제공합니다. 초보자 거래자와 전문 거래자 모두에게 적합합니다. Quantum EA 채널:       여기를 클릭하세요 중요한! 구매 후 설치 매뉴얼을 받으려면 개인 메시지를 보내주십시오. 추천: 기간: M15 통화쌍: GBPJPY, EURJPY, USDJPY,NZDUSD, XAUUSD 계정 유형: 스프레드가 매우 낮은 ECN, Raw 또는 Razor 브로커 시간: GMT +3 중개인 :
    Atomic Analyst MT5
    Issam Kassas
    3.94 (31)
    우선적으로 언급할 점은이 거래 지표가 다시 그리지 않고 지연되지 않으며 이를 통해 수동 및 로봇 거래 모두에 이상적이라는 점입니다. 사용자 매뉴얼: 설정, 입력 및 전략. Atomic Analyst는 가격의 강도와 모멘텀을 활용하여 시장에서 더 나은 이점을 찾는 PA Price Action Indicator입니다. 고급 필터를 장착하여 잡음과 거짓 신호를 제거하고 거래 잠재력을 높이는 데 도움이 됩니다. 복잡한 지표의 다중 레이어를 사용하여 Atomic Analyst는 차트를 스캔하고 복잡한 수학적 계산을 간단한 신호와 색상으로 변환하여 초보 트레이더가 이해하고 일관된 거래 결정을 내릴 수 있도록합니다. "Atomic Analyst"는 새로운 및 경험이 풍부한 트레이더를위한 종합적인 거래 솔루션입니다. 프리미엄 지표와 최고 수준의 기능을 하나의 거래 전략에 결합하여 모든 종류의 트레이더에 대한 다재다능한 선택지가되었습니다. 인트라데이 거래 및 스캘핑 전략 : 빠르고 정확한 일일
    OmniSync Projection
    Antonio-alin Teculescu
    5 (1)
    Chronos Fractal Engine is an innovative price projection indicator for MetaTrader 5, designed to transform your technical analysis by intelligently identifying and projecting historical price patterns. Built upon an advanced correlation algorithm and the fractal principles of the market, this powerful tool visualizes potential future price movements, giving you a unique edge in your trading decisions. What is Chronos Fractal Engine? At its core, the Chronos Fractal Engine employs a sophisticat
    Basic Harmonic Patterns Dashboard MT5
    Mehran Sepah Mansoor
    4.36 (11)
    이 대시보드는 선택한 심볼에 대해 사용 가능한 최신 고조파 패턴을 표시하므로 시간을 절약하고 더 효율적으로 사용할 수 있습니다 /   MT4 버전 . 무료 인디케이터:   Basic Harmonic Pattern 인디케이터 열 Symbol :   선택한 심볼이 나타납니다 Trend :   강세 또는 약세 Pattern :   패턴 유형(가틀리, 나비, 박쥐, 게, 상어, 사이퍼 또는 ABCD) Entry :   진입 가격 SL:   스톱로스 가격 TP1:   1차 테이크프로핏 가격 TP2:   2차 테이크프로핏 가격 TP3:   3차 테이크프로핏 가격 Current price:   현재 가격 Age (in bars):   마지막으로 그려진 패턴의 나이 주요 입력 Symbols :   "28개 주요 통화쌍" 또는 "선택한 심볼" 중에서 선택합니다. Selected Symbols :   쉼표로 구분하여 모니터링하려는 원하는 심볼("EURUSD,GBPUSD,XAUUSD")을 선택
    FX Levels MT5
    Daniel Stein
    5 (13)
    FX Levels: 모든 시장을 위한 뛰어난 정확도의 지지와 저항 간단 요약 통화쌍, 지수, 주식, 원자재 등 어떤 시장이든 믿을 만한 지지·저항 레벨을 찾고 싶나요? FX Levels 는 전통적인 “Lighthouse” 기법과 첨단 동적 접근을 결합해, 거의 보편적인 정확성을 제공합니다. 실제 브로커 경험을 반영하고, 자동화된 일별 업데이트와 실시간 업데이트를 결합함으로써 FX Levels 는 가격 반전 포인트를 파악하고, 수익 목표를 설정하며, 자신 있게 트레이드를 관리할 수 있게 돕습니다. 지금 바로 시도해 보세요—정교한 지지/저항 분석이 어떻게 여러분의 트레이딩을 한 단계 끌어올릴 수 있는지 직접 확인하세요! 1. FX Levels가 트레이더에게 매우 유용한 이유 뛰어난 정확도의 지지·저항 존 • FX Levels 는 다양한 브로커 환경에서도 거의 동일한 존을 생성하도록 설계되어, 데이터 피드나 시간 설정 차이로 인한 불일치를 해소합니다. • 즉, 어떤 브로커를 사용하
    Azimuth Pro
    Ottaviano De Cicco
    5 (7)
    Azimuth Pro V2: Synthetic Fractal Structure and Confirmed Entries for MT5 Overview Azimuth Pro is a multi-level swing structure indicator by Merkava Labs . Four nested swing layers, swing-anchored VWAP, ABC pattern detection, three-timeframe structural filtering, and closed-bar confirmed entries — one chart, one workflow from micro-swings to macro-cycles. This is not a blind signal product. It is a structure-first workflow for traders who care about location, context, and timing. V2 Launch Offe
    우선적으로, 이 거래 도구는 전문적인 거래에 이상적인 비-다시 그리기 및 지연되지 않는 지표입니다.  온라인 강좌, 사용자 매뉴얼 및 데모. 스마트 가격 액션 컨셉트 인디케이터는 신규 및 경험 많은 트레이더 모두에게 매우 강력한 도구입니다. Inner Circle Trader Analysis 및 Smart Money Concepts Trading Strategies와 같은 고급 거래 아이디어를 결합하여 20가지 이상의 유용한 지표를 하나로 결합합니다. 이 인디케이터는 스마트 머니 컨셉트에 중점을 두어 대형 기관의 거래 방식을 제공하고 이동을 예측하는 데 도움을 줍니다.  특히 유동성 분석에 뛰어나 기관이 어떻게 거래하는지 이해하는 데 도움을 줍니다. 시장 트렌드를 예측하고 가격 변동을 신중하게 분석하는 데 탁월합니다. 귀하의 거래를 기관 전략에 맞추어 시장의 동향에 대해 더 정확한 예측을 할 수 있습니다. 이 인디케이터는 시장 구조를 분석하고 중요한 주문 블록을 식별하고 다양
    RelicusRoad Pro MT5
    Relicus LLC
    5 (24)
    RelicusRoad Pro: 퀀트 시장 운영 체제 70% 할인 평생 이용권 (한정 시간) - 2,000명 이상의 트레이더와 함께하세요 왜 대부분의 트레이더는 "완벽한" 지표를 가지고도 실패할까요? 진공 상태에서 단일 개념 만으로 거래하기 때문입니다. 문맥 없는 신호는 도박입니다. 지속적인 승리를 위해서는 컨플루언스(중첩) 가 필요합니다. RelicusRoad Pro는 단순한 화살표 지표가 아닙니다. 완전한 퀀트 시장 생태계 입니다. 독점적인 변동성 모델링을 사용하여 가격이 이동하는 "공정 가치 로드"를 매핑하고, 단순 노이즈와 실제 구조적 돌파를 구분합니다. 추측은 그만두세요. 기관급 로드 로직으로 거래를 시작하세요. 핵심 엔진: "Road" 알고리즘 시스템의 중심에는 시장 상황에 실시간으로 적응하는 동적 변동성 채널인 Road Algo 가 있습니다. 세이프 라인(평형) 과 가격이 수학적으로 반전될 가능성이 높은 확장 레벨 을 투영합니다. Simple Road: 일반적인 시장을 위
    SMC Intraday Formula
    Kareem Abbas
    5 (4)
    먼저 솔직하게 말하겠습니다. 어떤 인디케이터도 단독으로 당신을 수익성 있게 만들어주지 않습니다. 누군가 그렇게 말한다면, 그는 당신에게 꿈을 파는 것입니다. 완벽한 매수/매도 화살표를 보여주는 모든 인디케이터는 완벽하게 보이도록 만들 수 있습니다 — 단지 올바른 과거 구간을 확대하고 승리한 거래만 캡처하면 됩니다. 우리는 그렇게 하지 않습니다.  SMC Intraday Formula는 도구입니다. 시장 구조를 읽고, 가장 높은 확률의 가격 구간을 표시하며, 현재 스마트 머니의 흐름이 어떻게 보이는지 아주 단순한 언어로 보여줍니다. 최종 결정은 여전히 당신이 합니다. 실행도 당신이 합니다. 하지만 이제는 희망이 아니라 정확성으로 거래하게 됩니다. 우리는 이 인디케이터를 지난 약 3년 동안 골드(XAUUSD) 및 주요 외환 통화쌍의 데이 트레이딩 스캘핑에 사용해 왔습니다. M1, M5, M15, M30에서 우리의 핵심 도구입니다. 이 도구는 미래를 예측하려 하지 않습니다 — 지금 형성
    Trend indicator AI mt5
    Ramil Minniakhmetov
    5 (17)
    트렌드 인공 지능 지표는 실행 가능한 진입 점 및 반전 경고와 추세 식별을 결합하여 상인의 시장 분석을 향상시킬 훌륭한 도구입니다. 이 표시기는 사용자가 자신감과 정밀도로 외환 시장의 복잡성을 탐색 할 수 있도록 지원합니다 기본 신호 외에도 트렌드 인공 지능 지표는 풀백 또는 되돌림 중에 발생하는 2 차 진입 점을 식별하여 거래자가 기존 트렌드 내에서 가격 수정을 활용할 수 있도록합니다. 중요한 장점: ·작동 4 및 5 *명확한 구매 또는 판매 신호 *다시 칠하지 않습니다 *모든 자산에서 작동 나는 전보 사기에 개 또는 세트를 판매하지 않도록주의. 모든 설정은 블로그에 여기에 무료.  중요! 지침 및 보너스를 얻기 위해 구입 후 즉시 저에게 연락! 진짜 가동 감시는 뿐 아니라 나의 다른 제품 여기에서 찾아낼 수 있습니다: https://www.mql5.com/en/users/mechanic/seller&nbsp ; 설정 및 입력: 모든 자산에 대해 기본 설정을 권
    Entry Points Pro for MT5
    Yury Orlov
    4.48 (138)
    다시 색을 칠하지 않고 거래에 진입할 수 있는 정확한 신호를 제공하는 MT5용 지표입니다. 외환, 암호화폐, 금속, 주식, 지수 등 모든 금융 자산에 적용할 수 있습니다. 매우 정확한 추정값을 제공하고 매수와 매도의 가장 좋은 시점을 알려줍니다. 하나의 시그널로 수익을 내는 지표의 예와 함께 비디오 (6:22)시청하십시오! 대부분의 거래자는 Entry Points Pro 지표의 도움으로 첫 거래 주 동안 트레이딩 결과를 개선합니다. 저희의   Telegram Group 을 구독하세요! Entry Points Pro 지표의 좋은점. 재도색이 없는 진입 신호 신호가 나타나고 확인되면(시그널 캔들이 완성된 경우) 신호는 더 이상 사라지지 않습니다. 여타 보조지표의 경우 신호를 표시한 다음 제거되기 때문에 큰 재정적 손실로 이어집니다. 오류 없는 거래 게시 알고리즘을 통해 트레이드(진입 또는 청산)를 할 이상적인 순간을 찾을 수 있으며, 이를 통해 이를 사용하는 모든 거래자의 성공률이
    Market Structure Order Block Dashboard MT5는 시장 구조와 주요 가격 반응 구역을 차트에서 직접 읽고자 하는 트레이더를 위해 설계된 MT5 지표입니다. BOS, ChoCH, 오더 블록, Fair Value Gap (FVG), 유동성, Kill Zones, Volume Profile 그리고 빠른 분석을 위한 콤팩트한 대시보드를 결합합니다. 이 지표는 시장 구조, ICT 및 Smart Money 개념을 의사결정 프레임워크로 사용하는 트레이더를 대상으로 합니다. 추세 지속, 가능한 반전, 가격 불균형, 유동성 타겟 및 관심 구역을 보다 체계적으로 식별하는 데 도움을 줄 수 있습니다. 구매자를 위한 포함 리소스 구매 후 MQL5 개인 메시지로 요청하시면 완전한 PDF 사용 설명서와 파라미터 설정 팁을 제공해 드립니다. MQL5 개인 메시지를 통한 직접 기술 지원. 1.20 버전은 두 가지 주요 추가 기능을 제공합니다: Pending BOS / Pending
    Smart Stop Indicator – 차트 위에서 직접 작동하는 지능형 스톱로스 시스템 개요 Smart Stop Indicator는 감이나 추측이 아닌 명확하고 체계적인 방식으로 스톱로스를 설정하고 싶은 트레이더를 위한 맞춤형 솔루션입니다. 이 도구는 클래식 프라이스 액션 논리(고점, 저점 구조)와 현대적인 브레이크아웃 인식을 결합하여 실제로 가장 논리적인 다음 스톱 레벨을 정확히 식별합니다. 추세, 박스권, 빠른 브레이크아웃 상황 등 어떤 시장에서도 인디케이터는 최적의 SL 구역과 상태(“new”, “broken”, “valid”)를 차트에 직접 표시합니다. 새로운 기능으로 SL 거리의 %ADR 표시가 추가되었습니다. 핵심 기능 자동 시장구조 기반 스톱 설정 • 시장 구조와 실시간 가격 움직임을 기반으로 의미 있는 스톱로스 레벨을 자동으로 탐지합니다. 스마트 브레이크아웃 감지 • 빠른 방향 변화나 돌파 상황에서도 불필요한 조기 스톱 조정을 강요하지 않으며 유연하게 반응합
    Crystal Heikin Ashi Signals
    Muhammad Jawad Shabir
    5 (2)
    Crystal Heikin Ashi Signals - Professional Trend & Signal Detection Indicator Advanced Heikin Ashi Visualization with Intelligent Signal System for Manual & Automated Trading Final Price: $149 ---------> Price goes up $10 after every 10 sales . Limited slots available — act fast . Overview Crystal Heikin Ashi Signals is a professional-grade MetaTrader 5 indicator that combines pure Heikin Ashi candle visualization with an advanced momentum-shift detection system. Designed for both manual traders
    Bill Williams Advanced
    Siarhei Vashchylka
    5 (11)
    Bill Williams Advanced is designed for automatic chart analysis using Bill Williams' "Profitunity" system. The indicator analyzes four timeframes at once. Manual (Be sure to read before purchasing) Advantages 1. Analyzes the chart using Bill Williams' "Profitunity" system. Signals are displayed in a table in the corner of the screen and on the price chart. 2. Finds all known AO and AC signals, as well as zone signals. Equipped with a trend filter based on the Alligator. 3. Finds "Divergence Bar
    ARICoins
    Temirlan Kdyrkhan
    ARICoin is a powerful trading companion designed to generate high-probability entry signals with dynamic TP/SL/DP levels based on volatility. Built-in performance tracking shows win/loss stats, PP1/PP2 hits, and success rates all updated live. Key Features: Buy/Sell signals with adaptive volatility bands Real-time TP/SL/DP levels based on ATR Built-in MA Filter with optional ATR/StdDev volatility Performance stats panel (Success, Profit/Loss, PP1/PP2) Alerts via popup, sound, push, or email Cust
    Market Structure Patterns
    Samuel Manoel De Souza
    4.47 (19)
    Market Structure Patterns   is an indicator based on   smart money concepts   that displays   SMC/ICT   elements that can take your trading decisions to the next level. Take advantage of the   alerts ,   push notifications   and   email messages   to keep informed from when an element is formed on the chart, the price crosses a level and/or enters in a box/zone. Developers can access the values of the elements of the indicator using the   global variables  what allows the automation of trading
    IX Power MT5
    Daniel Stein
    4.92 (13)
    IX Power: 지수, 원자재, 암호화폐 및 외환 시장 통찰력을 발견하세요 개요 IX Power 는 지수, 원자재, 암호화폐 및 외환 시장의 강도를 분석할 수 있는 다목적 도구입니다. FX Power 는 모든 가용 통화 쌍 데이터를 사용하여 외환 쌍에 대해 가장 높은 정확도를 제공하는 반면, IX Power 는 기초 자산 시장 데이터에만 초점을 맞춥니다. 이로 인해 IX Power 는 비외환 시장에 이상적이며, 다중 쌍 분석이 필요하지 않은 간단한 외환 분석에도 신뢰할 수 있는 도구입니다. 모든 차트에서 매끄럽게 작동하며, 거래 결정을 향상시키기 위한 명확하고 실행 가능한 통찰력을 제공합니다. 1. IX Power가 트레이더에게 유용한 이유 다양한 시장 강도 분석 • IX Power 는 지수, 원자재, 암호화폐 및 외환 심볼의 강도를 계산하여 각 시장에 맞는 통찰력을 제공합니다. • US30, WTI, 금, 비트코인 또는 통화 쌍과 같은 자산을 모니터링하여 거래 기회를 발견
    제작자의 제품 더 보기
    HFTHackerMT5
    Thomas Bradley Butler
    5 (2)
    테스트 및 사용 전에 EA를 최적화하세요. 최적화한 경우에만 구매하세요. 이 EA는 최적화 방법을 알고 스스로 수익을 창출하고자 하는 트레이더를 위한 것입니다. 위험 매개변수를 직접 설정하세요. 높은 승률과 함께, 원하는 대로 작동하지 않는 거래에 대한 손절매가 가능합니다. 장기적인 관점에서 위험을 줄이세요. 모든 계정에 적용 가능하며 위험 관리 도구입니다. 모든 댓글, 설명, 블로그를 꼭 읽어보세요. MT4 버전: https://www.mql5.com/en/market/product/73834 이 전문가 자문(EA)은 각 포지션에 대해 고정된 랏 크기를 사용하여 매매 거래를 자동화합니다. AI를 사용하지 않으며, 수년 전에 개발되었으며, 수십억 달러에 달하는 화려한 수익 백테스트 조작이 아닌 건전한 원칙에 기반합니다. 핵심 기능은 계좌 잔액에 관계없이 일관된 거래 규모를 유지하여 트레이더가 거래별 위험을 완벽하게 통제할 수 있도록 하는 것입니다. 이러한 접근 방식은 계좌 규모나
    Black Gold M1
    Thomas Bradley Butler
    OPTIMIZE BEFORE BACKTEST AND USE Trade crude oil with this EA.  No EA turns hundreds into millions in a year or 2, This is a lie if presented this way.  Black Gold trades Brent Crude on 1 min charts.  It uses RSI, moving averages and directional indicators.  Try it out, load it onto the tester if you have the history and ability to trade Brent crude.    Adjust and optimize to get the most out of the expert advisor
    ForexReversal
    Thomas Bradley Butler
    4 (1)
    인내심은 스트레스 없는 스캘핑의 핵심입니다. 화살표가 200 이동 평균을 통과하는 것을 볼 때 거래하고 이동 평균 필터가 없는 마지막 스윙 포인트에서 확장하거나 추세를 만드십시오. 1분 시간 프레임에 적합하며 일중 움직임을 포착합니다. 후행 정지를 사용하여 쉽게 20핍을 가져오거나 더 큰 추세에 더 오래 머물 수 있습니다. 이 표시기에서 실제로 큰 거래의 사진에 있는 예를 보십시오. 1분의 시간 프레임이 가장 효과적입니다. 트렌드를 보려면 축소하십시오. 화살표는 다시 칠하거나 다시 계산하지 않습니다. 1분 시간 프레임에 연결하고 거래를 연구하고 전략에 사용할 수 있는지 확인하십시오. 나 규칙: 파란색 구매 레드 판매 옆 기간을 피하십시오 거래량이 많을 때 거래하고 모멘텀을 거래하십시오 손절매 사용 인내심은 스트레스 없는 스캘핑의 핵심입니다. 화살표가 200 이동 평균을 통과하는 것을 볼 때 거래하고 이동 평균 필터가 없는 마지막 스윙 포인트에서 확장하거나 추세를 만드십시오.
    NeuroScalper
    Thomas Bradley Butler
    5 (1)
    업데이트! 화살표가 100 및 200 레벨에 추가되었습니다. 이 지표는 극단적인 접근에 정확하고 주로 1분 기간 동안 매수 포지션을 지원합니다. 다른 시간 프레임을 사용할 수 있지만 수준이 다릅니다. 더 나은 오실레이터이며 차이점을 확인하기 위해 다른 오실레이터와 비교합니다. 신경망 개념을 사용한 데이 트레이드. 이 지표는 기본 형태의 신경망을 사용하여 구매 및 판매 신호를 생성합니다. 1분 차트에서 지표를 사용하십시오. 표시기는 다시 칠하지 않습니다. 1분 차트 또는 다른 레벨을 사용하는 다른 차트를 사용하여 테스터에서 다운로드하여 실행하고 거래를 분석하여 직접 확인하십시오. 시장을 스캘핑할 수 있는 많은 기회. 더 높은 시간 프레임에 사용할 수 있지만 수준은 재량에 따라 변경해야 합니다. 더 높은 시간 프레임은 더 높은 범위를 갖습니다. 이 모델에서 고려해야 할 개념 및 사항: 다중 표시기가 사용되고 가중치가 적용되며 최대 및 최소에 대한 2개의 데이터 포인트가 사용됩니다.
    VolumeDayTrader
    Thomas Bradley Butler
    주식(CFD)에 대해서만 DAYTRADING. 거래에는 작업이 필요합니다. 모든 항목과 종료를 알려주는 바로 가기나 표시기는 없습니다. 이익은 마음의 상태에서 옵니다. 지표는 자금 관리 및 성공 심리학과 함께 사용되는 도구입니다. 볼륨 프로파일에서 불균형을 찾으십시오. 거래 가격 볼륨 불균형. 많은 불균형이 마감 및 공개 및 뉴스에서 발생합니다. 주식의 구매자 대 판매자를 참조하십시오. 5분에서 1시간 동안 사용하여 누가 가격을 통제하고 가격의 불균형을 찾을 수 있는지 확인합니다. 더 큰 주식은 15분 이상입니다. 이전 막대의 숫자를 보려면 색상 볼륨 막대 위로 마우스를 가져갑니다. 현재 막대 볼륨은 상단 모서리에 기록됩니다. 거래량의 불균형을 찾아 가격이 한동안 어떤 방향으로 갈지 확인하십시오. 최상의 결과를 위해 지배적인 경향을 따르십시오 추세가 발전하면 추세를 거래하십시오. 트레일링 스톱을 사용하고 큰 볼륨 반전 불균형을 주시하십시오.
    GoldBuyBackScalper
    Thomas Bradley Butler
    4 (1)
    이 표시는 XAU/USD, 1분 차트 전용입니다. 모든 쌍에는 고유한 특성과 가격 변동이 있습니다. 이 지표로 V자형 반전을 거래하십시오. 두피는 후행 정지를 사용하여 매수하고 뉴스는 더 극단적이고 갑작스러운 매도를 유발할 수 있으므로 뉴스를 피합니다. 백테스트에서 1분 시간 프레임에 연결하고 반전 매수를 확인합니다. 표시기는 다시 그리거나 다시 계산하지 않습니다. 활성 시간에만 거래 이 표시는 XAU/USD, 1분 차트 전용입니다. 모든 쌍에는 고유한 특성과 가격 변동이 있습니다. 이 지표로 V자형 반전을 거래하십시오. 두피는 후행 정지를 사용하여 매수하고 뉴스는 더 극단적이고 갑작스러운 매도를 유발할 수 있으므로 뉴스를 피합니다. 백테스트에서 1분 시간 프레임에 연결하고 반전 매수를 확인합니다. 표시기는 다시 그리거나 다시 계산하지 않습니다. 활성 시간에만 거래
    TrueSupplyandDemand
    Thomas Bradley Butler
    This is based on short term strength or weakness and not on moving averages.  Moving averages are used for filter only. Trade supply and demand with arrows. Supply and demand breakouts and strength of the buyers or sellers .  Don't trade buy arrow to sell arrow.  Trade the strength with trendlines or moving averages and use stops.  The arrow can have some strong moves.  Trade on all time frames.  Try it out in the back tester. The pips can be made with this indicator, follow the arrows and make
    ScalpingMaster
    Thomas Bradley Butler
    Master scalping with this indicator.  Trade on any time frame for scalps on buy or sells.  Follow trends using a 200 moving average and stops and targets.  Use with your own system.  This indicator can give pips if following it correctly.  Stick to rules and pick up pips daily.  Use as entries in a trend, scalp for a few pips or exit on opposite signal.  Best to follow higher time frame trends. Indicator doesn't repaint or recalculate. Rules: Don't trade overnight, only trade during active sessi
    DayTradeKing
    Thomas Bradley Butler
    This indicator is good for small time frames like 1 and 5 minutes and made for day trading. The indicator never repaints or recalculates. The indicator works is for trading swing points in day trading, following bulls or bears.  Its a simple to use, non cluttered indicator with a high success rate.  This indicator works well to capture ranges.  All indicators come with limitations and no indicator or system is always accurate. Use money management for long term trading success.   Place in backte
    DTKGold
    Thomas Bradley Butler
    This is the DayTradeKing for gold on a 1 minute time frame.  It is a different calculation for the range. Use a 200 period moving average as a filter.  Always use stops and avoid news, wait for more conformation.  This looks to capture intraday ranges. Put it in the back tester on 1 minute to see the price action and how it works. Trade with trend Use filter Use stops Alerts are added for pop ups and sound. 
    SuperArrowScalper
    Thomas Bradley Butler
    Trade trends with the Super Scalper Use on all time frames and assets it is  designed for scalping trends. Works good on small time frames for day trading.  The arrows are easy to follow.  This is a simple no repaint/no recalculate arrow indicator to follow trends with.  Use in conjunction with your own system or use moving averages.  Always use stops just below or above the last swing point or your own money management system The indicator comes with push notifications, sound alerts and email
    Levels Trading
    Thomas Bradley Butler
    This indicator is a simple stripped down version of any advanced support and resistance indicator.  All the support and resistance indicators work from a number of bars that have developed over time. Get rid of clutter and confusing levels.  Find levels according to a number of bars. Look at days, session, numbers of hours, periods of consolidation.  Watch levels develop and use as breakout points, or areas of buyers and sellers.  Features and things to consider This indicator is for a frame of
    ForexReversalEA
    Thomas Bradley Butler
    https://www.mql5.com/en/market/product/57345 이 EA는 Forex Reversal 지표를 기반으로 합니다. 시스템을 수동으로 거래하고 싶다면 지표를 다운로드하여 사용해 보십시오. EA는 추세를 따르고 그에 따라 포지션을 열 것입니다. 결과는 더 낮은 드로다운으로 안정적인 이득을 보여주지만 백 테스터, 옵티마이저 및 시간 프레임에서 실험하여 무엇이 작동하는지 확인하십시오. 표시된 모든 결과는 가상입니다. 참고: 이것은 마틴게일이나 그리드가 아닙니다. 지표에 헤지 기능이 있습니다. 이 EA에는 다음과 같은 기능이 있으며 위험에 따라 변경하십시오. EA는 무료 마진에 따라 추가하고 매개변수에 따라 구매 및 판매합니다. 입력을 통해 위험을 제어합니다. inp 5는 판매 inp 7은 구매 고정 스톱 로트 고정 이익실현   여유 마진의 %
    HFTHacker
    Thomas Bradley Butler
    최적화에 대한 사용자의 복잡성과 혼란으로 인해 복구 없이 간단한 버전으로 돌아갔습니다. 테스트 및 사용 전에 EA를 최적화하세요. 최적화한 경우에만 구매하세요. 최적화하는 방법을 알고 스스로 수익을 창출하고자 하는 트레이더를 위한 것입니다. 위험 매개변수를 설정합니다. 선택한 경우 작동하지 않는 거래에 대한 정지와 함께 높은 승률. 장수를 위해 위험을 줄입니다. 모든 계정에서 작동하며 위험 관리 도구입니다. 모든 의견, 설명 및 MT5 버전: https://www.mql5.com/en/market/product/74421 이 전문가 자문가(EA)는 트레이더의 계정 잔액에 따라 포지션 크기를 조정하는 동안 매수 및 매도 거래를 자동화합니다. 핵심 기능은 거래 크기를 동적으로 조정하여 계정이 늘어나거나 줄어들 때 위험이 사용 가능한 자본에 비례하도록 하는 것입니다. 이는 주어진 거래에서 과도한 레버리지 또는 너무 적은 위험을 감수하지 않고 일관된 거래 전략을 유지하는 데 도움이 됩
    MarketMaker
    Thomas Bradley Butler
    수요 공급 거래를 자동화합니다. 시장을 만드십시오. 이 EA는 모두가 판매하고 모방하는 인기 있는 수요 공급 지표에서 영감을 받아 만들어졌습니다. EA는 거래와 헤징을 계속하여 시장을 만듭니다. 비 헤징 계정에서도 거래할 수 있습니다. 위험을 평가하고 시간 프레임, 로트 크기, 헤징 기능을 사용해야 합니다. 나는 한 번에 여러 쌍을 껐다가 켜고 한 달에 걸쳐 그것을 거래했습니다. 시스템의 개념: EA는 수요와 공급 수준을 거래합니다. EA가 계속해서 새로운 레벨을 거래할 수 있도록 레벨이 변경됩니다. 더 낮은 로트를 가진 많은 쌍 사이에 분배하는 것은 시스템의 기능입니다. 꾸준한 이득을 유지하면서 큰 하락은 피해야 합니다. SL을 사용할 수 있지만 이것이 옵션이 될 수 있도록 내가 설명한 헷지된 측면입니다. 많은 쌍에 대해 작은 로트에서 얻는 손실은 4%이며 이것은 SL이 없는 것입니다. 더 큰 로트는 6%를 보여주고 있습니다. 따라서 크기가 작을수록 보수적이며 크면 공격적
    Top Trader
    Thomas Bradley Butler
    Top Trader Indicator This is an arrow reversal indicator. This is with deviations and arrows.  Trade a blue arrow for buy and trade a red arrow for sell.  Change the time period and the deviations of the bands.  This is similar to others but these arrows don't repaint.  Load in back tester and study which periods and deviations work the best.  It works on all time frames.  15 min to 1 hr would give good results for take profits.  Try according to your own risk management.
    Quant Bot
    Thomas Bradley Butler
    Quant Bot은 EUR/USD에 대한 1시간 프레임의 추세 거래를 위한 것입니다. 설정된 파일은 없지만 다른 쌍을 사용하는 경우 최적화가 필요할 수 있습니다. 봇 정보: 그것은 유전자 생성을 사용하고 ATR을 사용하여 거래합니다. 커브 핏을 방지하기 위해 앞으로 걷기 기간이 사용되었습니다. EA는 모든 거래에 스탑을 사용합니다. 자금 관리는 잔액의 %로 확장됩니다. 백셋 기간은 2003-2020년이고 앞으로 나아가는 기간은 2020-2022년입니다. (사진 참조). Quant Bot은 EUR/USD에 대한 1시간 프레임의 추세 거래를 위한 것입니다. 설정된 파일은 없지만 다른 쌍을 사용하는 경우 최적화가 필요할 수 있습니다. 봇 정보: 그것은 유전자 생성을 사용하고 ATR을 사용하여 거래합니다. 커브 핏을 방지하기 위해 앞으로 걷기 기간이 사용되었습니다. EA는 모든 거래에 스탑을 사용합니다. 자금 관리는 잔액의 %로 확장됩니다. 백셋 기간은 2003-2020년이고 앞
    Crypto Net
    Thomas Bradley Butler
    Crypto Net은 1시간 단위로 BTCUSD를 거래하기 위한 것입니다. 그것은 전략을 발전시키기 위해 유전자 진화를 사용합니다. 이 EA 거래 추세는 ATR 및 Ichimoku 지표를 따릅니다. 이것은 구축되었으며 Monte Carlo 및 Walk Forward를 포함한 다양한 테스트를 통과했습니다. 입력: 최소 위험인 계정 비율입니다. 최대 로트 수 거래 중단 시간 다른 것은 변경되지 않습니다. Crypto Net은 1시간 단위로 BTCUSD를 거래하기 위한 것입니다. 그것은 전략을 발전시키기 위해 유전자 진화를 사용합니다. 이 EA 거래 추세는 ATR 및 Ichimoku 지표를 따릅니다. 이것은 구축되었으며 Monte Carlo 및 Walk Forward를 포함한 다양한 테스트를 통과했습니다. 입력: 최소 위험인 계정 비율입니다. 최대 로트 수 거래 중단 시간 다른 것은 변경되지 않습니다.
    PropTrader
    Thomas Bradley Butler
    *사용하기 전에 EA를 최적화하세요* EUR/USD에 최적화된 외환 트레이딩 전략 EA(Expert Advisor)를 통해 1~2년 내에 상당한 부를 달성한다는 것은 비현실적인 주장입니다. 백테스팅과 실제 거래는 EUR/USD 통화 쌍에 중점을 둡니다. 이 전략 정보: 이는 우리 전략의 초기 반복을 나타내며 추가 발전 가능성이 있습니다. 100% 품질 데이터로 엄격한 테스트를 거쳤으며 MT4 오류가 없습니다. 이 전략은 추세 추종의 논리적 원리에 따라 운영됩니다. 추세가 강세일 때 EA는 후행 정지를 전개하고 그 반대의 경우도 마찬가지입니다. 본질적으로 이는 간단한 추세 추종 접근 방식입니다. 주요 장점 및 고려 사항: 쉬운 설정: 기본 설정을 그대로 유지하고 원하는 대로 로트 크기만 수정합니다. 위험 관리: 이 전략에는 마틴게일이나 헤징이 사용되지 않습니다. 위험 완화: 각 거래에는 ATR(Average True Range)에 따라 결정되는 추적 중지 및 이익 실현 수준
    Down Under
    Thomas Bradley Butler
    Down Under는 1시간 프레임에 AUD/USD 쌍을 거래합니다. 이 EA는 ATR과 OHLC를 거래합니다. 이 시간 프레임에 이 쌍에 대해 형식이 지정됩니다. 혼합은 분과 함께 사용됩니다. 로트 크기 및 최대. 로트 크기. 잔액의 백분율은 거래에서 승리하면 복리됩니다. 잔고가 변동함에 따라 로트 규모도 변동합니다. 설정: mm 위험 % mm 로트 최대 부지 변경할 사항이 없습니다. 이것은 마틴게일이나 헤징 기능이 없습니다. 변경할 다른 기능은 거래하는 경우 AUD/USD의 CFD입니다. 브로커 플랫폼에서 이를 소수로 변경합니다. 위험 면책 조항 선물, 옵션 및 통화 거래는 모두 잠재적인 보상이 크지만 잠재적인 위험도 큽니다. 이러한 시장에 투자하려면 위험을 인식하고 기꺼이 감수해야 합니다.
    Cable Trader
    Thomas Bradley Butler
    GBP/USD 1 hr. 이 EA는 모멘텀과 세션을 거래합니다. 이것은 고정된 로트 구성요소를 가지고 있으며 개발함에 따라 TP를 계속 수정할 것입니다. 설정: 로트 크기 변경할 사항이 없습니다. 이것은 마틴게일이나 헤징 기능이 없습니다. 변경할 다른 기능은 거래하는 경우 GBP/USD의 CFD입니다. 브로커 플랫폼에서 이를 소수로 변경합니다. 위험 면책 조항 선물, 옵션 및 통화 거래는 모두 잠재적인 보상이 크지만 잠재적인 위험도 큽니다. 이러한 시장에 투자하려면 위험을 인식하고 기꺼이 감수해야 합니다. Cable Trade는 1시간 동안 GBP/USD 쌍을 거래합니다. 라이브 거래 전 데모. 이 EA는 모멘텀과 세션을 거래합니다. 이것은 고정된 로트 구성요소를 가지고 있으며 개발함에 따라 TP를 계속 수정할 것입니다. 설정: 로트 크기 변경할 사항이 없습니다. 이것은 마틴게일이나 헤징 기능이 없습니다. 변경할 다른 기능은 거래하는 경우 GBP/U
    Euclidean
    Thomas Bradley Butler
    Euclidean은 제가 8년 전에 생각해낸 독특한 거래 알고리즘입니다. 이 EA는 이 시스템의 일부입니다. 닫힌 시스템으로 작동합니다. EA는 추세를 포착하기에 각도가 정확할 때 매수를 시작합니다. 정지 손실은 각도에서 10%입니다. 간단합니다. 입력: $1,000에 대한 로트 1 마이크로 로트의 잔액 비율 볼륨 상위 로트 = 최대 로트 수량 이익 수준 = 기본값은 50핍입니다. 방법 및 고려해야 할 사항: 손절매가 내장되어 10%의 각도에서 가격에 따라 거래됩니다. 이익실현은 50핍으로 설정되지만 원하는 금액일 수 있습니다. 1 5분과 같은 짧은 시간에 거래하십시오. 백 테스터에서 이것을 테스트하는 데 오류가 없었습니다. 플랫폼 및 브로커마다 데이터가 다르므로 테스트할 데이터 다운로드를 확인하십시오. Forex 거래에 대한 위험 고지 마진으로 외환 거래는 높은 수준의 위험을 수반하며 모든 투자자에게 적합하지 않을 수 있습니다. 과거의 성과가 미래의 결과를 나타내는
    Pip Scalper
    Thomas Bradley Butler
    모두를 위한 지표 Pip Scalper는 스캘핑 트렌드입니다. 이 표시기로 추세를 더 오래 유지하십시오. 모든 시간 프레임과 자산에서 작동합니다. 이 도구로 매일 핍을 얻으십시오. 200 이동 평균을 사용하여 거래를 필터링하십시오. 더 짧은 기간을 권장합니다. 데이 트레이딩에 사용합니다. 정보 및 사용 방법: Pips Scalper는 장기 추세 거래를 기반으로 합니다. 파란색으로 구매 레드에 판매 200 이동 평균을 필터로 사용하고 활성 기간 동안 거래하십시오. Pip Scalper는 스캘핑 트렌드입니다. 이 표시기로 추세를 더 오래 유지하십시오. 모든 시간 프레임과 자산에서 작동합니다. 이 도구로 매일 핍을 얻으십시오. 200 이동 평균을 사용하여 거래를 필터링하십시오. 더 짧은 기간을 권장합니다. 데이 트레이딩에 사용합니다. 정보 및 사용 방법: Pips Scalper는 장기 추세 거래를 기반으로 합니다. 파란색으로 구매 레드에 판매 200 이동 평균을 필터로 사
    Evolved Trends
    Thomas Bradley Butler
    테스트 전에 최적화하고 최적의 입력을 찾는 데 사용 안녕하세요, 상인 여러분! MT4 플랫폼에 대한 최첨단 전문가 조언을 원하십니까? Evolved Trends보다 더 이상 보지 마십시오! 기계 학습 기술로 만들어진 이 강력한 거래 알고리즘은 1시간 단위로 GBP/USD 거래에 중점을 둡니다. 하지만 최적화를 위해 다른 자산과 기간을 자유롭게 실험해 보세요! 자신의 위험 허용 범위에 맞게 입력을 사용자 정의하면 됩니다. ATR을 기반으로 한 중지와 이익을 고정하고 손실을 줄이는 기능을 갖춘 Evolved Trends는 모든 거래 시스템에 대한 최고의 자금 관리를 보장합니다. 또한 고유한 위험 조정 기능은 계정 잔액에 따라 조정됩니다. Evolved Trends로 트레이딩 게임을 한 단계 더 발전시키세요!
    Combine Winner
    Thomas Bradley Butler
    Trade any Forex combine out there.  Many prop firms offer challenge or instant funding combines.  The biggest problem is controlling the loss.  With this indicator you can get a visual system that can limit loss and teach discipline.  This uses the MACD and the strategy is scalping.  You can determine the risk and reward.  Visually follow small trends for scalps.  Trade during active sessions.  It's just a simple system to instill discipline while limiting loss and scalping pips with the paramet
    Holy Grail Arrow
    Thomas Bradley Butler
    Holy Grail arrow is for scalping.  The period you use will determine the trend.  You can try different time frames and periods to see what works best for your strategy.  Filters can be applied like a moving average or trendlines.  The 1 minute works good for scalps and always trade during active periods and avoid consolidation times.  Using other indicators to determine trends is recommended but this can also be a free flowing scalping system alone with tp and sl. Inputs: Period = trend period
    Twenty Eight Forex Pairs
    Thomas Bradley Butler
    OPTIMIZE EA BEFORE TEST AND USE No EA turns hundreds into millions in a year or 2.  This is a lie if presented this way. Trade Twenty Eight Forex Pairs.  Use this EA to trade the pairs and time frames with tp and sl according to risk.  This comes with advanced money management built in.  It has break evens and take profits on 50% with sl and tp accordingly.  1 hour recommended but try on others for intraday or swing trading.
    Fulltrend
    Thomas Bradley Butler
    Improve trading with this indicator.  Find areas of buys or sells in Fibonacci retracement areas.  Fulltrend is for scalping and making swing trades.  Fib levels are added for take profits and stop losses. This works on any time frame and can be used by itself or together with other systems and indicators for filters. The indicator doesn't repaint.  Alerts are added and can be true or false.  No need to sit glued to the computer, just set on charts and listen or the alerts to come.  Take a posi
    Scalping Code
    Thomas Bradley Butler
    Scalping Code is for trend scalping.  It is simple to use and is profitable.  It can work on any time frame and any asset.  This indicator can be used on it's own or together with another system.  The arrow does not repaint or recalculate.   The rules are as follows:   A blue arrow above the moving average is a buy. An exit for the buy above the moving average is a red arrow or target. A red arrow below the moving average is a sell. An exit for the red below the moving average is a blue arrow
    Order Flow Volume
    Thomas Bradley Butler
    OPTIMIZE BEFORE BACKTEST AND USE FOR A YEAR TO FIND BEST VALUES Order Flow is unique in that is trades the volume.  It was built on EUR/USD and is optimized from  11/11/2021 to 10/24/2022 on 1 hour charts.  Optimization inputs for money management are used.  This EA uses strict money management, it is not a get rich quick martingale or EA without a sl. Trading is about risk management, not gambling.   Run on EUR/USD 1 hour chart or if you want to find other assets and time frames to optimize th
    필터:
    Konstantin Remezov
    1138
    Konstantin Remezov 2022.02.03 19:56 
     

    사용자가 평가에 대한 코멘트를 남기지 않았습니다

    리뷰 답변