Calc Trend

Calc Trend is a Forex trend indicator based on the familiar RSI, but there is one "but"!

We display RSI indicator signals on a price function chart using a mathematical approach. As you know, the overbought and oversold zones that the standard RSI fixes are often broken by the price and the price goes the other way. This makes the standard indicator inapplicable for real work in its pure form. Also, for sure, each user has noticed that at any part of the history, it is possible to change the RSI settings in this way that for a certain period of history all entries will be as accurate as possible. This is where there is work to be done.

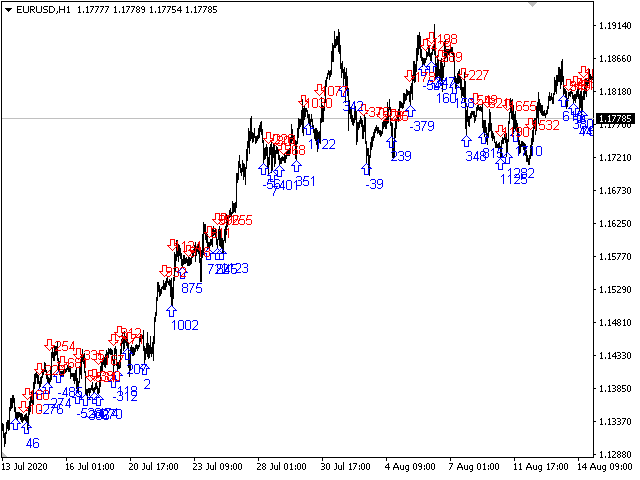
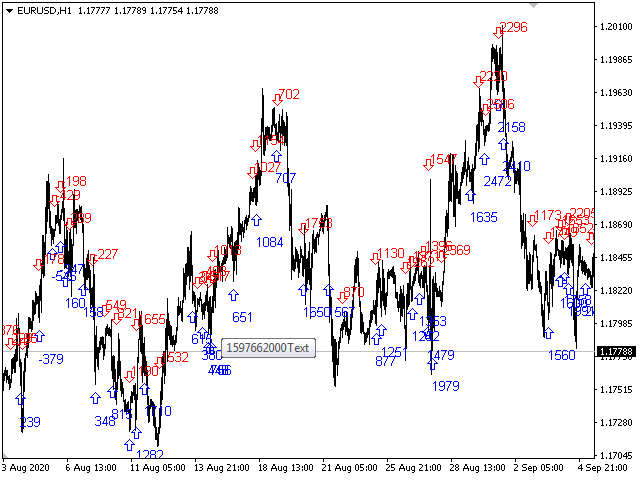
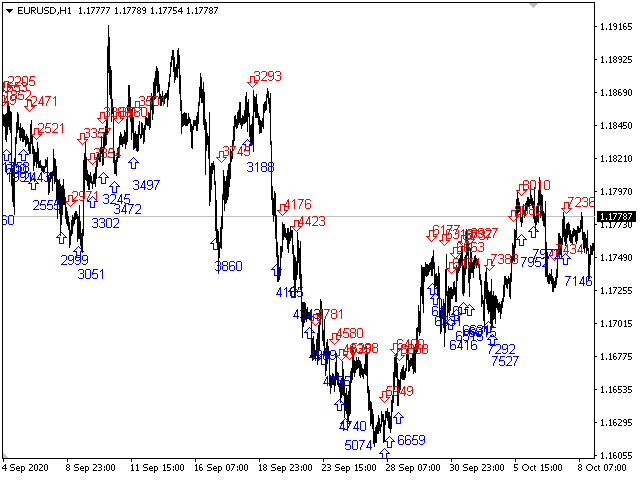
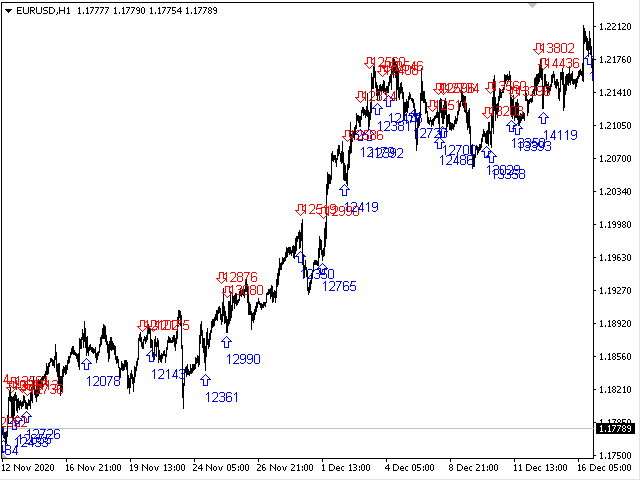
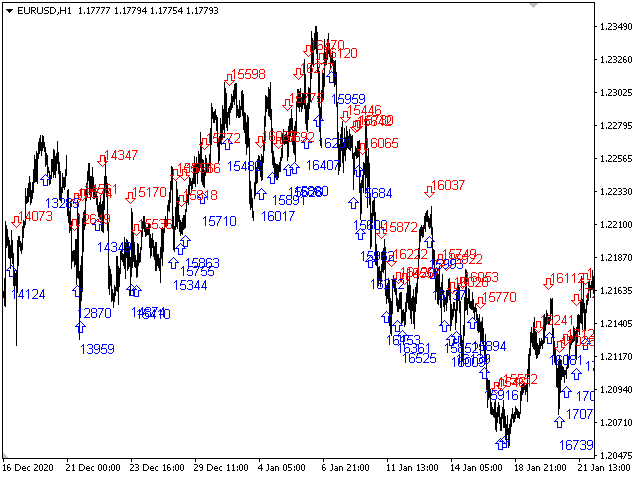
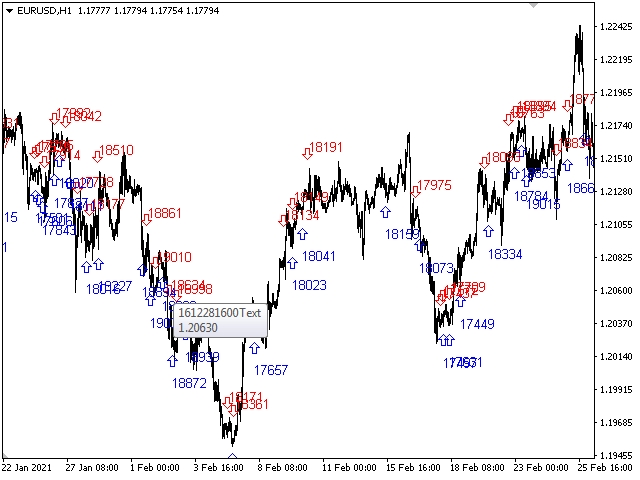
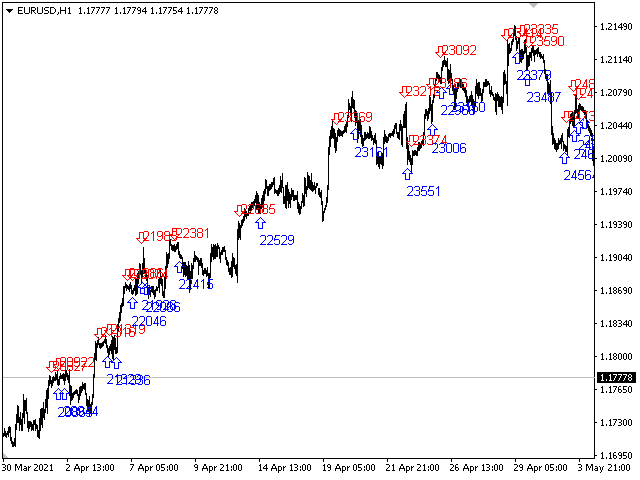
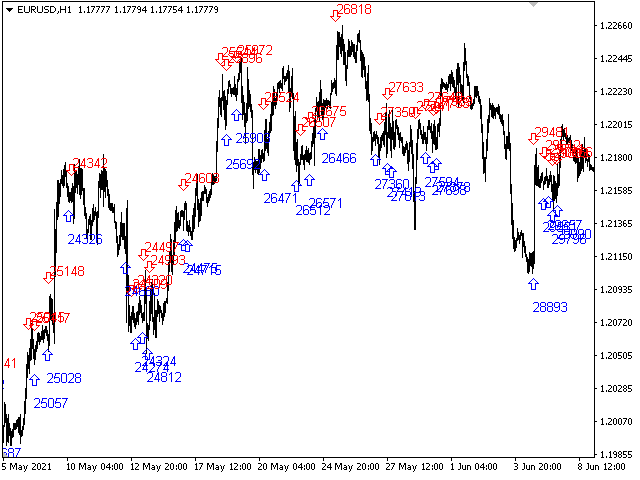
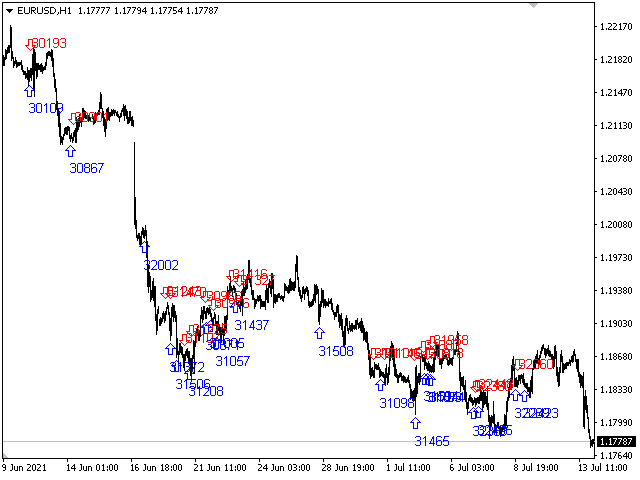
The principle of operation is basic. When the price returns from the overbought / oversold zone and breaks through the level specified in the settings (Level_L, Level_H), a buy or sell signal is generated. Everything is at the open prices, so there is no redrawing, and the signal is generated at the open price of the current candle. Also, the algorithm is created in such a way that signals for buy and sell must alternate, thus skipping unnecessary signals.

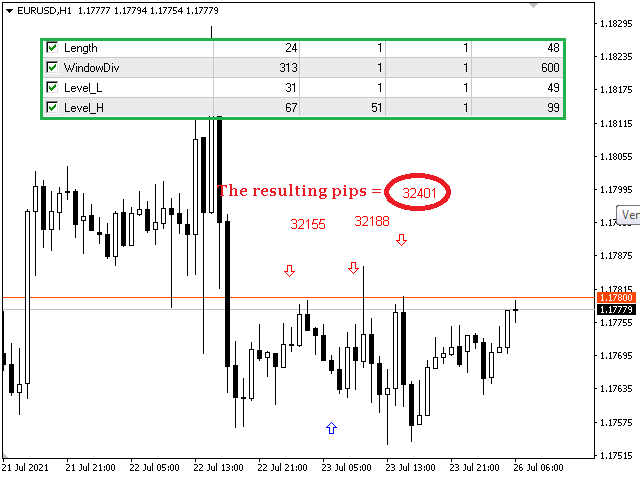
The principle of operation is managerial. Let's imagine that the period of the RSI indicator is controlled by a "magic" function that changes its period so that on a sufficiently long history interval (for example, a year) the indicator displays acceptable entry points. How is this approach implemented ?! To control the period of the RSI indicator, we will use the derivative of the price function at a certain time interval (Length). Derivative of a function is a concept of differential calculus that characterizes the rate of change of a function at a given point. It is defined as the limit of the ratio of the increment of a function to the increment of its argument when the increment of the argument tends to zero, if such a limit exists. The price function has a finite derivative (at the point under study), which means it is differentiable at this point. And we can work with her. After the mathematical transformation is made, we transform the result using the coefficient (WindowDiv) to a value acceptable for the RSI indicator, and that's it! It remains only to configure the resulting Calc Trend indicator.

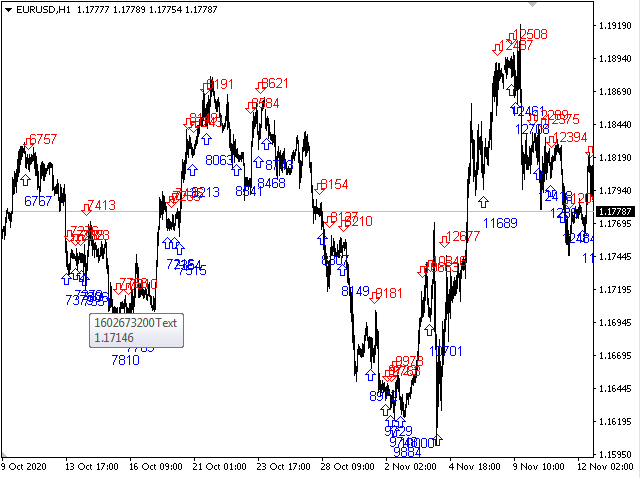
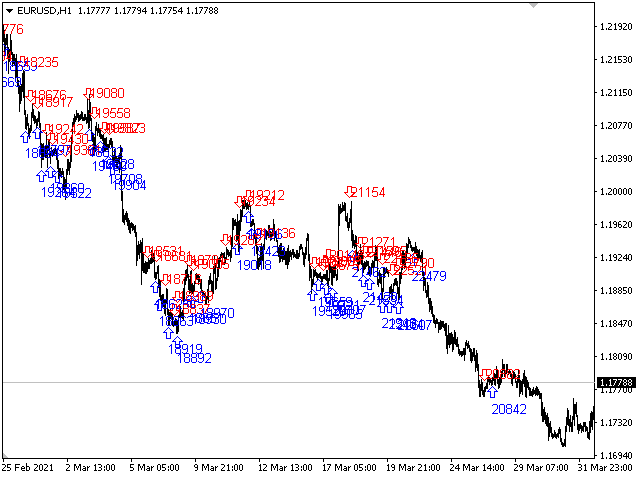
For clarity, in addition to the arrows, the function chart shows how many pips in plus can be squeezed out of the indicator. There is also a parameter (Spread), which subtracts part of the profit per spread for each signal. Also an important note, for clarity, arrows are drawn beyond the signal point, while the signal is counted only at the open price! The ranges for the selection of parameters are shown in the last screenshot.

For those who are interested in a bot created on the basis of this indicator and working according to the principle - there is a signal that closed an opposite deal and opened a new one in the specified direction, it can be downloaded and used for work. The bot is as simple as possible! The bot fully reflects the work of the indicator. Moreover, the bot can be optimized (by optimizing the parameters of the indicator itself) and thus automatically obtain the most optimal indicator indicators for the required period of history.

The main thing is to understand that the indicator parameters must be selected for each instrument and each timeframe.

추천 제품
Alpha Trend sign has been a very popular trading tool in our company for a long time. It can verify our trading system and clearly indicate trading signals, and the signals will not drift. Main functions: Based on the market display of active areas, indicators can be used to intuitively determine whether the current market trend belongs to a trend market or a volatile market. And enter the market according to the indicator arrows, with green arrows indicating buy and red arrows indicating se
Auto Fibo Pro m
DMITRII GRIDASOV
"Auto FIBO Pro" Crypto_Forex 지표 - 거래에 유용한 보조 도구입니다! - 지표는 자동으로 Fibo 수준과 로컬 추세선(빨간색)을 계산하여 차트에 배치합니다. - Fibonacci 수준은 가격이 반전될 수 있는 주요 영역을 나타냅니다. - 가장 중요한 수준은 23.6%, 38.2%, 50%, 61.8%입니다. - 역전 스캘핑이나 존 그리드 거래에 사용할 수 있습니다. - Auto FIBO Pro 지표를 사용하여 현재 시스템을 개선할 수 있는 기회도 많습니다. - Info Spread Swap Display가 있습니다. 현재 Spread와 Swap이 부착된 외환 쌍을 표시합니다. - 디스플레이에는 계정 잔액, 자본 및 마진도 표시됩니다. - 차트의 어느 모서리에서나 Info Spread Swap Display를 찾을 수 있습니다. 0 - 왼쪽 상단 모서리, 1 - 오른쪽 상단, 2 - 왼쪽 하단, 3 - 오른쪽 하단. 여기를 클릭하여 고품질 트레이딩 로봇과
Forex Gump Trend is a universal indicator for highly effective determination of the trend direction. If you identify the trend correctly, this is 95% of trading success, because you will be able to open trades in the direction of the price movement and benefit from it. The Forex Gump Trend indicator helps traders with a high degree of efficiency to determine the current trend direction, as well as trend reversal points. The direction of the trend is shown by colored lines on the chart, and the
Owl smart levels
Sergey Ermolov
4.24 (37)
MT5 버전  |   FAQ Owl Smart Levels Indicator 는   Bill Williams 의 고급 프랙탈, 시장의 올바른 파동 구조를 구축하는 Valable ZigZag, 정확한 진입 수준을 표시하는 피보나치 수준과 같은 인기 있는 시장 분석 도구를 포함하는 하나의 지표 내에서 완전한 거래 시스템입니다. 시장과 이익을 취하는 장소로. 전략에 대한 자세한 설명 표시기 작업에 대한 지침 고문-거래 올빼미 도우미의 조수 개인 사용자 채팅 ->구입 후 나에게 쓰기,나는 개인 채팅에 당신을 추가하고 거기에 모든 보너스를 다운로드 할 수 있습니다 힘은 단순함에 있습니다! Owl Smart Levels   거래 시스템은 사용하기 매우 쉽기 때문에 전문가와 이제 막 시장을 연구하고 스스로 거래 전략을 선택하기 시작한 사람들 모두에게 적합합니다. 전략 및 지표에는 눈에 보이지 않는 비밀 공식 및 계산 방법이 없으며 모든 전략 지표는 공개되어 있습니다. Owl Smart Leve
Dollar Mint Indicator
David Mwaniki Mbugua
Dollar mint indicator is a special workmanship with years of experience in forex.   Dollar mint ea is a fully non repaint indicator optimised with price action data such that once it gives you a signal t . The indicator   can be used to trade anything on the mt4 with much ease. Benefits ; Fully non repaint Use in any timeframe Use in all the available tradable assets on mt4 Best to use on h4. It generates fully analysed buy and sell signals based on trend and also filters out retracements and
Trend Scanner
Vladimir Kalendzhyan
4.33 (6)
By purchasing this indicator, you have the right to receive a free copy of one of   my other indicator's or advisor’s!  (All future updates are included. No limits) . To get it , please contact me by  mql5 message ! The Trend Scanner trend line indicator displays the trend direction and its changes. The indicator works on all currency pairs and  timeframes. The indicator simultaneously displays multiple readings on the price chart: the support and resistance lines of the currency pair, the exist
FX Flow
Eva Stella Conti
FX Flow   indicator can be used as an anticipator of the next trend, preferably confirmed by Price Action or another oscillator (RSi, Stochastic ..). It takes the money flows of the major currencies USD EUR GBP AUD NZD CAD CHF JPY into account, and processes them. Excellent tool for indices, but also for correlations between currencies. Works on each timeframes.  Blue line: Bull market Yellow line: Bear market Note : if the indicator opens the window, but does not draw lines, load the historie
Crosskalp1
Mikhail Bilan
Добрый День уважаемые трейдеры!  Вашему вниманию индикатор созданный и работающий на базе трендовика ADX,  для торговли на смене направления движения который учитывает коррекцию и даёт возможность на ней заработать.  Применяю этот индикатор для скальпинга. Рекомендую таймфреймы от 15 ти минутного(М15) до часового (Н1) периодов.  Красный кружок сигнал на продажу- Sell) Зелёный кружок  сигнал на покупку Buy) Чем меньше ваш таймфрейм тем меньше пунктов вы зарабатываете.   Важно выставлять стопы! !В
Trend PA
Mikhail Nazarenko
5 (3)
The Trend PA indicator uses   Price Action   and its own filtering algorithm to determine the trend. This approach helps to accurately determine entry points and the current trend on any timeframe. The indicator uses its own algorithm for analyzing price changes and Price Action. Which gives you the advantage of recognizing, without delay, a new nascent trend with fewer false positives. Trend filtering conditions can be selected in the settings individually for your trading style. The indicator
The indicator detects and displays 3 Drives harmonic pattern (see the screenshot). The pattern is plotted by the extreme values of the ZigZag indicator (included in the resources, no need to install). After detecting the pattern, the indicator notifies of that by a pop-up window, a mobile notification and an email. The indicator highlights the process of the pattern formation and not just the complete pattern. In the former case, it is displayed in the contour triangles. After the pattern is com
Spread and Close MT4
Alexander Denisovich Jegorov
Spread & Candle Close Timer Indicator for MT4  Optimize your trading with this lightweight and efficient indicator, designed to display the real-time spread and candle close countdown directly on your MT4 chart. Features: Live Spread Monitoring – Instantly see market conditions. Candle Close Timer – Stay prepared for the next price movement. Simple & Non-Intrusive Design – No unnecessary settings, just clear and accurate data. Ideal for scalpers, day traders, and those who need real-time exec
Happy Scalping Indicator
Leandro Bernardez Camero
이 지표는 공격적인 스캘핑 과 바이너리 옵션에서 빠른 진입 을 위해 설계되었습니다 , 각 캔들 마다 신호를 생성하여 언제든지 무엇이 일어나고 있는지 정확히 알 수 있습니다. Happy Scalping 채널에 가입하세요: MQL5 재작성 없음 : 현재 캔들의 신호는 실시간 으로 생성됩니다. 이는 캔들이 아직 형성 중일 때 가격이 이전 캔들의 종가에 비해 상승하거나 하락하는지에 따라 신호가 변경될 수 있음을 의미합니다. 그러나 캔들이 닫히면 , 신호의 색상은 완전히 고정됩니다 . 변경되지 않으며, 사라지지 않고, 이동하지 않습니다. 보이는 그대로 남습니다. 왜 이렇게 설계되었나요? 많은 스캘퍼들은 특히 가격의 돌파나 급격한 움직임 이 있을 때 즉시 신호를 받는 것을 선호합니다. 이를 통해 그런 빠른 피프스를 바로잡을 수 있습니다. 반면, 일부 트레이더는 닫힌 캔들로 확인을 기다리는 것 을 선호하며, 이 지표는 그들도 완벽하게 사용할 수 있습니다. 두 가지 접근 방식 모두 유효합니
Smart M Concept MT4
Andrei Novichkov
Our new indicator is an important part of the Smart Money Concepts (SMC) system It uses a modern market vision and fast calculation methods. As a result, the trader has a complete picture of the trade at every moment in time, which makes the process of obtaining results easier and faster. Our new indicator displays the following important patterns:   Order Blocks. Imbalance – Fair Value Gap (FVG). Break Of Structures (BoS). Change of character (CHoCH). Equal highs & lows. Premium , Equilibrium
New, more accurate version of the Xmaster indicator. More than 200 traders from around the world have conducted more than 15,000 tests of different combinations of this indicator on their PCs in order to get the most effective and accurate formula. And here we present to you the "Xmaster formula indicator forex no repaint" indicator, which shows accurate signals and does not repaint. This indicator also sends signals to the trader by email and push. With the arrival of each new tick, it constan
Italo Trend Indicator
Italo Santana Gomes
4.76 (33)
BUY INDICATOR AND GET EA FOR FREE AS A BONUS + SOME OTHER GIFTS! ITALO TREND INDICATOR  is the best trend indicator on the market, the Indicator works on all time-frames and assets, indicator built after 7 years of experience on forex and many other markets. You know many trend indicators around the internet are not complete, does not help, and it's difficult to trade, but the Italo Trend Indicator is different , the Italo Trend Indicator shows the signal to buy or sell, to confirm the signal t
History Pattern Search
Yevhenii Levchenko
표시기는 현재 시세를 작성하여 과거 시세와 비교할 수 있으며 이를 바탕으로 가격 변동을 예측합니다. 표시기에는 원하는 날짜로 빠르게 이동할 수 있는 텍스트 필드가 있습니다. 옵션: 기호 - 표시기가 표시할 기호 선택. SymbolPeriod - 지표가 데이터를 가져올 기간 선택. IndicatorColor - 표시기 색상. HorisontalShift - 지시자가 그린 따옴표를 지정된 막대 수만큼 이동합니다. Inverse - true는 인용 부호를 반대로, false - 원래 보기를 반전합니다. ChartVerticalShiftStep - 차트를 수직으로 이동합니다(키보드의 위/아래 화살표). 다음은 날짜를 입력할 수 있는 텍스트 필드의 설정으로, '엔터'를 누르면 즉시 이동할 수 있습니다.
Scalping trader full - full version of the scalping indicator for intraday trading. This indicator analyzes the state of the market and shows the trader with arrows when to open orders and in which direction. When the arrow appears, open an order in the direction of the arrow. We set take profit at the minimum distance (about 10 pips + spread). Stoploss is an indicator signal in the opposite direction. Indicator advantages: shows signals on the chart when to open orders. shows in which directi
Trend Factor
Artem Kuzmin
An indicator for entering with trend and timely exiting. It has sensitivity setting, by adjusting which it can be applied to both long-term and short-term speculation.  The highest sensitivity = 1, with this setup, you can even scalp on M1. No lag, does not withdraw after candlestick closure.  One of the use options: enter after a candlestick closes, if the vertical line consists of squares of the same color; exit if the color of two or more squares changes. Before using it, be sure to analyze t
Forex Gump Dot is a ready-made mechanical trading system for the +10 pips strategy. This strategy has been actively discussed and developed on the Internet for several years. The essence of this strategy is to open trade operations during the day and fix the minimum profit on each trade operation. That is, scalp. Our development team decided to adapt the indicators of the Forex Gump family and release a new product that will best match the scalping trading strategy. This product is Forex Gump Do
Scalping trader light is a simplified version of the scalping indicator for intraday trading. This indicator analyzes the state of the market and shows the trader with arrows when to open orders and in which direction. When the arrow appears, open an order in the direction of the arrow. We set take profit at the minimum distance (about 10 pips + spread). Stoploss is an indicator signal in the opposite direction. The simplified version of the indicator works the same on all pairs and timeframes
Trend Oscillator mw
DMITRII GRIDASOV
Trend Oscillator - 고급 맞춤형 Crypto_Forex 지표, 효율적인 거래 도구입니다! - 고급 새로운 계산 방법 사용 - 매개변수 "계산 가격"에 대한 20가지 옵션. - 지금까지 개발된 가장 매끄러운 오실레이터. - 상승 추세는 녹색, 하락 추세는 빨간색. - 과매도 값: 5 미만, 과매도 값: 95 이상. - 이 지표로 표준 전략도 업그레이드할 수 있는 기회가 많습니다. - PC 및 모바일 알림. ................................................................................................................................................ 여기를 클릭하여 고품질 트레이딩 로봇과 지표를 확인하세요! 이 MQL5 웹사이트에서만 제공되는 오리지널 제품입니다.
캔들의 종가를 예측하는 지표입니다. 지표는 주로 D1 차트에서 사용하기 위한 것이. 이 지표는 전통적인 외환 거래와 바이너리 옵션 거래 모두에 적합합니다. 지표는 독립형 거래 시스템으로 사용하거나 기존 거래 시스템에 추가로 사용할 수 있습니다. 이 표시기는 현재 양초를 분석하여 양초 본체 내부의 특정 강도 요인과 이전 양초의 매개변수를 계산합니다. 따라서 지표는 시장 움직임의 추가 방향과 현재 양초의 종가를 예측합니다. 이 방법 덕분에 지표는 단기 및 중장기 거래 모두에 적합합니다. 지표를 사용하면 시장 상황을 분석하는 동안 지표가 생성할 잠재적 신호의 수를 설정할 수 있습니다. 표시기 설정에는 이를 위한 특별한 매개변수가 있습니다. 또한 인디케이터는 새로운 신호에 대해 차트의 메시지 형태, 이메일 및 PUSH 알림 형태로 알릴 수 있습니다. 구매 후 저에게 꼭 써주세요! 나는 당신에게 지표와 거래에 대한 나의 추천을 줄 것입니다! 또한 보너스를 받으세요!
Volume Compair
Thiago Pereira Pinho
Professional Cumulative Delta & Volume Median Indicator Track   real buying/selling pressure   with this powerful volume analysis tool. The   Volume Compare Indicator   combines   Cumulative Delta   and   Volume Medians   to help you identify institutional activity, imbalances, and potential reversals. Key Features: Cumulative Delta Histogram   – Visualizes net buying vs. selling volume in real-time. Buy/Sell Volume Medians   – Horizontal lines showing average buy & sell volume levels. Smart Vo
Weis Wave Indicator
Dhabaleswar Prasad Jena
This indicator is based on the Weis wave principle of wave volume. Below are few features of the indicator It draws the wave on the chart while the accumulated volume per wave in a different window at the bottom of the chart You can configure the turning point move It displays the accumulated volume (in thousands, eg for 15000 volume it will show 15) at the end of each wave You can also configure to show number of candles in the wave along with the wave volume The indicator calculates the distin
Zig Zag 123
Stephen Reynolds
Zig Zag 123 tells us when a reversal or continuation is more likely by looking at the shift in supply and demand. When this happens a signature pattern appears known as 123 (also known ABC) will often break out in direction of higher low or lower high. Stop loss and take profit levels have been added. There is a panel that shows the overall performance of your trades for if you was to use these stop loss and take profit levels.  We get alerted if a pattern 123 appears and also if the price re
FREE
The indicator helps to identify possible rollbacks and reversals. Shows the direction of the price movement and is painted in the appropriate color. Allows you to conduct trend and counter trend trading It works on all timeframes, on any currency pairs, metals and cryptocurrency Can be used when working with binary options Distinctive features Does not redraw; Simple and clear settings; It works on all timeframes and on all symbols; Suitable for trading currencies, metals, options and cryptocurr
PREVIOUS INDICATOR’S DATA MA CROSSOVER https://www.mql5.com/en/users/earobotkk/seller#products P/S: If you like this indicator, please rate it with 5 stars in the review section, this will increase its popularity so that other users will be benefited from using it. This indicator notifies and draws an arrow on the chart whenever    the MA line has crossed over its previous indicator’s data MA filtered by MA Trend.   It also displays total pips gained from all the entry set-ups. Setting ·   You c
FREE
Before
Nadiya Mirosh
The Before indicator predicts the most likely short-term price movement based on complex mathematical calculations. Most of the standard indicators commonly used in trading strategies are based on fairly simple calculations. This does not mean that there were no outstanding mathematicians in the world at the time of their creation. It is just that computers did not yet exist in those days, or their power was not enough for the sequential implementation of complex mathematical operations. Nowad
Line Magnit
Aleksey Trenin
The LineMagnit Indicator for MT4 is a highly precise tool that builds support and resistance levels which magnetically attract prices. This feature allows traders to easily determine the most probable entry and exit points in the market, as well as identify the market's directional forces, as levels are based on capital inflows into the instrument. Equipped with an intuitively understandable graphical interface, the LineMagnit Indicator enables users to quickly locate and analyze support and res
The indicator detects and displays Shark harmonic pattern (see the screenshot). The pattern is plotted by the extreme values of the ZigZag indicator (included in the resources, no need to install). After detecting the pattern, the indicator notifies of that by a pop-up window, a mobile notification and an email. The indicator highlights the process of the pattern formation and not just the complete pattern. In the former case, it is displayed in the contour triangles. After the pattern is comple
이 제품의 구매자들이 또한 구매함
Smc Blast Signal
Mohit Dhariwal
5 (4)
NEW YEAR 2026 SALE OFFER PRICE AT JUST 99 DOLLARS FEW COPIES ONLY AT This price From 10th Jan -20th Jan MIDNIGHT Final offer GRAB YOUR COPY ON THIS New Year EVE Prices will be increased to 150 after the offer period ends Full Fledged EA and Alert plus for alerts will also be provided in this offer along with the purchase of Indicator. Limited copies only at this price and Ea too. Grab your copy soon Alert plus for indicator with set file is kept in comment section with the image  SMC Blast Signa
현재 20% 할인 ! 초보자 또는 전문가 트레이더를 위한 최고의 솔루션! 이 대시보드 소프트웨어는 28개의 통화 쌍에서 작동합니다. 2가지 주요 지표(Advanced Currency Strength 28 및 Advanced Currency Impulse)를 기반으로 합니다. 전체 Forex 시장에 대한 훌륭한 개요를 제공합니다. 고급 통화 강도 값, 통화 이동 속도 및 모든(9) 시간대의 28 Forex 쌍에 대한 신호를 보여줍니다. 추세 및/또는 스캘핑 기회를 정확히 파악하기 위해 차트의 단일 지표를 사용하여 전체 시장을 볼 수 있을 때 거래가 어떻게 개선될지 상상해 보십시오! 잠재적인 거래를 식별하고 확인하면서 강력한 통화와 약한 통화를 더욱 쉽게 식별할 수 있도록 이 지표에 기능을 내장했습니다. 이 표시기는 통화의 강세 또는 약세가 증가 또는 감소하는지 여부와 모든 시간대에서 수행되는 방식을 그래픽으로 보여줍니다. 추가된 새로운 기능은 현재 시장 조건 변화에 적응하는
Scalper Inside PRO
Alexey Minkov
4.74 (69)
An exclusive indicator that utilizes an innovative algorithm to swiftly and accurately determine the market trend. The indicator automatically calculates opening, closing, and profit levels, providing detailed trading statistics. With these features, you can choose the most appropriate trading instrument for the current market conditions. Additionally, you can easily integrate your own arrow indicators into Scalper Inside Pro to quickly evaluate their statistics and profitability. Scalper Inside
GOLD Impulse with Alert
Bernhard Schweigert
4.64 (11)
이 지표는 Advanced Currency IMPULSE with ALERT  +   Currency Strength Exotics  의 2가지 제품의 슈퍼 조합입니다. 그것은 모든 시간 프레임에 대해 작동하며 8개의 주요 통화와 하나의 기호에 대한 강약의 충동을 그래픽으로 보여줍니다! 이 표시기는 금, 이국적인 쌍, 상품, 지수 또는 선물과 같은 기호에 대한 통화 강도 가속을 표시하는 데 특화되어 있습니다. 금, 은, 오일, DAX, US30, MXN, TRY, CNH 등의 진정한 통화 강도 가속(충동 또는 속도)을 표시하기 위해 9번째 줄에 모든 기호를 추가할 수 있습니다. 새로운 기본 알고리즘을 기반으로 구축되어 잠재적인 거래를 훨씬 더 쉽게 식별하고 확인할 수 있습니다. 이는 통화의 강세 또는 약세가 가속되는지 여부를 그래픽으로 표시하고 가속 속도를 측정하기 때문입니다. 자동차의 속도계처럼 생각하면 됩니다. 가속화할 때 Forex 시장에서 동일한 일이 분명히 더 빠르
FX Volume
Daniel Stein
4.63 (38)
FX Volume: 브로커 시각에서 바라보는 진짜 시장 심리 간단 요약 트레이딩 접근 방식을 한층 더 향상시키고 싶으신가요? FX Volume 는 소매 트레이더와 브로커의 포지션을 실시간으로 파악할 수 있게 해 줍니다. 이는 COT 같은 지연된 보고서보다 훨씬 빠릅니다. 꾸준한 수익을 추구하는 분이든, 시장에서 더 깊은 우위를 원하시는 분이든, FX Volume 을 통해 대규모 불균형을 찾아내고, 돌파 여부를 확인하며 리스크 관리를 정교화할 수 있습니다. 지금 시작해 보세요! 실제 거래량 데이터가 의사결정을 어떻게 혁신할 수 있는지 직접 경험해 보시기 바랍니다. 1. 트레이더에게 FX Volume이 매우 유익한 이유 탁월한 정확도를 지닌 조기 경보 신호 • 다른 사람들보다 훨씬 앞서, 각 통화쌍을 매수·매도하는 트레이더 수를 거의 실시간으로 파악할 수 있습니다. • FX Volume 은 여러 리테일 브로커에서 추출한 실제 거래량 데이터를 종합해 명확하고 편리한 형태로 제공하는
Volatility Trend System - a trading system that gives signals for entries. The volatility system gives linear and point signals in the direction of the trend, as well as signals to exit it, without redrawing and delays. The trend indicator monitors the direction of the medium-term trend, shows the direction and its change. The signal indicator is based on changes in volatility and shows market entries. The indicator is equipped with several types of alerts. Can be applied to various trading ins
Currency Strength Exotics
Bernhard Schweigert
4.88 (33)
현재 20% 할인! 초보자 또는 전문가 트레이더를 위한 최고의 솔루션! 이 표시기는 Exotic Pairs Commodities, Indexes 또는 Futures와 같은 기호에 대한 통화 강도를 표시하는 데 특화되어 있습니다. 금, 은, 석유, DAX, US30, MXN, TRY, CNH 등의 진정한 통화 강도를 보여주기 위해 9번째 줄에 모든 기호를 추가할 수 있습니다. 이것은 독특하고 고품질이며 저렴한 거래 도구입니다. 우리는 많은 독점 기능과 새로운 공식을 통합했습니다. 새로운 추세 또는 스캘핑 기회의 정확한 트리거 포인트를 정확히 찾아낼 수 있기 때문에 거래가 어떻게 개선될지 상상해 보십시오. 사용 설명서: 여기를 클릭 https://www.mql5.com/en/blogs/post/708876 모든 시간대에 작동합니다. TREND를 빠르게 확인할 수 있습니다! 새로운 기본 알고리즘을 기반으로 설계되어 잠재적인 거래를 더욱 쉽게 식별하고 확인할 수 있습니다. 8개의
Miraculous Indicator – Gann Square of Nine 기반 100% 비리페인트 Forex 및 바이너리 도구 이 영상은 Miraculous Indicator 를 소개합니다. 이 지표는 Forex 및 바이너리 옵션 트레이더를 위해 특별히 개발된 매우 정확하고 강력한 트레이딩 도구입니다. 이 지표가 독특한 이유는 전설적인 **Gann Square of Nine(Gann 9의 사각형)**과 **Gann's Law of Vibration(Gann 진동의 법칙)**에 기반을 두고 있기 때문입니다. 이는 현대 트레이딩에서 가장 정밀한 예측 도구 중 하나로 손꼽힙니다. Miraculous Indicator는 완전히 비리페인트(non-repaint) 됩니다. 즉, 캔들이 마감된 후에도 신호가 변경되거나 사라지지 않습니다. 보이는 것이 곧 결과입니다. 이는 트레이더가 자신감을 가지고 거래에 진입하고 청산할 수 있는 신뢰할 수 있고 일관된 기반을 제공합니다. 주요 특징: Gann
Trend indicator AI
Ramil Minniakhmetov
5 (75)
트렌드 인공 지능 지표는 실행 가능한 진입 점 및 반전 경고와 추세 식별을 결합하여 상인의 시장 분석을 향상시킬 훌륭한 도구입니다. 이 표시기는 사용자가 자신감과 정밀도로 외환 시장의 복잡성을 탐색 할 수 있도록 지원합니다 기본 신호 외에도 트렌드 인공 지능 지표는 풀백 또는 되돌림 중에 발생하는 2 차 진입 점을 식별하여 거래자가 기존 트렌드 내에서 가격 수정을 활용할 수 있도록합니다. 중요한 장점: ·작동 4 및 5 *명확한 구매 또는 판매 신호 *다시 칠하지 않습니다 *모든 자산에서 작동 나는 전보 사기에 개 또는 세트를 판매하지 않도록주의. 모든 설정은 블로그에 여기에 무료.  중요! 지침 및 보너스를 얻기 위해 구입 후 즉시 저에게 연락! 진짜 가동 감시는 뿐 아니라 나의 다른 제품 여기에서 찾아낼 수 있습니다: https://www.mql5.com/en/users/mechanic/seller&nbsp ; 설정 및 입력: 모든 자산에 대해 기본 설정을 권
Trend Lines PRO
Roman Podpora
5 (1)
트렌드 라인즈 프로       이 지표는 시장이 실제로 어떤 방향으로 전환되는지 파악하는 데 도움이 됩니다. 실제 추세 반전 지점과 주요 시장 참여자들이 다시 진입하는 지점을 보여줍니다. 보시다시피       BOS 라인       복잡한 설정이나 불필요한 노이즈 없이 더 높은 시간대의 추세 변화와 주요 레벨을 확인할 수 있습니다. 신호는 차트에 다시 그려지지 않고 캔들이 마감된 후에도 계속 표시됩니다. 지표가 보여주는 내용: 실제 변화       추세(BOS 라인) 한 번 신호가 나타나면 그 신호는 계속 유효합니다! 이는 신호를 발생시킨 후 변경될 수 있는 리페인팅 방식의 지표와 중요한 차이점입니다. 리페인팅 방식의 지표는 잠재적으로 자금 손실로 이어질 수 있습니다. 이제 더욱 높은 확률과 정확도로 시장에 진입할 수 있습니다. 또한 화살표가 나타난 후 목표가(익절)에 도달하거나 반전 신호가 나타날 때까지 캔들스틱 색상이 계속 바뀌는 기능도 있습니다. 반복 항목          
Dynamic Forex28 Navigator
Bernhard Schweigert
4.43 (7)
Dynamic Forex28 Navigator - 차세대 외환 거래 도구. 현재 49% 할인. Dynamic Forex28 Navigator는 오랫동안 인기 있는 지표의 진화형으로, 세 가지의 힘을 하나로 결합했습니다. 고급 통화 Strength28 지표(695개 리뷰) + 고급 통화 IMPULSE with ALERT(520개 리뷰) + CS28 콤보 신호(보너스). 지표에 대한 자세한 정보 https://www.mql5.com/en/blogs/post/758844 차세대 Strength 지표는 무엇을 제공합니까?  원래 지표에서 좋아했던 모든 것이 새로운 기능과 더 높은 정확도로 강화되었습니다. 주요 기능: 독점적인 통화 Strength 공식.  모든 시간대에 걸쳐 부드럽고 정확한 강도선. 추세와 정확한 진입을 식별하는 데 이상적입니다. 역동적인 시장 피보나치 수준(시장 피보나치).  이 지표에만 있는 고유한 기능. 가격 차트가 아닌 통화 강도에 피보나치가 적용됩니다.
Supply and Demand Dashboard PRO
Bernhard Schweigert
4.8 (20)
현재 20% 할인! 이 대시보드는 여러 기호와 최대 9개의 타임프레임에서 작동하는 매우 강력한 소프트웨어입니다. 주요 지표(최상의 리뷰: 고급 공급 수요)를 기반으로 합니다.   Advanced Supply Demand 대시보드는 훌륭한 개요를 제공합니다. 다음과 같이 표시됩니다.  영역 강도 등급을 포함하여 필터링된 공급 및 수요 값, 영역에 대한/및 영역 내 Pips 거리, 중첩된 영역을 강조 표시하고 모든 (9) 시간 프레임에서 선택한 기호에 대해 4가지 종류의 경고를 제공합니다. 그것은 당신의 개인적인 필요에 맞게 고도로 구성 가능합니다! 당신의 혜택! 모든 트레이더에게 가장 중요한 질문: 시장에 진입하기에 가장 좋은 수준은 무엇입니까? 최고의 성공 기회와 위험/보상을 얻으려면 강력한 공급/수요 영역 내 또는 그 근처에서 거래를 시작하십시오. 손절매를 위한 최적의 장소는 어디입니까? 가장 안전하려면 강력한 수요/공급 구역 아래/위에 정류장을 두십시오.
FX Power MT4 NG
Daniel Stein
4.95 (20)
FX Power: 통화 강세 분석으로 더 스마트한 거래 결정을 개요 FX Power 는 어떤 시장 상황에서도 주요 통화와 금의 실제 강세를 이해하기 위한 필수 도구입니다. 강한 통화를 매수하고 약한 통화를 매도함으로써 FX Power 는 거래 결정을 단순화하고 높은 확률의 기회를 발견합니다. 트렌드를 따르거나 극단적인 델타 값을 사용해 반전을 예측하고자 한다면, 이 도구는 귀하의 거래 스타일에 완벽히 적응합니다. 단순히 거래하지 말고, FX Power 로 더 스마트하게 거래하세요. 1. FX Power가 거래자에게 매우 유용한 이유 통화와 금의 실시간 강세 분석 • FX Power 는 주요 통화와 금의 상대적 강세를 계산하고 표시하여 시장 역학에 대한 명확한 통찰력을 제공합니다. • 어떤 자산이 앞서고 있고 어떤 자산이 뒤처지는지 모니터링하여 보다 현명한 거래 결정을 내릴 수 있습니다. 포괄적인 멀티 타임프레임 뷰 • 단기, 중기 및 장기 타임프레임에서 통화와 금의 강세를
이 지표를 구매하면 제 프로페셔널 트레이드 매니저를 무료로 드립니다. 우선 이 거래 시스템이 리페인팅, 리드로잉 및 레이그 인디케이터가 아니라는 점을 강조하는 것이 중요합니다. 이는 수동 및 로봇 거래 모두에 이상적인 것으로 만듭니다. 온라인 강좌, 설명서 및 프리셋 다운로드. "스마트 트렌드 트레이딩 시스템 MT5"은 새로운 및 경험이 풍부한 트레이더를 위해 맞춤형으로 제작된 종합적인 거래 솔루션입니다. 10개 이상의 프리미엄 인디케이터를 결합하고 7개 이상의 견고한 거래 전략을 특징으로 하여 다양한 시장 조건에 대한 다목적 선택이 가능합니다. 트렌드 추종 전략: 효과적인 트렌드 추이를 타기 위한 정확한 진입 및 손절 관리를 제공합니다. 반전 전략: 잠재적인 트렌드 반전을 식별하여 트레이더가 범위 시장을 활용할 수 있게 합니다. 스캘핑 전략: 빠르고 정확한 데이 트레이딩 및 단기 거래를 위해 설계되었습니다. 안정성: 모든 인디케이터가 리페인팅, 리드로잉 및 레이그가 아니므로 신뢰
The Super Arrow Indicator provides non-repainting buy and sell signals with exceptional accuracy. Key Features No repainting – confirmed signals remain fixed Clear visual arrows: green for buy, red for sell Real-time alerts via pop-up, sound, and optional email Clean chart view with no unnecessary clutter Works on all markets: Forex, gold, oil, indices, crypto Adjustable Parameters TimeFrame Default: "current time frame" Function: Sets the time frame for indicator calculation Options: Can be set
Adaptive Volatility Range
Stanislav Konin
5 (3)
Adaptive Volatility Range [AVR] is a powerful tool for identifying key trend reversal points. AVR accurately reflects the Average True Range (ATR) of volatility, taking into account the Volume-Weighted Average Price (VWAP). The indicator adapts to any market volatility by calculating the average volatility over a specific period, ensuring a stable rate of profitable trades. You receive not just an indicator but a professional automated trading system , AVR-EA . Advantages: Automated Trading Sys
Shogun Trade
Yuki Miyake
5 (1)
SHOGUN Trade - Strategic Market Structure & Multi-Timeframe Dashboard Concept: The Commander’s Perspective In the battlefield of trading, getting lost in localized price fluctuations (noise) is the most significant risk to capital. SHOGUN Trade is engineered to elevate a trader's perspective from "reactive" to "strategic," providing a comprehensive overview of market structures across multiple time horizons. This system monitors seven timeframes (M1 to D1) simultaneously, quantifying market m
Basic Harmonic Patterns Dashboard
Mehran Sepah Mansoor
5 (3)
이 대시보드는 선택한 심볼에 대해 사용 가능한 최신 고조파 패턴을 표시하므로 시간을 절약하고 더 효율적으로 사용할 수 있습니다 / MT5 버전 . 무료 인디케이터: Basic Harmonic Pattern 인디케이터 열 Symbol : 선택한 심볼이 나타납니다 Trend : 강세 또는 약세 Pattern : 패턴 유형(가틀리, 나비, 박쥐, 게, 상어, 사이퍼 또는 ABCD) Entry : 진입 가격 SL: 스톱로스 가격 TP1: 1차 테이크프로핏 가격 TP2: 2차 테이크프로핏 가격 TP3: 3차 테이크프로핏 가격 Current price: 현재 가격 Age (in bars): 마지막으로 그려진 패턴의 나이 주요 입력 Symbols : "28개 주요 통화쌍" 또는 "선택한 심볼" 중에서 선택합니다. Selected Symbols : 쉼표로 구분하여 모니터링하려는 원하는 심볼("EURUSD,GBPUSD,XAUUSD")을 선택합니다. 브로커에 쌍에 접미사 또는 접두사가 있는
Atomic Analyst
Issam Kassas
5 (3)
우선적으로 언급할 점은이 거래 지표가 다시 그리지 않고 지연되지 않으며 이를 통해 수동 및 로봇 거래 모두에 이상적이라는 점입니다. 사용자 매뉴얼: 설정, 입력 및 전략. Atomic Analyst는 가격의 강도와 모멘텀을 활용하여 시장에서 더 나은 이점을 찾는 PA Price Action Indicator입니다. 고급 필터를 장착하여 잡음과 거짓 신호를 제거하고 거래 잠재력을 높이는 데 도움이 됩니다. 복잡한 지표의 다중 레이어를 사용하여 Atomic Analyst는 차트를 스캔하고 복잡한 수학적 계산을 간단한 신호와 색상으로 변환하여 초보 트레이더가 이해하고 일관된 거래 결정을 내릴 수 있도록합니다. "Atomic Analyst"는 새로운 및 경험이 풍부한 트레이더를위한 종합적인 거래 솔루션입니다. 프리미엄 지표와 최고 수준의 기능을 하나의 거래 전략에 결합하여 모든 종류의 트레이더에 대한 다재다능한 선택지가되었습니다. 인트라데이 거래 및 스캘핑 전략 : 빠르고 정확한 일일
Gold Signal Pro
Mohamed Hassan
First 25 copies at $80, after that price becomes $149 Gold Signal Pro is a powerful MT4 indicator designed to help traders spot strong price reactions in the market. It focuses on clear wick rejections , showing when price strongly rejects a level and often continues in the same direction. Gold Signal Pro is mainly built for scalping gold (XAUUSD) and works best on lower timeframes like M5 and M15 , where timing matters most. That said, it can also be used on any forex pair, any symbol, and a
F-16 비행기 지표를 소개합니다. 이것은 귀하의 거래 경험을 혁신하도록 설계된 최첨단 MT4 도구입니다. F-16 전투기의 비할 데 없는 속도와 정밀성에 영감을 받아이 지표는 고급 알고리즘과 최첨단 기술을 결합하여 금융 시장에서 압도적인 성능을 제공합니다. F-16 비행기 지표를 사용하면 실시간 분석을 제공하고 매우 정확한 거래 신호를 생성하여 경쟁을 앞서갈 수 있습니다. 다양한 자산 클래스에서 수익 기회를 식별하는 데 필요한 동적 기능을 갖추고 있어 확신을 가지고 정보에 근거한 결정을 내릴 수 있습니다. 사용자 친화적인 인터페이스로 구성된 F-16 비행기 지표는 인기있는 MetaTrader 4 플랫폼과 완벽하게 통합되어 원활하고 효율적인 거래 과정을 보장합니다. 초보자 트레이더든 경험 많은 전문가든 이 지표를 쉽게 사용자 정의하여 고유한 거래 스타일과 선호도에 맞출 수 있습니다. F-16 비행기 지표의 강력함을 경험해 보세요. 이 지표는 시장 트렌드를 정확하고 민첩하게 탐색하며
RFI levels PRO
Roman Podpora
사전 지표       시장 반전 수준과 영역을 파악하여   가격이 해당 수준으로 되돌아올 때까지 기다렸다가 새로운 추세의 시작점에서 진입할 수 있도록 해줍니다. 즉, 추세의 끝에서 진입하는 것이 아닙니다. 그는 보여준다       반전 수준       시장이 방향 전환을 확인하고 추가적인 움직임을 형성하는 지점입니다. 이 지표는 차트를 다시 그릴 필요 없이 작동하며, 모든 금융 상품에 최적화되어 있고, 특정 금융 상품과 함께 사용할 때 최대의 잠재력을 발휘합니다.       트렌드 라인즈 프로       지시자. 모든 계측기에 적용 가능한 가역 구조 스캐너 모든 거래 상품을 자동으로 추적하고 모든 R-반전 패턴을 즉시 식별하여 LOGIC AI 신호가 이미 존재하는 위치와 기타 유용한 정보를 표시합니다. 로직 AI – 진입점을 표시해주는 도우미 시장 진입에 가장 적합한 시점을 판단하는 지능형 신호입니다. TPSproSYSTEM 알고리즘을 사용하여 가격 변동, 추세 및 주요 시장 참
Friends, we present to your attention our new Forex Gump Laser indicator. Since there are no designers in our team, but mainly mathematicians, financiers, programmers and traders, we did not make any special changes in the indicator design. In appearance, it resembles the usual Forex Gump. On the other hand, Forex Gump has become not just the name of an indicator, it is a brand. And we try to preserve the corporate identity in all its varieties. The whole essence of the indicator in its operatio
Currency Strength Meter Pro for MT4
ALEKSANDR SHUKALOVICH
4.3 (10)
Currency Strength Meter is the easiest way to identify strong and weak currencies. This indicator shows the relative strength of 8 major currencies + Gold: AUD, CAD, CHF, EUR, GBP, JPY, NZD, USD, XAU. Gold symbol can be changed to other symbols like XAG, XAU etc. By default the strength value is normalised to the range from 0 to 100 for RSI algorithm: The value above 60 means strong currency; The value below 40 means weak currency; This indicator needs the data of all 28 major currency pairs
이 지표는 실제 거래에 완벽한 자동 파동 분석 지표입니다! 사례... 참고:   웨이브 그레이딩에 서양식 이름을 사용하는 데 익숙하지 않습니다. Tang Lun(Tang Zhong Shuo Zen)의 명명 규칙의 영향으로 기본 웨이브를   펜   으로 명명하고 2차 웨이브 밴드를   세그먼트   로 명명했습니다. 동시에, 세그먼트에는 추세 방향이 있습니다.   주요 추세 세그먼트에는   이름이 지정되지만(이 이름 지정 방법은 향후 노트에서 사용됩니다. 먼저 말씀드리겠습니다.) 알고리즘은 굴곡 이론과 거의 관련이 없으므로 그렇게 해서는 안 됩니다. 이는 나의 시장 분석을   통해 요약된 끊임없이 변화하고 복잡한 운영 규칙을   반영합니다. 밴드는 더 이상 사람마다 다르지 않도록 표준화되고 정의되었습니다. 인위적인 간섭의 드로잉 방법은 시장 진입을 엄격하게 분석하는 데 핵심적인 역할을 합니다. 이 지표를 사용하는 것은 거래 인터페이스의 미학을 개선하고 원래의 K-line 거래를
WOW Scalper Signal
Nirundorn Promphao
The principle of this indicator is very simple: detecting the trend with Moving Average, then monitoring the return point of graph by using the crossing of Stochastic Oscillator and finally predicting BUY and SELL signal with arrows, alerts and notifications. The parameters are fixed and automatically calculated on each time frame. Example: If you install indicator on EURUSD, timeframe M5: the indicator will detect the main trend with the Moving Average on this timeframe (for example the Moving
Advanced Currency Strength28 Indicator
Bernhard Schweigert
4.91 (657)
현재 26% 할인 초보자 또는 전문가 트레이더를 위한 최고의 솔루션! 이 지표는 우리가 독점 기능과 새로운 공식을 통합했기 때문에 독특하고 고품질이며 저렴한 거래 도구입니다. 단 하나의 차트로 28 Forex 쌍의 통화 강도를 읽을 수 있습니다! 새로운 추세 또는 스캘핑 기회의 정확한 트리거 포인트를 정확히 찾아낼 수 있기 때문에 거래가 어떻게 개선될지 상상해 보십시오. 사용 설명서: 여기를 클릭  https://www.mql5.com/en/blogs/post/697384 그것이 첫 번째, 원본입니다! 쓸모없는 지망생 클론을 사지 마십시오. 더 스페셜  강력한 통화 모멘텀을 보여주는 하위 창의 화살표 GAP가 거래를 안내합니다! 기본 또는 호가 통화가 과매도/과매도 영역(외부 시장 피보나치 수준)에 있을 때 개별 차트의 기본 창에 경고 표시가 나타납니다. 통화 강도가 외부 범위에서 떨어질 때 풀백/반전 경고. 교차 패턴의 특별 경고 추세를 빠르게 볼 수 있는 다중 시간
Advanced Supply Demand
Bernhard Schweigert
4.91 (296)
현재 33% 할인! 초보자나 전문 트레이더를 위한 최고의 솔루션! 이 보조지표는 우리가 다수의 독창적 기능과 새로운 공식을 통합한 독특하고 고품질이며 저렴한 거래 도구입니다. 이 업데이트를 통해 이중 시간대를 표시할 수 있습니다. 더 높은 TF를 표시할 수 있을 뿐만 아니라 차트 TF와 더 높은 TF 모두를 표시할 수 있습니다: 중첩 영역 표시. 모든 Supply Demand 트레이더들이 좋아할 것입니다. :) 중요한 정보 공개 Advanced Supply Demand의 잠재력을 극대화하려면 다음을 방문하십시오. https://www.mql5.com/ko/blogs/post/720245   진입 또는 목표의 명확한 트리거 포인트를 정확히 찾아냄으로 해서 거래가 어떻게 개선될지 상상해 보십시오. 새로운 알고리즘을 기반으로 매수자와 매도자 간의 잠재적인 불균형을 훨씬 더 쉽게 분간할 수 있습니다. 왜냐하면 가장 강한 공급영역과 가장 강한 수요 영역과 과거에 어떻게 진행 되었는지를(이전
Market Steps MT4
Mahdi Ebrahimzadeh
5 (2)
시장 단계 표시기는 Gann 시간/가격 상관 관계를 기반으로 설계 및 구축되었으며 Forex 시장에 대한 가격 조치 특정 규칙에 따라 최적화됩니다. 시장 주문 흐름 개념을 사용하여 대량 주문에 대한 잠재적 가격 영역을 예측합니다. 지표 수준은 거래 자체에 사용하거나 다른 전략/지표의 잘못된 신호를 필터링하기 위한 조합으로 사용할 수 있습니다. 모든 거래자는 차트에 다중 시간 프레임(TF) 영역과 가격 변동 가능성을 함께 표시할 수 있는 강력한 도구가 필요합니다. 테스터 모드에서 파워를 테스트하여 레벨이 차트보다 어떻게 가격을 책정하는지 확인할 수 있습니다. 표시기 장점: 두 개의 서로 다른 영역이 있는 마킹 차트는 서로 다른 TF에 대한 추세 및 범위 시장을 지정합니다. Price Action 거래자는 이를 사용하여 다른 TF/가격 구역의 주문 흐름을 식별하거나 FTR(Fail To Return)/FTC(Fail To Continue)를 확인할 수 있습니다. 시장의 휘발성 및
[ MT5 Version ] Supply and Demand Multitimeframe Supply and Demand Multitimeframe is the first indicator in the market that combines multiple aspects like trading volume, price structure and momentum to identify Supply and Demand zones for every asset. The Supply and Demand indicator analyzes simultaneously up to 4 different TFs and represents their information in the current graph. Its interactive UI highlights everytime the price enters a Supply or Demand zone even if the zones are not visibl
제작자의 제품 더 보기
World Trend
Tatiana Savkevych
5 (1)
World Trend is a hybrid trend indicator, as it is based on the signals of elementary indicators and a special algorithm for analysis. The indicator shows favorable moments for entering the market. The intelligent algorithm of the indicator determines the trend, filters out market noise and generates entry signals. You can use the indicator as the main one to determine the trend. The indicator can work both for entry points and as a filter. Uses two options for settings. The indicator uses colo
Smart Analiz
Tatiana Savkevych
Working with the Smart Analiz indicator is very simple - you just react to the arrows that the indicator reflects, that is, the arrow is a command for action. The indicator signals are accurate enough and you can trade using this information! The indicator builds a very high-quality channel in which it generates entry signals! Which is the ideal strategy for a trader as the trader is always hesitant when choosing a strategy to work with. That is, this indicator will allow you to solve the dilemm
Beautiful
Tatiana Savkevych
The Beautiful indicator shows potential market reversal points. The intelligent algorithm of the indicator detects the trend well, filters out market noise and generates input signals and exit levels. Uses just one parameter for settings. Simple, visual and efficient trend detection. The indicator does not redraw and does not lag. You can set up message alerts as sound or email. Works on all currency pairs and on all timeframes. Ready-made trading system.
Arrows Forecasters
Tatiana Savkevych
The Arrows Forecasters indicator is simple, visual and effective trend detection. The intelligent algorithm of the indicator determines the trend with a good probability. Uses just one parameter for settings. The indicator shows the points of potential market reversal. Ready-made trading system. The indicator does not redraw and does not lag. Works on all currency pairs and on all timeframes. You should remember that using a combination of forecasting tools, it is advisable to choose 2-3 indic
Balanced Costing
Tatiana Savkevych
Balanced Costing - shows signals - can be used with an optimal risk factor. The indicator can be used both for pipsing on small periods and for long-term trading. The Balanced Costing trend indicator uses reliable algorithms in its calculations. Shows favorable moments for entering the market with arrows, that is, using the indicator is quite simple. Works on all currency pairs and on all timeframes. Of course, the approach to trading should be complex and in order to make a decision, you shou
Signal Point Channel
Tatiana Savkevych
The Signal Point Channel indicator predicts the most likely short-term price movement based on complex mathematical calculations. One of the biggest challenges traders face is finding a trading system that's right for them. This indicator is designed to detect trends in price movement and allows you to quickly determine not only the direction of the trend, but also to understand the levels of interaction between buyers and sellers. It has no settings and therefore can be perceived as it signals.
Transition Trend
Tatiana Savkevych
The Transition Trend indicator shows the points of potential market reversal. The indicator's smart algorithm detects the trend, filters out market noise and generates entry signals and exit levels. Simple, visual and efficient trend detection. Uses just one parameter for settings. The indicator does not redraw and does not lag. You can set up message alerts as sound or email. Works on all currency pairs and all timeframes. Ready-made trading system.
Generic Trend
Tatiana Savkevych
The Generic Trend indicator is a trend type indicator. It smooths out price fluctuations when generating a signal by averaging the data and the signal only at certain moments! In those moments when you need to make a decision to enter a position and give the trader a direction. The indicator gives the trader the opportunity to visually determine which trend will be present at a particular time interval. This indicator was created to quickly determine the situation in the market, reflect the st
Trend Privacy
Tatiana Savkevych
The Trend Privacy indicator is easy to set up and works on all pairs and all time frames. Identifies the mainstream and helps analyze the market at a selected time frame It is extremely important for any trader to correctly determine the direction and strength of the trend movement. Unfortunately, there is no single correct solution to this problem. Many traders trade on different time frames. For this reason, the received signals are perceived subjectively. Trend indicators provide an opportu
Chaos Trend
Tatiana Savkevych
Chaos Trend is an arrow indicator for identifying potential entry points. I like it, first of all, because it has a simple mechanism of work, adaptation to all time periods and trading tactics. More reliably, the Forex Chaos Trend indicator is a real trading strategy with which you can achieve the desired results. As soon as the Chaos Trend indicator is installed, the main indicators for the price of the traded pair will immediately begin to be recalculated, based on the postulates of technica
Channel Smooth
Tatiana Savkevych
Channel Smooth - Forex channel indicator is a very useful and relevant tool for any trader, thanks to which you can efficiently and competently perform plotting on the chart, including automatically, without wasting time on independent calculations and eliminating the risk of incorrect point selection. Channels are needed to trade channel strategies that involve working within a certain price range. The key difference between the Channel Smooth indicator and other channel indicators (for examp
Trend Improved
Tatiana Savkevych
Trend Improved - Arrow trend indicator, without lagging and redrawing, is used by traders in trending strategies in trading on financial markets (Forex, CFDs, binary options). Key parameter MinAngle - The parameter is set in pips. For each instrument, select individually, start from scratch. If the parameter is too large then there will be no signals. The tool, at the very least, deserves attention for its signal accuracy and intuitiveness. Increasing the Period parameters decreases the numbe
Forex Roulette
Tatiana Savkevych
Forex Roulette - Trend Following Strategy! The most reliable indicator is used for the trend - the moving average. Only for the global trend, then the strategy itself is implemented. On screenshots, testing from $ 10,000, but the bot works without problems with $ 100. The first graph is optimization, the second is forecast. You can repeat yourself on another period, observing the principle indicated below. How the bot works. Optimization for the m15 period, after which works for 3 months. Very
Projection Trend
Tatiana Savkevych
Projection Trend - a Forex arrow indicator without redrawing does not change its signals when the market situation changes, does not adjust to the chart. The signals given by him are unambiguous. Traders build a trading system that provides good signals 80-90% of the time. The indicator showing the points of entry and exit from the market with arrows is able to bring results not only in the Forex market, but also when working with binary options. You can buy it and install it in MetaTrader you
Calc Trend Ex
Tatiana Savkevych
Calc Trend Ex is a forex trending bot based on the Calc Trend indicator. A bot created on the basis of this Calc Trend indicator and working on the principle - if there is an indicator signal, then the bot has closed an opposite deal and opened a new deal in the specified direction, it can be downloaded and used for work. The bot is as simple as possible! The bot fully reflects the work of the indicator. Moreover, the bot can be optimized (by optimizing the parameters of the indicator itself)
First Derivative RSI
Tatiana Savkevych
First Derivative RSI is a forex indicator based on all familiar RSI, based on the first derivative of the price function. The indicator combines the functionality of an oscillator and a trend indicator. At the bottom of the chart, a part of the indicator similar to the RSI will be displayed, but only calculated as the first derivative of the price. On the chart itself, trend signals will be displayed by arrows, they are filtered by the algorithm and always alternate buy / sell. It also shows th
Trend First Derivative RSI is a Forex indicator based on all familiar RSI, based on the first derivative of the price function. On the chart itself, trend signals will be displayed by arrows, they are filtered by the algorithm and always alternate buy / sell. It also shows the number of profitable pips that the indicator can give at the specified interval (LimitCalcHistory). The indicator has a parameter (Spread), which deducts a part of the profit per spread for each signal. To control the pe
Trend First Derivative RSI is a Forex trending bot based on the First Derivative RSI indicator. In the screenshots you can see tests that show the bot can work for 1,3,6 years, the timeframe is one hour. These are demo tests that show that it is realistic to go through significant sections of history with a different indicator and simple rules. Below in the text you will see a description of the rules of work. For real work, optimization is proposed for 3-12 months and work up to 1-2 months. O
Second Derivative RSI is a forex indicator based on all familiar RSI, based on the second derivative of the price function. Just a note on the use of the indicator. The indicator requires selection of settings not only for each currency pair but also for each timeframe. If there is no setting, then as a last resort, the indicator may not show signals! In order to pick up the settings, just use a bot that will help you do it. The indicator combines the functionality of an oscillator and a tren
Trend Second Derivative RSI is a forex indicator based on the usual RSI, based on the second derivative of the price function. On the chart itself, trend signals will be displayed by arrows, they are filtered by the algorithm and always alternate buy / sell. It also shows the number of profitable pips that the indicator can give at the specified interval (LimitCalcHistory). The indicator has a parameter (Spread), which deducts a part of the profit per spread for each signal. Immediately notice
Trend Second Derivative RSI Ex is a forex trending bot based on the Trend Second Derivative RSI indicator. Principle of operation. A bot created on the basis of this Trend Second Derivative RSI indicator and working on the principle - if there is an indicator signal, then the bot has closed the opposite deal and opened a new deal in the specified direction. It is also possible to work only for buy or sell, in which case the bot will simply close the deal without opening it in the opposite dire
Intel Trend
Tatiana Savkevych
Intel Trend is a forex trend indicator based on all the usual SAR, using differential calculus to generate a signal not directly from the price but from the derivative of the function. Also, when using the SAR indicator, the first point often changes, which is why the default parameter ShiftBar = 1. To skip the first baoa and read information directly from the second bar. If you set ShiftBar = 0, there will be perfect signals, but they are false. real signals for each timeframe and for each cur
Intel Trend Ex
Tatiana Savkevych
Intel Trend Ex is a forex trending bot based on the Intel Trend indicator. Principle of operation. A bot created on the basis of this Intel Trend indicator and working on the principle - if there is an indicator signal, then the bot has closed an opposite deal and opened a new deal in the specified direction. It is also possible to work only for buy or sell, in which case the bot will simply close the deal without opening it in the opposite direction. The bot is also equipped with an adaptive
Nuremberg
Tatiana Savkevych
The Nuremberg tool presents a channel-like algorithm. The best arrow algorithms use channels without redrawing. Its settings indicate the parameters of the length and width of the channel. The indicator was created in such a way that you can fix the reaction to the channel breakout and display it in the form of an arrow. Arrow indicator Nuremberg on Forex indicates points of entry into transactions without redrawing. It generates fairly frequent and accurate signals. When an upward arrow appea
Unchained
Tatiana Savkevych
Unchained is intended for scalping trading. It is used to trade on five and fifteen-minute timeframes. But it works on H1 and higher too. According to the traders themselves, the best arrow indicator is the one that does not redraw, i.e. does not imply changes in indicators. When an upward arrow appears on the chart, the trader opens a buy order. If a downward arrow appears during trading, the buy order is closed. After analyzing the situation in this case, you can open a sell position. It is
Clustering Trend
Tatiana Savkevych
Clustering Trend is always in operation - after the first position, provided that the position is not closed with stops. You can test the bot on any part of the history, the bot is configured to pass the entire history, but if you need to increase productivity in a specific area, you can optimize the bot for more productive work, but in a shorter part of the history. The bot works without trailing stops, breakevens or anything like that. The principle of operation is that there is a signal, th
Toroid
Tatiana Savkevych
Toroid - The indicator reflects information in a visual form, it can be used both for pipsing on small periods and for long-term trading. It generates fairly frequent and accurate signals. The indicator can be used as the main one for determining the trend. The indicator can work both for entry points and as a filter. Uses two parameters for settings. The smart indicator algorithm detects the trend, filters out market noise and generates input signals. It is based on the signals of elementary in
Platoon
Tatiana Savkevych
Platoon is an indicator designed to be able to detect a bottom or top similar to the Fractals indicator, but of course a different algorithm is used. In other words, you should not enter into a buy deal if the fractal is below. And you should not enter into a sell deal if the fractal is higher. The indicator only denotes fractals on the chart without performing any additional calculations, therefore, theoretically, any trader can find these patterns by himself. But what is a fractal, how exact
Provided
Tatiana Savkevych
Provided is a trend trading Expert Advisor based on the simplest indicator strategy of following the market towards global price movements. The robot can effectively trade on almost any trading asset or currency pair, but subject to proper optimization. It is recommended to use the robot on the hourly chart of the Euro / Dollar currency pair. List of all settings: Magic - Magic number. StartVolume - Sets the lot size for entering the market. OnRisk - Activates Money Management. PercentRisk - A
About
Tatiana Savkevych
About - Forex indicator. This trend indicator is used to determine the current trend in price movement, making it clear in which direction it is better to open a position: buy or sell. The About trend indicator is displayed on the chart and moves in parallel with the price. The Forex About trend indicator allows you to determine in time a change in the direction of price movement, thereby minimizing the likelihood of capital loss. In trading practice, various combinations of About and other ind
필터:
리뷰 없음
리뷰 답변