Aroon crossover dashboard MT5
- 지표
-
The Huy Phan
 Contact info:
+Email: huyphanthe47@gmail.com
+Skype: live:metatradereafx
+Telegram: huyphanthe47
Create a job for me: - 버전: 5.0
- 업데이트됨: 15 11월 2024
- 활성화: 10
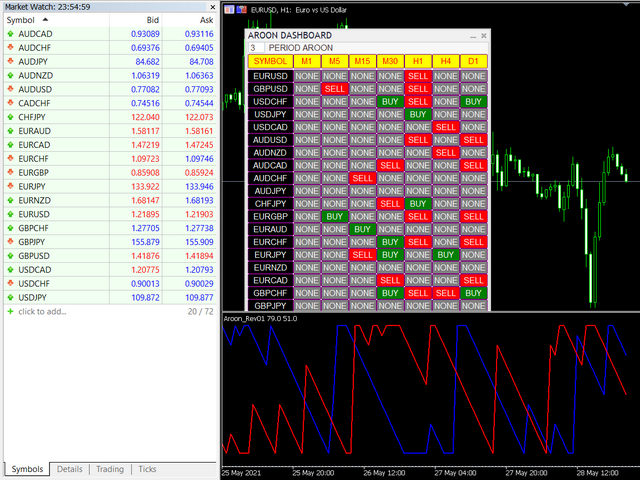
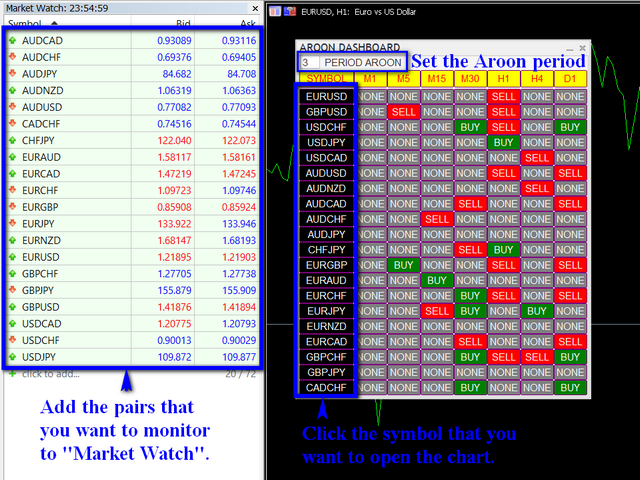
Aroon crossover Dashboard uses the value of Aroon indicator. The Aroon period can be adjusted via the Edit box of this dashboard.
The monitoring pairs will be selected by adding to the Market Watch (no need to set prefixes or suffixes), you can monitor many pairs as you like.
This dashboard will check almost popular time frame (M1,M5,M15,M30,H1,H4 and D1). The colors can be customized.
The Aroon indicator has been included in to this Dashboard, you do not need purchasing it.
Crossover signal can be sent to you screen, your phone (via notification), your email or your telegram channel.
We can have a look at many pairs and many time frames without opening many charts. In addition, we can jump to the chart quickly if we want.
Note:
1. Aroon indicator has been included in to the Dashboard.
2. If you want to monitor new pair, please add that pair to "Market Watch" then run your indicator again.
3. If you want to send message to your email or your telegram channel, please setup that info on your platform firstly.