ZigZag2LineLT
- 지표
-
Alberto Da Silva Lira
 Profissional especializado em consultoria em tecnologia com enfase em infraestrutura, também programador MQL5 e consultor daytrade do mercado brasileiro B3.
 - 버전: 3.2
- 업데이트됨: 1 6월 2021
- 활성화: 5
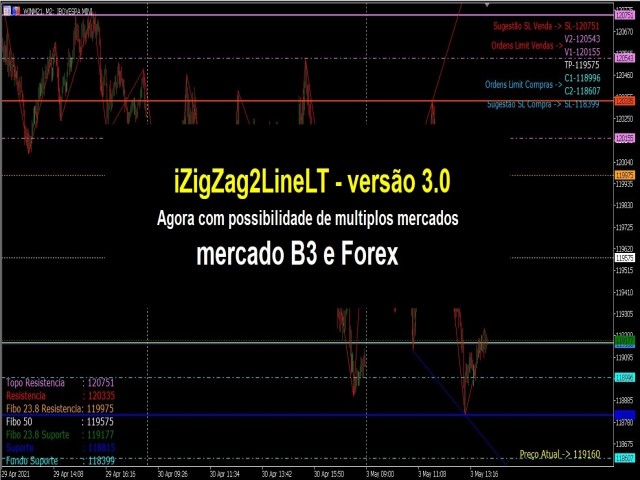
- iZigZag2LineLT
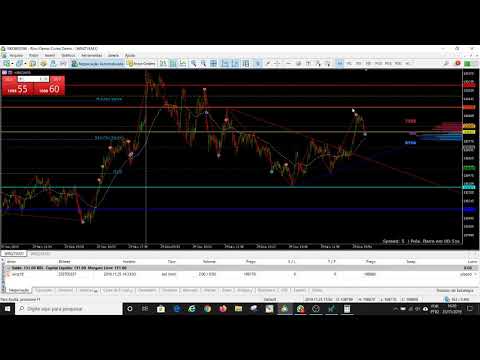
New version 3.0 of the iZigZag2LineLT indicator where it is possible to search for possible exhaustion regions of the market looking for small or large reversals, it follows the same characteristics contained in the indicator of the LTB and LTA lines, Fibonacci, Supports and Resistances with the application of Market Undecided zones (improved version of Stop or Move by Sato´s), in these areas suggestions (through the dotted lines) appear to include pending orders always looking for the most consolidated reversals.
In this special version we have readings of suggestions for limit order entries, always observing the indecisive zones of the market.
Great application in the Brazilian B3 and Forex market, mainly observing Daytrade;
Information and downloads of updated versions or demo, access one of the links below:
Telegram LiraInvest - http://bit.ly/374vxZp
For download:
- EAs: http://bit.ly/3rsmGLs
- Indicators: http://bit.ly/3hg13cd
사용자가 평가에 대한 코멘트를 남기지 않았습니다