LinearVelocity

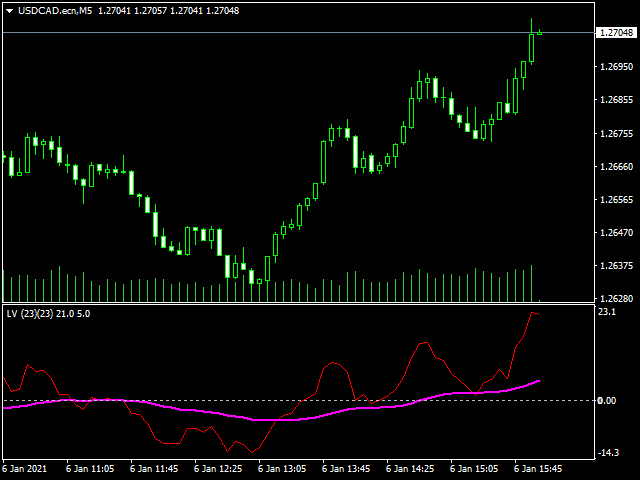
LinearVelocity Indicator

Velocity is Distance/Time

where Distance is Close-Open basicly.

Linear velocity; calculated with tick volume*Velocity in smoothed way.

Red line shows LinearVelocity based of zero level in that way.

And Magenta line is Moving avrages of LinearVelocity.

Final Indicator helps you detecting trend in different timeframes.

Default input parameters for M5 timeframe, and you can change them for different timeframes and different pairs.

I wish you good profits.


추천 제품
The   Trendlines Oscillator   helps traders identify trends and momentum based on the normalized distances between the current price and the most recently detected bullish and bearish trend lines. The indicator features bullish and bearish momentum, a signal line with crossings, and multiple smoothing options. USAGE The   Trendlines Oscillator   works by systematically: Identifying pivot highs and lows. Connecting pivots to form bullish (support) and bearish (resistance) trendlines. Measuring
Power Renko MT4
Pierce Vallieres
Power Renko is an indicator which plots Renko bricks underneath the chart using a histogram. You can select the brick size and the timeframe of the Renko bricks as well as whether or not to use the close price or the high/low price of the candles. Renko bricks are based on price alone, not time, therefor the Renko bricks will not be aligned with the chart's time. They are extremely useful for trend trading and many different strategies can be formed from them. Buffers are provided allowing you t
Delta Fusion Pro
Francesco Secchi
5 (2)
Delta Fusion Pro – 인트라데이 트레이딩을 위한 고급 주문 흐름 분석 Delta Fusion Pro는 MetaTrader 4용 전문 지표로, 공격적인 주문 흐름을 드러내고 기관 압력의 강도와 방향을 실시간으로 보여줍니다. 기존의 거래량 지표와 달리, Ask와 Bid 거래량 간의 델타를 분석하여 반전 예측, 추세 확인 및 전문 관심 영역을 식별합니다. 주요 특징 지능형 자동 조정 시스템 다음 조건에 따라 모든 매개변수를 자동으로 조정합니다: 상품 유형 (외환, 암호화폐, 지수, 원자재, 주식) 운영 타임프레임 시장 변동성 (ATR) 최근 평균 거래량 초보 트레이더를 위한 수동 설정 없음 – 지표가 자동으로 보정됩니다! 기능 NetDelta 및 누적 델타 Ask/Bid 공격적 거래량 차이 계산, 사용자 지정 EMA 스무딩 실시간 방향 압력 시각화 히스토그램 색상 사용자 지정 (매수/매도) 가격/거래량 다이버전스 일반 및 숨겨진 다이버전스 자동 감지 강도 분류: 강/중/
Auto Fibo Pro m
DMITRII GRIDASOV
"Auto FIBO Pro" Crypto_Forex 지표 - 거래에 유용한 보조 도구입니다! - 지표는 자동으로 Fibo 수준과 로컬 추세선(빨간색)을 계산하여 차트에 배치합니다. - Fibonacci 수준은 가격이 반전될 수 있는 주요 영역을 나타냅니다. - 가장 중요한 수준은 23.6%, 38.2%, 50%, 61.8%입니다. - 역전 스캘핑이나 존 그리드 거래에 사용할 수 있습니다. - Auto FIBO Pro 지표를 사용하여 현재 시스템을 개선할 수 있는 기회도 많습니다. - Info Spread Swap Display가 있습니다. 현재 Spread와 Swap이 부착된 외환 쌍을 표시합니다. - 디스플레이에는 계정 잔액, 자본 및 마진도 표시됩니다. - 차트의 어느 모서리에서나 Info Spread Swap Display를 찾을 수 있습니다. 0 - 왼쪽 상단 모서리, 1 - 오른쪽 상단, 2 - 왼쪽 하단, 3 - 오른쪽 하단. 여기를 클릭하여 고품질 트레이딩 로봇과
Rua TrailingStop BreakEven Little
PHAM KIM QUY RuaCoder
4.5 (2)
Rua TrailingStop BreakEven Little The EA not for Real Account. You can EA for Real Account with link:   https://www.mql5.com/en/market/product/47635 Uses of EA - Trailingstop: Move stoploss continuously. - Breakeven: Move the stoploss once. Custom parameters: All OrderOpenTime:     + true: acts on all order     + false: only affect the order opened since EA run All OrderType:     + true: acts on all order.     + false: only the order is running (Buy, Sell) TraillingStop: true (Use), false (do n
FREE
The indicator detects and displays М. Gartley's Butterfly pattern. The pattern is plotted by the extreme values of the ZigZag indicator (included in the resources, no need to install). After detecting the pattern, the indicator notifies of that by the pop-up window, a mobile notification and an email. The pattern and wave parameters are displayed on the screenshots. The default parameters are used for demonstration purposes only in order to increase the amount of detected patterns. Parameters z
MACD Display is a MACD disaplay and cross monitoring indicator,which can works on 6 timeframe at same time. Indicator advantage: 1. Deviation from the point can be drawn on the main picture and indicator drawing. It is convenient to observe and can be hidden or displayed by parameter setting. 2. Deviation from the entry point is clearly indicated by the arrow in the drawing. 3. Cross-cycle monitoring can simultaneously monitor the MACD deviation and the golden dead fork of the six-cycle framewor
Smoothed Heiken Ashi with AC/AO Zones – Professional Trading Clarity Transform your Heiken Ashi analysis with intelligent smoothing that eliminates noise while preserving actionable signals. What Makes This Different? This isn't just another Heiken Ashi indicator. We've engineered a sophisticated smoothing engine that works with the Accelerator (AC) and Awesome Oscillator (AO) zone logic to give you cleaner entries and exits without sacrificing responsiveness. Four Smoothing Methods at Your Comm
Adaptive Trade Master No need to say anything. It will prove itself. Here is the Login Information. Account No : 1420442547 Investor Password : ATM1002 Server : IronFX-Demo1 Images are not from the backtest. It is taken from order history (Forward Test).  Newer trust to backtest results. And you can use it on any pair, even on BTCUSD too. Please watch it and give me your review. The " Adaptive Trade Master " is an advanced MetaTrader Expert Advisor designed to automate trading decisions based
The Level Moving Averages Message indicator ( see the description and video ) does not draw the Moving Average line in the chart window but marks the Moving Average level on all time frames in accordance with the specified parameters. The level move frequency corresponds to the TimeFrame parameter value specified. The advantage of this indicator lies in the fact that it offers the possibility of monitoring the interaction between the price and the MA of a higher time frame on a lower one (e.g.,
Nice Trade Point
Muhammed Emin Ugur
This    Nice Trade Point     indicator is designed for signal trading. This indicator generates trend signals. It uses many algorithms and indicators to generate this signal. It tries to generate a signal from the points with the highest trend potential. This indicator is a complete trading product. This indicator does not need any additional indicators. The indicator certainly does not repaint. The point at which the signal is given does not change.     Features and Suggestions Time Frame
Trend Ray
Andriy Sydoruk
The indicator shows the potential trend direction by cyclical-wave dependence. Thus, all the rays of the intersection will be optimal rays, in the direction of which the price is expected to move, taking into account the indicator period. Rays can be used as a direction for potential market movement. But we must not forget that the approach must be comprehensive, the indicator signals require additional information to enter the market.
Pirate
Anatoliy Lukanin
3.9 (20)
Deposit :   from 100 deposit units Trading pairs: I recommend currency pairs: EURAUD, CHFJPY, EURCHF, EURGBP, AUDCHF, CADCHF, USDCHF. Trading period :  Any Account: You should use ECN-ECN.Pro accounts with five-digit quotes with a moderate size (spread). Parameters: USING - Choice, trading risk or fixed lot RISK/LOT - Lot Risk Value RESTORING_THE_BALANCE - Restoring balance* HOW_THE_RESET_WINDOW - Reset the Global Variable TAKE_PROFIT - Set profit STOP_LOSS - Set loss COUNT_BUY - The number of s
The indicator detects and displays Shark harmonic pattern (see the screenshot). The pattern is plotted by the extreme values of the ZigZag indicator (included in the resources, no need to install). After detecting the pattern, the indicator notifies of that by a pop-up window, a mobile notification and an email. The indicator highlights the process of the pattern formation and not just the complete pattern. In the former case, it is displayed in the contour triangles. After the pattern is comple
Powered by SVX Strategies Quant Team This indicator automates the identification of critical price levels based on higher timeframe market structure. It projects significant highs and lows directly onto your chart. Looking for Fully Automated Trading? While this tool helps with manual analysis, our institutional algorithms handle execution automatically. Copy our official signals here: Copy "Friday Pulse" (Conservative/Stable) Copy "SVX AI Systems" (High Growth) HOW IT WORKS Forget drawing lin
FREE
Trendiness Index
Libertas LLC
5 (3)
"The trend is your friend" is one of the best known sayings in investing, because capturing large trendy price movements can be extremely profitable. However, trading with the trend is often easier said than done, because many indicators are based on price reversals not trends. These aren't very effective at identifying trendy periods, or predicting whether trends will continue. We developed the Trendiness Index to help address this problem by indicating the strength and direction of price trend
Quantum Falcon Signal Free is a smart visual trading indicator for MetaTrader 4 designed for Forex and Gold traders. The indicator combines: • Trend analysis • RSI momentum confirmation • MACD momentum filtering • ATR volatility filtering • Higher timeframe confirmation • Smart exit signal detection Main Features: • Smart Buy and Sell signals • Exit Buy / Exit Sell alerts • Real-time dashboard on chart • Professional candle arrows • Multi-timeframe trend confirmation • ATR market volatility filt
FREE
Chart Patterns Detect 15 patterns (Ascending Triangle, Descending Triangle, Rising Wedge, Falling Wedge, Bullish Flag, Bearish Flag, Bullish Rectangle, Bearish Rectangle Symmetrical triangle, Head and Shoulders, Inverted Head and Shoulders, Triple top, Triple Bottom, Double Top, Double Bottom) Use historical data to calculate the probability of each pattern to succeed (possibility to filter notification according to the chance of success) gives graphic indication about the invalidation level and
SuperTrend for MT4
Ulises Calderon Bautista
The popular "SuperTrend" indicator is a technical analysis tool designed to help identify trend direction and potential entry or exit points in financial markets. This indicator is built upon the Average True Range (ATR) , which gauges market volatility based on price ranges. It is available for free on other platforms, and this should be no exception! Common Use Cases The SuperTrend is typically utilized in three primary ways: Trend Identification: When the price is trading above the indicator
FREE
TrendMaster Alert Pro
Andrei Telegin
5 (1)
TrendMaster Pro Alert: Your Professional Manual Trading Station Stop chasing the market and start leading it.   TrendMaster Pro Alert   is an interactive trading dashboard designed to simplify complex analysis and execute flawless trades. Key Features of TrendMaster Pro: Multi-Tier Trend Control:   Stay on the right side of the market by monitoring M15, H1, and H4 trends simultaneously. No more trading against the major flow. Advanced Filter Suite:   A powerful blend of ADX (momentum), RSI, and
FREE
Crypto_Forex 지표 HTF Ichimoku for MT4. - Ichimoku 지표는 가장 강력한 트렌드 지표 중 하나입니다. HTF는 - Higher Time Frame을 의미합니다. - 이 지표는 트렌드 트레이더와 가격 액션 항목과의 조합에 탁월합니다. - HTF Ichimoku 지표를 사용하면 더 높은 타임프레임의 Ichimoku를 현재 차트에 첨부할 수 있습니다. - 상승 추세 - 파란색 선 위에 빨간색 선(두 선 모두 클라우드 위에 있음) / 하락 추세 - 파란색 선 아래에 빨간색 선(두 선 모두 클라우드 아래에 있음). - 가격이 Ichimoku 클라우드 상단 테두리를 돌파했을 때만 BUY 주문을 엽니다. - 가격이 Ichimoku 클라우드 하단 테두리를 돌파했을 때만 SELL 주문을 엽니다. - HTF Ichimoku 지표는 큰 트렌드를 포착할 수 있는 기회를 제공합니다. 여기를 클릭하여 고품질 트레이딩 로봇과 지표를 확인하세요! 이 MQL5 웹사이트에서만
Color Macd Tf
Syarif Nur Arief
5 (1)
MACD is well known indicator that still can be use for prediction where price will go next few minutes, hours or even weekly  With colored bar of Macd, your eyes can easily catch when color is changed based what market price movement to find any early trend on market. here is the parameter of the indicator: TF_MACD , default is 1 Hour , this mean you can see clearly MACD of 1 Hour TimeFrame on Lower TimeFrame. InpPrice , default is Price Close , this is original MACD parameter from Metaquotes st
FREE
Smart FVG indicator MT4
Ahmad Kazbar
4.67 (3)
Smart FVG 인디케이터 MT4 – MetaTrader 4를 위한 고급 Fair Value Gap 탐지 Smart FVG 인디케이터 MT4는 MetaTrader 4 차트에서 Fair Value Gap(FVG)을 전문적으로 탐지하고, 모니터링하며, 알림까지 제공하는 도구입니다. ATR 기반 필터링과 시장 구조를 인식하는 로직을 결합하여 노이즈를 줄이고, 유동성 환경에 맞게 자동으로 적응하며, 매매 의사결정에 중요한 불균형 구간만 남겨 줍니다. 주요 장점 정확한 FVG 탐지: 단순한 캔들 갭이 아닌 실제 시장 비효율 구간을 식별합니다. ATR 기반 정밀도: 다양한 상품과 시간 프레임에서 저품질 신호를 걸러내는 적응형 민감도. 실시간 유효성 추적: 가격이 해당 구간을 메우거나 돌파하면 존이 자동으로 연장·조정·삭제됩니다. 사용자 정의 가능한 시각화: 색상, 선 스타일, 채우기 옵션을 템플릿에 맞게 자유롭게 설정 가능. 실질적인 알림: 새로 생성된 FVG, 메워진 FVG, 무효화된
FREE
Williams Precision Prime
Steffen Reinhold Noll
5 (2)
Williams Precision Prime – Precision Meets Legend Williams Precision Prime is a high-performance trend-following indicator that bridges the gap between Larry Williams' time-tested logic and modern algorithmic filtering, all wrapped in the exclusive Peak Precision design. Engineered for traders who demand clarity, stability, and mathematically sound entries, this system utilizes a triple-layer EMA strategy (100, 50, and 21) to identify high-probability "Cross-Momentum" setups within a confirmed d
FREE
PABT Pattern Indicator - it's classical system one of the signal patterns. Indicator logic - the Hi & Lo of the bar is fully within the range of the preceding bar, look to trade them as pullback in trend. In the way if indicator found PABT pattern it's drawing two lines and arrow what showing trend way.  - First line - it's entry point and drawing at: 1. On the high of signal bar or on middle of the signal bar (depending from indicator mode) for buy; 2. On the low of signal bar or on middle of t
Candle Countdown — MT4용 정확한 캔들 종료 시간 카운트다운 Candle Countdown은 차트 위에 현재 캔들이 종료될 때까지 남은 시간 을 표시하는 간단하고 정확한 도구입니다. 진입 시점이 캔들 마감에 의존하는 경우, 몇 초의 차이도 중요합니다. 이 인디케이터는 정확한 시간을 보여주어 서두르거나 추측하지 않고 결정을 내릴 수 있도록 도와줍니다. 캔들 종료 시간을 정확하게 제어하기 위한 인디케이터입니다. 표시 내용: 캔들 종료까지 남은 시간 현재 서버 시간 스프레드 Stop Level 타이머는 틱에 의존하지 않고 플랫폼의 내부 타이머를 통해 업데이트되므로, 시장 움직임이 적은 상황에서도 안정적으로 동작합니다. 이로 인해 낮은 변동성 구간에서도 부드럽고 안정적인 카운트다운을 제공합니다. 모든 정보는 배경 블록에 표시되어 어떤 차트 색상에서도 잘 보이며, 차트 분석을 방해하지 않습니다. 캔들 종료 시점이 가까워질수록 타이머 색상이 변경되어 빠르게 상황을 파악할 수
FREE
The indicator detects and displays 3 Drives harmonic pattern (see the screenshot). The pattern is plotted by the extreme values of the ZigZag indicator (included in the resources, no need to install). After detecting the pattern, the indicator notifies of that by a pop-up window, a mobile notification and an email. The indicator highlights the process of the pattern formation and not just the complete pattern. In the former case, it is displayed in the contour triangles. After the pattern is com
Line Magnit
Aleksey Trenin
The LineMagnit Indicator for MT4 is a highly precise tool that builds support and resistance levels which magnetically attract prices. This feature allows traders to easily determine the most probable entry and exit points in the market, as well as identify the market's directional forces, as levels are based on capital inflows into the instrument. Equipped with an intuitively understandable graphical interface, the LineMagnit Indicator enables users to quickly locate and analyze support and res
Shadow Flare MT4
Kestutis Balciunas
Shadow Flare 인디케이터는 MetaTrader 4용 비리페인트형 추세 & 유동성 도구 입니다. 설정 가능한 이동평균 베이스라인(HMA, EMA, SMA 또는 RMA)을 계산하고, 그 주변에 평균진폭범위(ATR) 기반 밴드를 씌워 가격이 상단 또는 하단 밴드를 종가 기준으로 돌파할 때에만 방향이 전환되는 “점착형(Sticky)” 추세 상태를 생성합니다. 동일한 추세 엔진은 피벗 고점·저점을 감지하여 그 주위에 색상 박스를 그린 뒤, 가격이 종가 기준으로 해당 박스를 돌파하는 순간 자동으로 존을 소거(미티게이션)하는 공급/수요 존 모듈도 구동합니다. 매수·매도 신호는 추세 상태가 전환되는 시점에 발생하며, 선택적인 거래량 및 RSI 필터를 통해 약한 신호나 모멘텀에 역행하는 진입을 차단할 수 있습니다. 내장 대시보드는 실시간으로 Trend Bias(추세 바이어스), Momentum(RSI 기반), Volume(거래량)을 보여 줍니다. 팝업, 사운드, 모바일 푸시, 이메일로 구성
FREE
Please note this is a Free version and will only work on EURUSD pair. If you like this product please buy the full EA (FXA Local Trade Copier Pro). FXA LTC is a trade copier for MT4 terminal. This is a fantastic tool for coping trades from one MT4 terminal to many others running on the same PC/VPS. It is extremely easy to setup with minimal settings you can be coping trades in minutes. FXA LTC also caters for Brokers that use different symbol names. FXA LTC will copy trades in 0.5 seconds or le
FREE
이 제품의 구매자들이 또한 구매함
Gann Made Easy
Oleg Rodin
4.83 (163)
Gann Made Easy 는 mr.의 이론을 사용하여 최고의 거래 원칙을 기반으로 하는 전문적이고 사용하기 쉬운 Forex 거래 시스템입니다. W.D. 간. 이 표시기는 Stop Loss 및 Take Profit Levels를 포함하여 정확한 BUY 및 SELL 신호를 제공합니다. PUSH 알림을 사용하여 이동 중에도 거래할 수 있습니다. 구매 후 거래 방법 안내 및 유용한 추가 지표를 무료로 받으시려면 저에게 연락주세요! 아마도 Gann 거래 방법에 대해 이미 여러 번 들었을 것입니다. 일반적으로 Gann의 이론은 초보자 거래자뿐만 아니라 이미 거래 경험이 있는 사람들에게도 매우 복잡한 것입니다. Gann의 거래 방식은 이론적으로 적용하기 쉽지 않기 때문입니다. 나는 그 지식을 연마하고 Forex 지표에 최고의 원칙을 적용하기 위해 몇 년을 보냈습니다. 표시기는 적용하기가 매우 쉽습니다. 차트에 첨부하고 간단한 거래 권장 사항을 따르기만 하면 됩니다. 지표는 지속적으로 시장 분석
Genesis Matrix Pro is a professional multi-timeframe trend detection indicator designed to help traders identify high-quality market alignment with clarity and structure. It combines 12 different technical indicators into one visual alignment matrix, allowing traders to quickly see when market conditions are bullish, bearish, or neutral. A signal is generated only when the selected strategies are aligned, helping reduce noise and improve decision-making. PLEASE CONTACT ME AFTER PURCHASE TO GET
The Propfolio Master Suite is the ultimate all-in-one analytical workstation for professional traders. Combining the power of the Beat The Market Maker (BTMM) methodology, Smart Money Concepts (SND/Liquidity), and Advanced Volume Profile, this suite replaces multiple different indicators with one optimized engine. Monitor up to 14 pairs simultaneously from a single chart, instantly identify market cycles, and seamlessly map institutional footprints with the click of a button. The Command Center
Scalper Inside PRO
Alexey Minkov
4.74 (69)
Scalper Inside PRO Scalper Inside PRO is an intraday trend and scalping indicator for MetaTrader 4 that uses an exclusive algorithm to quickly detect market direction and key target levels. It automatically calculates entry, exit and multiple profit targets, and shows detailed performance statistics so you can see how different instruments and strategies performed. This helps you choose the most suitable trading instruments for the current market conditions. Additionally, you can easily integrat
PZ Harmonacci Patterns
PZ TRADING SLU
3.17 (6)
Trade smarter, not harder: Empower your trading with Harmonacci Patterns This is arguably the most complete harmonic price formation auto-recognition indicator you can find for the MetaTrader Platform. It detects 19 different patterns, takes fibonacci projections as seriously as you do, displays the Potential Reversal Zone (PRZ) and finds suitable stop-loss and take-profit levels. [ Installation Guide | Update Guide | Troubleshooting | FAQ | All Products  ] It detects 19 different harmonic pric
PRO Renko System
Oleg Rodin
5 (30)
PRO Renko System 은 RENKO 차트 거래를 위해 특별히 고안된 매우 정확한 거래 시스템입니다. 이것은 다양한 거래 상품에 적용될 수있는 보편적 인 시스템입니다. 체계는 효과적으로 당신에게 정확한 반전 신호에 접근을 주는 소위 시장 소음을 중화합니다. 이 표시기는 사용하기가 매우 쉽고 신호 생성을 담당하는 매개 변수가 하나만 있습니다. 당신은 쉽게 당신의 선택의 어떤 무역 계기에 공구를 적응시킬 수 있고 renko 막대기의 크기. 나는 항상 당신이 내 소프트웨어로 수익성있게 거래 할 수 있도록 추가 지원을 제공 할 준비가되어 있습니다! 나는 당신에게 행복하고 수익성있는 거래를 기원합니다! 구매 후 저에게 연락하십시오! 내 렌코 차트 생성기를 보내드립니다. 또한 내 개인 권장 사항 및 시스템의 다른 모듈을 무료로 공유 할 것입니다!
Auto Optimized Parabolic RSI: 고급 3D 모멘텀 엔진 대부분의 개인 투자자용 보조지표는 시장의 변동성이 변하는 순간 무용지물이 되는 정적인 입력값에 의존하기 때문에 실패합니다. Auto Optimized Parabolic RSI는 자체적인 수학적 우위를 지속적으로 재계산하여 "보조지표 노후화" 문제를 해결하며, 기관급 퀀트 트레이딩의 적응력을 귀하의 MT5 터미널에 직접 제공합니다. 핵심 이점: 맞춤형 인메모리 3D 최적화   표준 자동 최적화 도구들은 일반적인 보조지표 호출로 터미널에 과부하를 일으켜 MT5 플랫폼을 멈추게 하는 경우가 많습니다. 이 도구는 이러한 병목 현상을 완전히 우회합니다. 맞춤형 네이티브 RAM 기반 계산기로 구축된 내부 엔진은 차트를 로드하거나 타임프레임을 변경할 때마다 빛처럼 빠른 3D 그리드 검색을 실행합니다. RSI 기간(주기), SAR 스텝(가속도) 및 SAR 최대치(속도 제한)를 동시에 스캔하여 플랫폼 지연 없이 수만 개의
NAM Order Blocks
NAM TECH GROUP, CORP.
3.67 (3)
MT4 Multi-timeframe Order Blocks detection indicator. Features - Fully customizable on chart control panel, provides complete interaction. - Hide and show control panel wherever you want. - Detect OBs on multiple timeframes. - Select OBs quantity to display. - Different OBs user interface. - Different filters on OBs. - OB proximity alert. - ADR High and Low lines. - Notification service (Screen alerts | Push notifications). Summary Order block is a market behavior that indicates order collection
Quants HL Break
Ferhat Mutlu
5 (2)
LH 및 HL 브레이크아웃을 찾기 위한 순수 가격 조치에 의한 고급 계산. 그것은 당신에게 시장에서 큰 반전 포인트를 줄 것입니다.LH 및 HL 신호는 traingle 브레이크 아웃에도 사용할 수 있습니다. 브레이크 아웃이 발생하면 강한 반전을 나타냅니다. 이동 평균에 대한 좋은 필터입니다. 추세 지표와 함께 사용하는 것이 좋습니다. 지원 및 저항, 공급 수요 지표에 대한 추가 확인으로 사용할 수 있습니다. 자세한 내용은 다음 외환 스레드에서 찾을 수 있습니다. 표시기가 다시 칠해지지 않습니다. Buffers :   SetIndexBuffer ( 0 ,UpBar);      SetIndexBuffer ( 1 ,UpBar2);           SetIndexBuffer ( 2 ,DnBar);      SetIndexBuffer ( 3 ,DnBar2);           SetIndexBuffer ( 4 ,UpBarTop);      SetIndexBuffer ( 5 ,UpBa
Dynamic Forex28 Navigator
Bernhard Schweigert
4.43 (7)
Dynamic Forex28 Navigator - 차세대 외환 거래 도구. 현재 49% 할인. Dynamic Forex28 Navigator는 오랫동안 인기 있는 지표의 진화형으로, 세 가지의 힘을 하나로 결합했습니다. 고급 통화 Strength28 지표(695개 리뷰) + 고급 통화 IMPULSE with ALERT(520개 리뷰) + CS28 콤보 신호(보너스). 지표에 대한 자세한 정보 https://www.mql5.com/en/blogs/post/758844 차세대 Strength 지표는 무엇을 제공합니까?  원래 지표에서 좋아했던 모든 것이 새로운 기능과 더 높은 정확도로 강화되었습니다. 주요 기능: 독점적인 통화 Strength 공식.  모든 시간대에 걸쳐 부드럽고 정확한 강도선. 추세와 정확한 진입을 식별하는 데 이상적입니다. 역동적인 시장 피보나치 수준(시장 피보나치).  이 지표에만 있는 고유한 기능. 가격 차트가 아닌 통화 강도에 피보나치가 적용됩니다.
RFI levels PRO
Roman Podpora
5 (1)
이 지표는 추세 반전 지점과 가격 반등 영역을 정확하게 보여줍니다.       주요 투자자들   . 새로운 트렌드가 형성되는 곳을 파악하고 최대한 정확하게 의사결정을 내리며 모든 거래를 완벽하게 통제합니다. TREND LINES PRO   지표와 함께 사용할 때 최대의 잠재력을 발휘합니다.  VERSION MT5 지표가 보여주는 내용: 새로운 추세의 시작 시 활성화되는 반전 구조 및 반전 수준. 최소한의 위험 대비 수익률을 갖는 이익 실현   (TAKE PROFIT)   및   손절매(STOP LOSS)   레벨 표시       RR 1:2   . 지능형 손실 감소 로직이 적용된 손절매 기능. 지정된 지표에서 두 가지 추세 유형에 대한 반전 패턴을 표시합니다. 지표: 트렌드를 따라   트렌드 라인 프로   (글로벌 트렌드 변화) 트렌드 프로   (빠른 트렌드 변화) 간단하고 효과적입니다       스캐너       실시간 추세 (신규). 다중 시간 프레임 도구 필터링. 표시하다  
Trend Catcher ind
Ramil Minniakhmetov
트렌드 캐처 인디케이터 트렌드 캐처 인디케이터는 개발자가 자체 개발한 맞춤형 적응형 트렌드 분석 지표들을 조합하여 시장 가격 움직임을 분석합니다. 단기적인 노이즈를 제거하고 근본적인 모멘텀 강도, 변동성 확대, 가격 구조 움직임에 집중하여 진정한 시장 방향을 파악합니다. 또한 이동 평균, RSI, 변동성 필터와 같은 맞춤형 지표들을 활용하여 가격을 평활화하고 트렌드를 필터링합니다. 실제 운영 모니터링 및 기타 제품은 다음 링크에서 확인하실 수 있습니다: https://www.mql5.com/en/users/mechanic/seller 텔레그램에서는 EA나 설정 파일을 판매하지 않습니다. 사기이니 주의하세요. 모든 설정 파일은 블로그에서 무료로 제공됩니다. 중요! 구매 후 즉시 연락 주시면 사용 방법 및 보너스를 드립니다!
이 지표를 구매하면 제 프로페셔널 트레이드 매니저를 무료로 드립니다. 우선 이 거래 시스템이 리페인팅, 리드로잉 및 레이그 인디케이터가 아니라는 점을 강조하는 것이 중요합니다. 이는 수동 및 로봇 거래 모두에 이상적인 것으로 만듭니다. 온라인 강좌, 설명서 및 프리셋 다운로드. "스마트 트렌드 트레이딩 시스템 MT5"은 새로운 및 경험이 풍부한 트레이더를 위해 맞춤형으로 제작된 종합적인 거래 솔루션입니다. 10개 이상의 프리미엄 인디케이터를 결합하고 7개 이상의 견고한 거래 전략을 특징으로 하여 다양한 시장 조건에 대한 다목적 선택이 가능합니다. 트렌드 추종 전략: 효과적인 트렌드 추이를 타기 위한 정확한 진입 및 손절 관리를 제공합니다. 반전 전략: 잠재적인 트렌드 반전을 식별하여 트레이더가 범위 시장을 활용할 수 있게 합니다. 스캘핑 전략: 빠르고 정확한 데이 트레이딩 및 단기 거래를 위해 설계되었습니다. 안정성: 모든 인디케이터가 리페인팅, 리드로잉 및 레이그가 아니므로 신뢰
GoldRush Trend Arrow Signal
Kirk Lee Holloway
5 (2)
GoldRush 트렌드 화살표 신호 GoldRush 트렌드 화살표 신호 지표는 XAU/USD 시장에서 고속 단기 스캘핑 트레이더를 위해 설계된 정밀한 실시간 트렌드 분석을 제공합니다. 1분 시간대에 특화되어 설계된 이 도구는 명확한 진입점을 표시하는 방향성 화살표를 제공하여 스캘퍼들이 변동성이 높은 시장 환경에서도 자신 있게 거래할 수 있도록 합니다. 이 지표는 PRIMARY 및 SECONDARY 경고 화살표로 구성됩니다. PRIMARY 신호는 추세 방향의 변화를 나타내는 흰색과 검은색 방향성 화살표이며, SECONDARY 신호는 PRIMARY 화살표가 지시하는 방향을 확인하고 잠재적인 거래 진입점을 표시하는 파란색과 빨간색 화살표입니다. 참고: 추세 방향이 변경된 후 PRIMARY 경고 화살표가 단 하나만 표시될 경우, 다수의 SECONDARY 파란색/빨간색 화살표가 표시될 수 있음을 유의해야 합니다. SECONDARY 신호는 신호 기준을 충족하는 어떤 캔들 이후에도 표시
Introduction to Fractal Pattern Scanner Fractal Indicator refers to the technical indicator that makes use of the fractal geometry found in the financial market. Fractal Pattern Scanner is the advanced Fractal Indicator that brings the latest trading technology after the extensive research and development work in the fractal geometry in the financial market. The most important feature in Fractal Pattern Scanner is the ability to measure the turning point probability as well as the trend probabi
Advanced Currency Strength28 Indicator
Bernhard Schweigert
4.91 (657)
현재 40% 할인 초보자 또는 전문가 트레이더를 위한 최고의 솔루션! 이 지표는 우리가 독점 기능과 새로운 공식을 통합했기 때문에 독특하고 고품질이며 저렴한 거래 도구입니다. 단 하나의 차트로 28 Forex 쌍의 통화 강도를 읽을 수 있습니다! 새로운 추세 또는 스캘핑 기회의 정확한 트리거 포인트를 정확히 찾아낼 수 있기 때문에 거래가 어떻게 개선될지 상상해 보십시오. 사용 설명서: 여기를 클릭  https://www.mql5.com/en/blogs/post/697384 그것이 첫 번째, 원본입니다! 쓸모없는 지망생 클론을 사지 마십시오. 더 스페셜  강력한 통화 모멘텀을 보여주는 하위 창의 화살표 GAP가 거래를 안내합니다! 기본 또는 호가 통화가 과매도/과매도 영역(외부 시장 피보나치 수준)에 있을 때 개별 차트의 기본 창에 경고 표시가 나타납니다. 통화 강도가 외부 범위에서 떨어질 때 풀백/반전 경고. 교차 패턴의 특별 경고 추세를 빠르게 볼 수 있는 다중 시간
Market Structure Patterns MT4
Samuel Manoel De Souza
5 (18)
Market Structure Patterns   is an indicator based on   smart money concepts   that displays   SMC/ICT   elements that can take your trading decisions to the next level. Take advantage of the   alerts ,   push notifications   and   email messages   to keep informed from when an element is formed on the chart, the price crosses a level and/or enters in a box/zone. Developers can access the values of the elements of the indicator using the   global variables  what allows the automation of trading d
Advanced Supply Demand
Bernhard Schweigert
4.91 (300)
현재 40% 할인! 초보자나 전문 트레이더를 위한 최고의 솔루션! 이 보조지표는 우리가 다수의 독창적 기능과 새로운 공식을 통합한 독특하고 고품질이며 저렴한 거래 도구입니다. 이 업데이트를 통해 이중 시간대를 표시할 수 있습니다. 더 높은 TF를 표시할 수 있을 뿐만 아니라 차트 TF와 더 높은 TF 모두를 표시할 수 있습니다: 중첩 영역 표시. 모든 Supply Demand 트레이더들이 좋아할 것입니다. :) 중요한 정보 공개 Advanced Supply Demand의 잠재력을 극대화하려면 다음을 방문하십시오. https://www.mql5.com/ko/blogs/post/720245   진입 또는 목표의 명확한 트리거 포인트를 정확히 찾아냄으로 해서 거래가 어떻게 개선될지 상상해 보십시오. 새로운 알고리즘을 기반으로 매수자와 매도자 간의 잠재적인 불균형을 훨씬 더 쉽게 분간할 수 있습니다. 왜냐하면 가장 강한 공급영역과 가장 강한 수요 영역과 과거에 어떻게 진행 되었는지를(이전
구매 후 저에게 연락하여 이 지표를 기반으로 한 보너스 EA를 받으십시오. Self Optimizing Double MA Strategy는 파라미터 추측을 없애기 위해 설계된 전문가 수준의 트레이딩 도구입니다. 내장된 자동 최적화 엔진으로 구동되며, 통계적 우위를 유지하기 위해 백그라운드에서 수천 개의 파라미터 조합을 시뮬레이션하여 변화하는 시장 조건에 지속적으로 적응합니다. 정적이고 구식인 설정에 의존하는 대신, 이 인디케이터는 자체 로직을 동적으로 업데이트하여 현재 시간대와 종목에 가장 수익성 있는 구성을 찾습니다. 주요 기능 내장된 자동 최적화: 시스템은 단기 MA, 장기 MA 및 RSI 기간을 주기적으로 다시 계산하여, 선택한 업데이트 빈도에 따라 설정이 항상 현재 시장 리듬과 일치하도록 보장합니다. MA 다이버전스 필터: 이동평균선이 활발하게 발산(확장)할 때만 시그널을 검증하는 핵심 추세 강도 지표입니다. 이는 평균선이 수렴하거나 평탄한 횡보장에서는 잘못된 진입을 방지합
외환 거래를 한다면, 통화 강도와 통화쌍 상관관계에 대한 상세한 정보를 아는 것은 거래 실력을 한 단계 끌어올리는 데 큰 도움이 됩니다. 상관관계를 분석하면 리스크를 절반으로 줄일 수 있고, 강도 분석을 통해 수익을 극대화할 수 있습니다. 이 지표는 통화 강도 분석과 통화쌍 상관관계를 결합하여 가장 적합한 통화쌍을 선택할 수 있도록 도와주는 하이브리드 접근 방식을 제공합니다. 통화 강도 분석 활용 방법 예를 들어, 당신의 거래 전략이 AUD/JPY 매수 기회를 제공한다고 가정해 봅시다. 하지만 KT 통화 강도 분석을 통해 JPY가 AUD보다 강해지고 있다는 것을 발견했다면, 이 거래는 손실로 끝날 가능성이 높습니다. 이 지표를 사용하면 이러한 손실을 쉽게 피할 수 있습니다. 통화쌍 상관관계 활용 방법 또 다른 예로, 거래 전략이 NZD/USD와 GBP/JPY 두 통화쌍 모두에 대해 매도 기회를 제공한다고 가정해 봅시다. KT 통화쌍 상관관계 분석을 사용하면 이 두 통화쌍 간 상관
KURAMA GOLD SIGNAL PRO (MT4) — 7층 필터, 자동 TP/SL, 품질 점수를 탑재한 XAUUSD 완벽 트레이딩 시스템 리페인트 없음. 리드로우 없음. 지연 없음. 모든 신호는 영구적입니다. 보이는 것이 그대로입니다. 보너스: 영구 라이선스 구매자에게 AI Zone Radar ($59 상당) + 전체 PDF 매뉴얼을 무료 제공. 구매 후 메시지를 보내주세요. AI Zone Radar: https://www.mql5.com/en/market/product/175834 트레이더의 신뢰: 활발한 골드 트레이더 커뮤니티에서 이미 사용 중. 정확도와 사용 편의성으로 호평을 받고 있습니다. 당신의 문제 — 그리고 해결책 골드가 하루 $30-50 움직인다는 걸 알고 있죠. 여기서 돈을 벌 수 있다는 것도. 하지만: - 너무 일찍 진입해서 가격이 당신 방향으로 가기 전에 $10 손절당함 - MA 터치마다 진입하지만 절반은 실패 - TP/SL 시스템이 없어서 너무
Dynamic Scalper System
Vitalyi Belyh
5 (1)
" Dynamic Scalper System " 지표는 추세 파동 내에서 스캘핑 방식으로 거래하도록 설계되었습니다. 주요 통화쌍 및 금에서 테스트되었으며, 다른 거래 상품과의 호환성이 가능합니다. 추가적인 가격 변동 지원을 통해 추세에 따라 단기 포지션 진입 신호를 제공합니다. 지표의 원리 큰 화살표는 추세 방향을 결정합니다. 작은 화살표 형태의 스캘핑 신호를 생성하는 알고리즘은 추세 파동 내에서 작동합니다. 빨간색 화살표는 상승 방향을, 파란색 화살표는 하락 방향을 나타냅니다. 민감한 가격 변동선은 추세 방향으로 그려지며, 작은 화살표의 신호와 함께 작용합니다. 신호는 다음과 같이 작동합니다. 적절한 시점에 선이 나타나면 진입 신호가 형성되고, 선이 있는 동안 미결제 포지션을 유지하며, 완료되면 거래를 종료합니다. 권장되는 작업 시간대는 M1~H4입니다. 화살표는 현재 캔들에 형성되며, 다음 캔들이 이미 시작되었더라도 이전 캔들의 화살표는 다시 그려지지 않습니다. 입력 매개
Master head and shoulders patterns for better trading decisions A head and shoulders pattern is a chart formation that resembles a baseline with three peaks, the outside two are close in height and the middle is highest. It predicts a bullish-to-bearish trend reversal and is believed to be one of the most reliable trend reversal patterns. It is one of several top patterns that signal, with varying degrees of accuracy, that a trend is nearing its end. [ Installation Guide | Update Guide | Trouble
PZ Double Top Bottom
PZ TRADING SLU
5 (1)
Trade double tops and bottoms effectively The PZ Double Top/Bottom Indicator is a technical analysis tool that helps traders identify potential price reversal patterns in the market. These patterns, known as double tops and bottoms, are characterized by two consecutive peaks or valleys in the price of an asset. Double tops and bottoms are often seen as potential reversal patterns because they can signal a change in the direction of the current trend. [ Installation Guide | Update Guide | Troubl
Cyclic Impulse
Vitalyi Belyh
차트를 구조화하고 주기적인 가격 변동을 식별하는 기술 지표입니다. 모든 차트에서 작업할 수 있습니다. 다양한 유형의 알림. 그래프 자체에도 추가 화살표가 있습니다. 역사를 재구성하지 않고, 촛불을 닫는 작업에 임한다. M5 이상에서 권장되는 TF입니다. 사용 및 구성이 쉬운 매개변수입니다. 매개변수가 다른 2개의 지표를 사용하는 경우, 다른 지표 없이 해당 지표만 사용할 수 있습니다. 2개의 입력 매개변수가 있습니다 주기성과 신호 지속 시간 이 2개의 매개변수는 차트 구조의 처리와 관련이 있습니다. Cyclicity - 역전 주기가 얼마나 자주 바뀌는지 조절하고 주기를 매끄럽게 합니다. Signal duration - 최소 숫자에서는 가격 움직임의 충격을 감지하고, 최대 숫자에서는 장기적 추세 움직임을 감지합니다.. --------------------------------
KuKl
IGOR KIRIANEN
The indicator is built on a non-standard Zig Zag, it draws accumulations after which if the price leaves this zone and a test of this zone occurs, then a sound signal is given and an arrow appears - after the test candle closes.The indicator does not redraw its signals, it is very easy to use, there are only three settings 1- this is the zig zag parameter 2- this is the minimum price exit from the zone 3- this is the maximum price exit from the zone. The lower the parameter for Zig Zag, the more
Trend Screener
STE S.S.COMPANY
4.79 (95)
트렌드 표시기, 트렌드 트레이딩 및 필터링을 위한 획기적인 고유 솔루션, 하나의 도구 안에 내장된 모든 중요한 트렌드 기능! Forex, 상품, 암호 화폐, 지수 및 주식과 같은 모든 기호/도구에 사용할 수 있는 100% 다시 칠하지 않는 다중 시간 프레임 및 다중 통화 표시기입니다. 기간 한정 특가: 지원 및 저항 스크리너 지표는 단 250 달러에 평생 제공됩니다. (원래 가격 65 달러) (제안 연장) Trend Screener는 차트에 점이 있는 화살표 추세 신호를 제공하는 효율적인 지표 추세 추종 지표입니다. 추세 분석기 표시기에서 사용할 수 있는 기능: 1. 트렌드 스캐너. 2. 최대 이익 분석이 있는 추세선. 3. 추세 통화 강도 측정기. 4. 경고가 있는 추세 반전 점. 5. 경고가 있는 강력한 추세 점. 6. 추세 화살표 Trend Screener Indicator가 있는 일일 분석 예, 일일 신호 성능...등은 여기에서 찾을 수 있습니다.   여기를 클릭하십시오.
The Super Arrow Indicator provides non-repainting buy and sell signals with exceptional accuracy. Key Features No repainting – confirmed signals remain fixed Clear visual arrows: green for buy, red for sell Real-time alerts via pop-up, sound, and optional email Clean chart view with no unnecessary clutter Works on all markets: Forex, gold, oil, indices, crypto Adjustable Parameters TimeFrame Default: "current time frame" Function: Sets the time frame for indicator calculation Options: Can be set
Legacy of Gann
Pavel Zamoshnikov
4.83 (12)
The indicator very accurately determines the levels of the possible end of the trend and profit fixing. The method of determining levels is based on the ideas of W.D.Gann, using an algorithm developed by his follower Kirill Borovsky. Extremely high reliability of reaching levels (according to K. Borovsky  - 80-90%) Indispensable for any trading strategy – every trader needs to determine the exit point from the market! Precisely determines targets on any timeframes and any instruments (forex, met
Advanced Currency IMPULSE with ALERT
Bernhard Schweigert
4.9 (490)
현재 40% 할인!! 초보자 또는 전문가 트레이더를 위한 최고의 솔루션! 이 지표는 우리가 독점 기능과 비밀 공식을 통합했기 때문에 독특하고 고품질이며 저렴한 거래 도구입니다. 단 하나의 차트로 28개 통화 쌍 모두에 대한 경고를 제공합니다. 새로운 추세 또는 스캘핑 기회의 정확한 트리거 포인트를 정확히 찾아낼 수 있기 때문에 거래가 어떻게 개선될지 상상해 보십시오! 새로운 기본 알고리즘을 기반으로 구축되어 잠재적인 거래를 훨씬 더 쉽게 식별하고 확인할 수 있습니다. 이는 통화의 강세 또는 약세가 가속되는지 여부를 그래픽으로 표시하고 가속 속도를 측정하기 때문입니다. 자동차의 속도계처럼 생각하면 됩니다. 가속화할 때 Forex 시장에서 동일한 일이 분명히 더 빠르게 발생합니다. 즉, 반대 방향으로 가속화되는 통화를 페어링하면 잠재적으로 수익성 있는 거래를 식별한 것입니다. 통화 모멘텀의 수직선과 화살표가 거래를 안내합니다! 역동적인 Market Fibonacci 23 레벨은
제작자의 제품 더 보기
PriceRunner
Ahmet Metin Yilmaz
5 (1)
우발적인 가격 도약의 영향 없이 추세 감지를 위해 설계된 PriceRunner 지표입니다. 잡음 감소를 위해 가격 시리즈와 몇 가지 이동 평균을 사용합니다. 여러 시간대, 심지어 M1에서도 작동합니다. 효율성을 높이려면 M1 그래픽에 대한 기본 매개변수를 사용하는 것이 좋습니다(스크린샷 참조). 다른 시간 프레임에 대한 설정을 변경할 수 있습니다. 이 지표 사용의 예: 금이 파란색 아래로 교차하고 금색과 파란색이 모두 회색 아래로 교차하면 유망한 매도 신호가 될 수 있습니다. 이 표시기에서 신호를 받으려면(전문 전문가용): Gold: buffer nr. 0, 파란색: 버퍼 번호 1, 회색: 버퍼 번호. 2 이 지표는 동일한 논리를 사용하고 "TripleS 지표"를 계산하지만 차트 창이 아닌 별도의 창에 그립니다. 이전에 "TripleS 표시기"를 판매했다면 이것도 판매하지 말라고 조언합니다. 스크린샷을 보고 먼저 데모를 테스트하십시오. 입력 매개변수 기간: 룩백 기간, 기본값은
TripleS
Ahmet Metin Yilmaz
5 (1)
3S indicator  designed for trend detection without the effect of accidental price leaps. It uses Price Series and a few moving averages for noise reduction. It works on multiple timeframes, even M1. To increase effectiveness, it is recommended to use default parameters for M1 graphic (see screenshots). You can change settings for other time frames. Example of using this indicator : If  Gold  cross to  Blue  down and both gold and blue under the  Gray ,  it could be a promising sell signal . To
EwoMov
Ahmet Metin Yilmaz
EwoMov 지표는 가격 이동 평균 기간이 더 높은 추세를 결정하는 데 유용합니다(200보다 높아야 함). 나는 M5-M30 차트의 스윙 트레이드에 이 지표를 사용하고 있습니다. 이 지표는 계산을 위해 여러 개의 막대를 사용합니다. 모두 외부 매개변수에 저장됩니다. 적절한 값은 5 - 13 - 34이지만 변경할 수 있습니다. 모든 시간대에 준비되어 있지만 M5-H1에는 최선을 다합니다. 이는 다른 시간대에 최적화되도록 설계되었습니다. 스크린샷에서 몇 가지 설명을 찾을 수 있습니다. 이를 사용하려면 EWO 라인, SIGNAL 라인 및 ZERO 라인의 교차점을 찾고 최상의 추세 지표와 함께 진입점을 결정할 수 있습니다. 내 제품에 대한 자세한 내용은 오후를 통해 저에게 연락하실 수 있습니다. 또는 이메일.
Mighty Scalper
Ahmet Metin Yilmaz
Mighty Scalper LightEA A Trend Friendly EA There are different and complex logic mixed in it It begins to work, simply with a BreakOut strategy and Works in PARTIAL CLOSE and CLOSE TIME LIMIT you had never seen before in the market expert... It opens an order and use partial close in a specific levels and close order within a specific time ( if order still live ) No Martingale and hedging It works any kind of broker, but lower spread gets more gain Fast optimization for strategy tester ( for n
ForexEA HMA
Ahmet Metin Yilmaz
This EA uses  Non-Repaint Hull Moving Averages calculation. You can find positive results with the correct optimization. Optimization should be adjusted according to the properties of the broker you are using and your trading institution. Default settings are optimized for AUDUSD in an ECN broker for M30 time frame. (Remember, it is necessary to re-optimize your brokers for the settings.) Test it before buying for your broker settings if it is ok, It is recommended use rental option to be sure.
GreatGigInTheSky
Ahmet Metin Yilmaz
The Great Gig In The Sky is an expert advisor and also a song from My favorite Rock Band's. Pink Floyd.  There is only one input parameter. Lots amount. You know what do you do in there. Try in a demo account from your real broker to test. Expert logic also includes stop loss and take profit transactions. Do not worry about them. The one-month rental period is only for you to try the experiment and is valid for limited copy. Tested and Preferred pairs are GBPJPY, CHFJPY,CADJPY. I am still contin
HMA Nrp
Ahmet Metin Yilmaz
Alan Hull's moving average, more sensitive to the current price activity than the normal MA. Reacts to the trend changes faster, displays the price movement more clearly. No Repaint Version on separate Windows shows the trend 1 and -1 . Improvement of the original version of the indicator by WizardSerg <wizardserg@mail.ru>. Suitable for all timeframes. Parameters Period - period, recommended values are from 9 to 64. The greater the period, the smoother the indicator. Method - method, suitable v
XLineBreak
Ahmet Metin Yilmaz
5 (1)
이 표시기는 입력 매개변수 막대 감지 전략을 사용하여 브레이크아웃을 감지합니다. WaitForBarClosed 함수를 사용하여 신호(true)를 확인할 수 있지만 때때로 false보다 약간 늦게 활성화됩니다. 표시기는 별도의 창에서 열립니다. 모든 기간 및 쌍에 적합합니다. 파란색 선은 추세 방향을 나타냅니다. 모든 차트에 표시기를 연결하십시오. 팝업되는 표시기 대화 상자의 입력 탭에서 원하는 입력을 선택합니다. 확인을 선택하여 확인하고 계속합니다. 매개변수 Lines_Break: 기간, 권장 값은 3에서 21까지입니다. 기간이 클수록 지표가 더 부드러워집니다. WaitForBarClosed: "참" 또는 "거짓". 더 타이트한 손절매와 작은 이익실현 수준으로 초기 신호에 "false"를 사용할 수 있습니다. 확인된 신호에 "true"를 사용할 수 있습니다. true 및 false 옵션이 함께 사용된 스크린샷을 참조하십시오.
OneWayTicket
Ahmet Metin Yilmaz
OneWayTicket indicator is based on CCI indicator. In fact, it analyzes multiple CCIs from several timeframes. There are four Ways of OneWayTicket, read from left to right - 15 min, 30 min, 1 hour and 4 hours. The idea is to enter the market when all four CCIs agree on a trend. A trader chooses which timeframes to monitor. When all four ways of the OneWayTicket are green - Buy . When all four ways of the OneWayTicket are bright red - Sell . Original idea from the author: tageiger, revised for the
AccountInfo
Ahmet Metin Yilmaz
This Script Shows your Account & Symbol information which you use on your graphics. These are: Account Information Number Name Currency Server Leverage Stop Out Level Balance Information Balance Equity Margin Free Margin Symbol Information Symbol Lot Size Min.Lot Lot Step Max.Lot Tick Value Tick Size Spread Stop Loss Level Swap Long Swap Short Initial Margin Maint.Margin Required Margin Trade Allowed
Virtue
Ahmet Metin Yilmaz
"Virtue" is a fully automated Long term Expert Advisor. It calculates market condition itself and decides to enter a position. "Virtue" needs patience that is the why its name Virtue. Patience is a virtue. You must be patient to make some Money. You have to wait for it to find optimal conditions to open an order. It will be enough to just install it on the platform. No need to optimize many parameters. Expert is optimized for EURUSD H1 timeframe. First download demo and test it for your broker.
VirtueMultiLot
Ahmet Metin Yilmaz
Virtue Multi Lot   "Virtue" is a fully automated Long term Expert Advisor. It calculates market condition itself and decides to enter a position. This is the main position. After that position, it adds some small lots for scalping. You can select how many orders will be open extra. It depends on your account margin and risk managment. "Virtue" needs patience that is the why its name Virtue. Patience is a virtue. You must be patient to make some Money. You have to be wait it find optimal conditi
JapaneseBreakout
Ahmet Metin Yilmaz
Instructions Attach the indicator to any chart (advised H4) Use input tabs (defaults are 5 and false ) Press ok and continue trading. Description The indicator uses a kind of pattern breakout strategy to help your trading strategy. I am using this strategy on H4 charts for many of pairs with a trailing stop and default indicator settings. Better results are shown on USDJPY, EURJPY, CADJPY, EURGBP, EURUSD, USDCAD, USDCHF, NZDUSD and GBPUSD. Trailing stops should be different for each pair. The b
PivotSupportResistance
Ahmet Metin Yilmaz
PivotSupportResistance This indicator plots horizontal lines at daily pivot levels R3, R2, R1, Pivot, S1, S2, S3, where R means Resistance and S means Support. This indicator can be applied to any chart period, although daily pivots on charts with long periods are meaningless (if you switch your chart timeframe greater than daily chart, you will get alert and indicator will not work). Labels are shown for the most recent day's levels. There are no external inputs, so it is easy to use. Please re
PriceChannel
Ahmet Metin Yilmaz
PriceChannel is designed for trend detection without the effect of accidental price leaps. It uses Price Series and a few moving averages for noise reduction. It works on multiple timeframes, even M1. To increase effectiveness, it is recommended to use 3 instances of PriceChannel with different parameters on one chart (see screenshots). You can use the following settings (for M1 charts): PriceChannel(10,2,30) Gold colour. PriceChannel(10,5,30) Blue colour. PriceChannel(21,8,13) Gray colour. Exa
VoMa
Ahmet Metin Yilmaz
Variation of Moving Averages indicator is calculated as the difference between different periods of moving averages. Obtained result filtered by another MA. It displays more precise signals of divergences between prices and the value of the indicator. It emphasizes price extremums more precisely, it moves faster. There are three inputs FastMA: Default is 13, shows MA period. SlowMA: Default is 21, shows MA period. SignalMA: Default is 8, shows MA period. It basically detects the trend, advised
Price Volume
Ahmet Metin Yilmaz
This indicator calculates price movement with the Volume. The Volume indicates the number of deals in the desired period, but does not show number of contracts per deal. From this point of view, the tick does not reflect the true volume. However it is a valuable demand indicator. Volume and price are calculated with a special formula. There are 3 input parameters EMAPeriod: Price and volume data are calculated using this period of Moving Average first. DEMAPeriod: Results of first EMA, recalcul
Doma
Ahmet Metin Yilmaz
Differences of Moving Averages This indicator plots short term trend with two moving averages difference and its signal line. Best result at 5 min chart in default parameters. There are 7 extern input parameters: MaShortPeriod: period of the first MA. MaLongPeriod: period of the second MA. ModeDoMA: DoMA method. ModePrc: MA price mode. SignalMaPeriod: Period of Signal MA. ModeSma: Signal MA mode. LabelLevel: Horizontal line level on display. Default parameters can be changed by user.
HighLowOpenClose
Ahmet Metin Yilmaz
HLOC Trend Indicator This indicator helps you to determine trend direction on your trade. Default parameters for H1 time frame. You can use this indicator both bigger time frame and smaller time frame to open a trade. The calculation is based on high, low, opening and closing price values of each bar in the selected time period. When the values found in the Indicator custom formula are exceeded, the buy or sell signal falls on the screen. There are two extern inputs; RiskFactor: Early but risky
HLOCTrend
Ahmet Metin Yilmaz
HLOC Trend Indicator This indicator helps you to determine trend direction on your trade. Default parameters for H1 time frame. You can use this indicator both bigger time frame and smaller time frame to open a trade. The calculation is based on high, low, opening and closing price values of each bar in the selected time period. When the values found in the Indicator custom formula are exceeded, the buy or sell signal falls on the screen. There are two extern inputs; RiskFactor: Early but risky
MTF Linear Regression
Ahmet Metin Yilmaz
This indicator shows Linear Regression Line and it's channels which calculated with fibo numbers. You can use this indicator in different timeframes on your chosen timeframe chart. You only need to attach this indicator on the chart twice or more with a different colors to do this.  There are 6 input parameters; period      : you can choose regression timeframe independent of chart timeframe. linewidth : width of line on the chart. bars back regression begin : calculated regression bar count. LR
CurrencyAdviser
Ahmet Metin Yilmaz
This indicator examines the relative strengths of the currencies of 8 different countries and displays the one that has the potential to gain profit in the short term as a suggestion. The relative strength of each country's currency over the selected time period is shown on the graph as a percentage. The recommended currency according to BuyLevel and SellLevel determined by the user is shown in the bottom right section. The indicator also automatically brings up the 30-minute graph of the sugges
PriceActionSignals
Ahmet Metin Yilmaz
Price Action Signals generates buy and sell signals with price close and complex logic. You can use it different timeframes and pairs.  Best results are on M30 and H1 charts with default parameter. You can change this parameter ( nFrequency ) for other timeframes. ( except M1 timeframe ) There is only one extern input: nFrequency: It determines signal frequency. Default is 0.004. You can use this arrow for Expert Advisors. Upsignal: iCustom(......"PriceActionSignals", buffer nr:0 ) Downsignal :
ATR Channels
Ahmet Metin Yilmaz
ATR Channel is an indicator. It shows us ATR ( depends on selected period ) Line on main chart. It also draw 3 up ATR channels (ATRu) and 3 down ATR channels (ATRd) on the same window. All they helps you to trade with a ATR indicator. There are 6 extern inputs; PeriodsATR   : You can change ATR Period default is 13. MA_Periods   : Use for draw ATR channels MA periods. Default is 34. MA_Type       : You can change MA_method here. Default is Linear weighted. Mult_Factor1 : It is for first up and d
BuySellEA
Ahmet Metin Yilmaz
SrEwo Expert adviser designed and optimized for EURUSD. You may Optimize all other instruments. It is easy to use.  *** It uses only M5 chart graphic and you need to use M5. ( Both test and live ) Input Parameters: Lots: Base lot amount.Expert use this amount as referance.  crossfactorlimit: expert will open new order with this limit modifylimit & TP limit : order modify and another TP limit. targetprofit : expert calculates this number in its logic. crossfactor : next order lots multiply with t
TheGorillaEA
Ahmet Metin Yilmaz
Expert works H1 timeframe only There are two main criteria. Daily pivots and moving averages. To open a buy order, today's daily pivot must greather than the day before's daily pivots.  Moving averages for EURUSD pair as default. They can be changed for other pairs and also for EURUSD too. You can also change takeprofit and stoploss level. expert doesnt trade on mondays and before 2 hour on other trade days. You can test and optimize for all pairs with extern parameters. Do not purchase without
Psr1EA
Ahmet Metin Yilmaz
Psr1 EA is the one of Psr series EAs. It works on 5 minutes chart only. You can use this EA any currencies but you should optimize first. Default parameters belongs to my broker databases EURUSD M5 . It uses pivot  and 2 main moving averages.  Moving averages can be adjustable by user. ( for optimizing ) Input Parameters:  MagicNum: Expert will use this number to determine experts orders. Lots: Lots amount which you want to use. Default is 0.01 ( it can be cahnged by expert due to your broker's
Psr3EA
Ahmet Metin Yilmaz
Psr3 EA is the one of Psr series EAs. It works on 5 minutes chart only. You can use this EA any currencies but you should optimize first. Default parameters belongs to my broker databases EURUSD M5 . It uses pivot  and Support/Resistance Levels.  Stoploss and Takeprofit can be adjustable by user. ( for optimizing ) Input Parameters:  MagicNum: Expert will use this number to determine experts orders. Lots: Lots amount which you want to use. Default is 0.01 ( it can be cahnged by expert due to you
ColorCMI
Ahmet Metin Yilmaz
Indicator values are in the range 0-100. The greater is the indicator value, the greater is the market stability, so the more likely we have trend. The smaller is the indicator value - the less probable the trend is. Tips: Trading on unstable market:     Buy, when moving average (blue line) of the CMI indicator is below 40 and the histogram is red.     Sell when moving average (blue line) of the CMI indicator is below 40 and the histogram is green.     Close positions when CMI histogram is
Signaline
Ahmet Metin Yilmaz
SIGNALINE INDICATOR This indicator for all pairs and all timeframes I have just completed the M5 timeframe for deep optimization EURJPY yet. EURJPY M5 Optimization ( TP=150 , SL=130 , IndicatorPeriod=6 , Mov1=22 , Mov2=48 ) (*)Added 20.05.2019 You can find this signal page below https://www.mql5.com/en/signals/583477 Other optimizasyon results will be added on this signalpage. Input Parameters: IndicatorPeriod: Default is 8. Mov1               : Default is 21. Mov2               : Default is 48.
필터:
리뷰 없음
리뷰 답변