Cart Indicator
- 지표
- 버전: 1.9
- 업데이트됨: 6 4월 2025

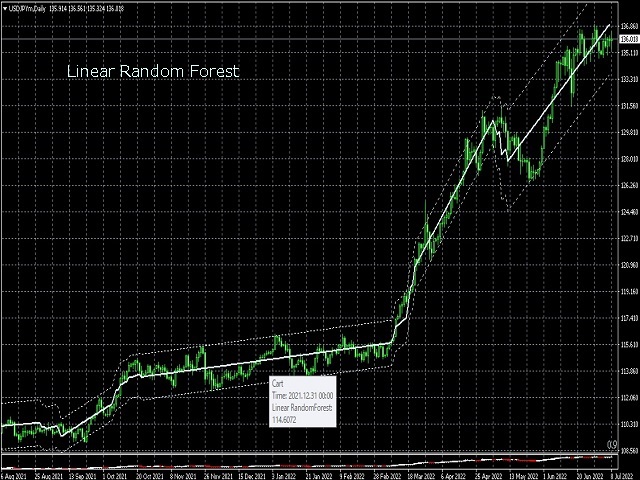
This is a regression tree indicator for MT4/MT5.
This indicator classificate nodes on the time period so that the deviation becomes smaller,
and displays regression line and channel for each node.
It's free!
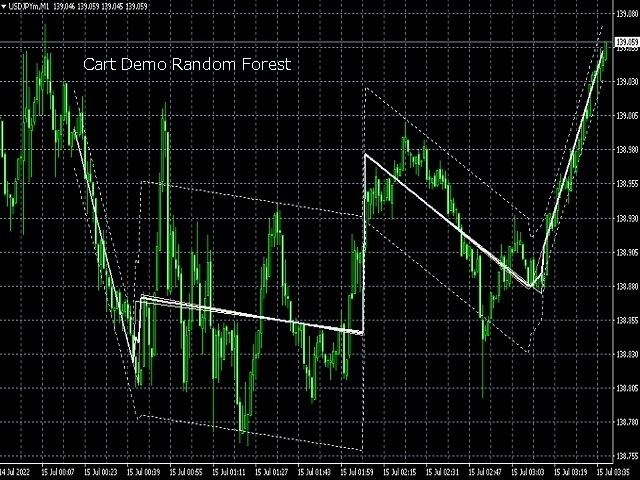
Attached CartDemo.ex4 and CartDemo.ex5 is a Demo version and has the following limitations:
Can't use HighSpeed method (default method is RandomForest)
Maximum number of bars is 260 (increase from 200)
There is no expiration date and can be started many times, but it stops after an hour.
Full version is also free!
Full version can choose from four classification methods (default is HighSpeed):
Decision Tree
Random Forest
original HighSpeed logic
original Onippaya logic
Full version and Demo version can choose either the average model or the linear model for calculation.
average model ... Staircase Approximation Line
linear model ... Linear Approximation Line
You can download full version and reffer detailed usage instruction in my WebSite.
My WebSite can be found here. https://www.mql5.com/ja/users/abueg