Auto Fibonacci With EMA
- 지표
- 버전: 1.1
- 업데이트됨: 15 5월 2025

Overview
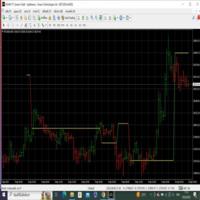
Auto Fibonacci Indicator automatically draws Fibonacci retracement levels based on the most recently closed candle on the selected Daily (D1) or 4-Hour (H4) timeframe. It is designed for manual technical analysis and helps traders view price levels that may be relevant to support, resistance, and market structure analysis.
The indicator displays Fibonacci levels on the chart and can be used on different chart timeframes.
Features
-
Automatic Fibonacci retracement drawing based on the selected D1 or H4 timeframe.
-
Displays the following levels: 0.0%, 23.6%, 38.2%, 50.0%, 61.8%, and 100.0%.
-
Updates the displayed levels when market prices change.
-
Customizable colors, line styles, and extension distances.
-
Suitable for manual chart analysis without placing trades automatically.
Suggested Manual Trading Approach
The indicator can be combined with a 50-period Exponential Moving Average (EMA) to add a trend filter to manual trading decisions.
To add the EMA in MetaTrader 4, open Insert > Indicators > Trend > Moving Average. Set the period to 50 and the method to Exponential.
Example Buy Conditions
Consider a potential buy setup when price approaches or crosses a relevant Fibonacci level while trading above the 50 EMA. Additional confirmation from price action or candle patterns can be used before entering a trade.
Example Sell Conditions
Consider a potential sell setup when price approaches or crosses a relevant Fibonacci level while trading below the 50 EMA. Additional confirmation may help assess the setup before entering a trade.
Entry levels, stop-loss placement, and take-profit targets should be determined according to the instrument, market conditions, and individual risk-management rules. These examples are for manual analysis and do not guarantee trading results.
Supported Markets and Timeframes
The indicator can be applied to charts for Forex, Gold, indices, and cryptocurrencies where supported by the trading platform and broker.
The Fibonacci calculation uses the selected D1 or H4 timeframe, while the indicator can be displayed on other chart timeframes. M5 and higher timeframes may be convenient for manual analysis.
Important Information
Auto Fibonacci Indicator is a charting tool, not an Expert Advisor. It does not open or manage trades automatically.
The indicator identifies price levels for analysis. Trading decisions remain the responsibility of the user, and no particular result is guaranteed.
Support
For installation assistance or questions about the indicator, use the MQL5 Market comments section or the MQL5 messaging system.