TimePrice MT5
- 지표
- 버전: 1.1
- 업데이트됨: 27 8월 2021
- 활성화: 10

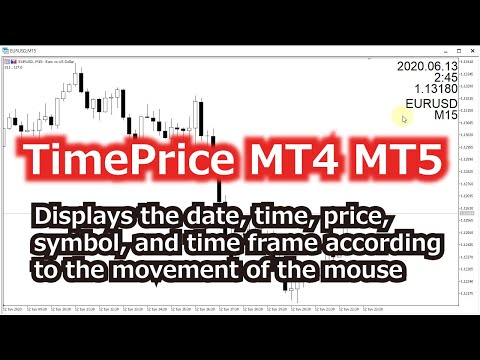
Display the date, time and price according to the movement of the mouse cursor on the chart
This is useful for discretionary trading.
It is an indispensable tool for verifying and studying past market prices and trades.
Large and easy-to-read characters
It is easy to see even if your eyesight is weak.Also, you can tell the date and price to YouTube and webinar viewers in an easy-to-understand manner.
Characteristic
●Date,Time and Price are displayed. The value follows the movement of the mouse.
●Display local time instead of server time.
●The time is displayed according to the time frame.
●Display symbols and time frames.
●You can change the color of the text, but not the font size.
●The display position can be selected with UPPER or LOWER.
●You can set the time difference every 30 minutes.
Release notes
●Version 1.01 (2021/08/27)
You can now set the time difference every 30 minutes.
Please refer to the video on youtube.
For MT5 only.
사용자가 평가에 대한 코멘트를 남기지 않았습니다