SimSim Histogram and Arrow UpDown
- 지표
- 버전: 1.2
- 업데이트됨: 23 6월 2020
- 활성화: 9

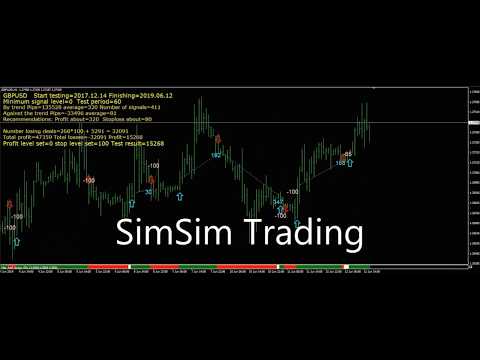
The indicator calculates and summarizes data from 25 standard indicators. What standard indicators to use, the trader chooses himself. As a result of the calculation, we obtain the current signal level. Positive values of the signal indicate a possible purchase, negative values indicate a sale.
The indicator implements a testing system that can be tested by downloading the demo version. And the main user chooses the indicators necessary for him and indicates the parameters of these indicators. An indicator can be a great addition to your trading strategy. The indicator is not redrawn, all decisions are made only after the candle is closed with a new signal, and the signal remained on candle No. 1.
This indicator alone can replace two earlier products:
Dial indicator: https://www.mql5.com/en/market/product/39814
Bar Graph Indicator: https://www.mql5.com/en/market/product/39822
You pay for one indicator, and you get two indicators.
FIRST Trial on TRIAL - THEN RENT or PURCHASE !!!
I
nput parameters
Minimum signal level (100)% / Minimum Signal (0-100)%
Shopping colors
Color for sales
Color neutral
Text color / text color
Text Font Size
Indicator Line Thickness Type of signal arrow
Vertical line style./ Vertical line style.
# Signal in the window is (0) -no./№ There is no signal in the window (0).
Minimal bar in history
For indicator testing only
Profit level
Stop loss level
Save test result in file folder