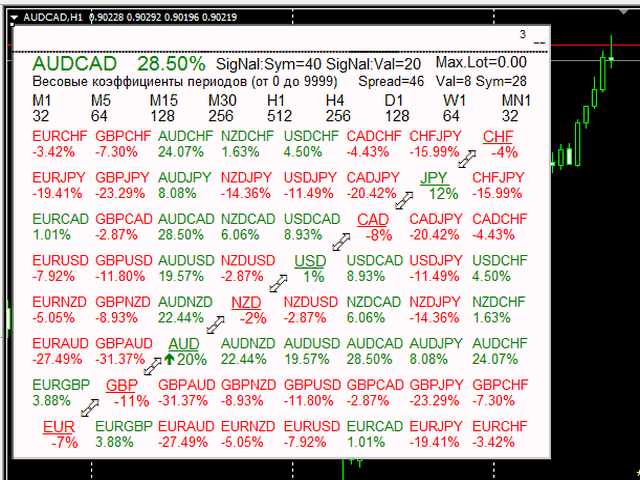
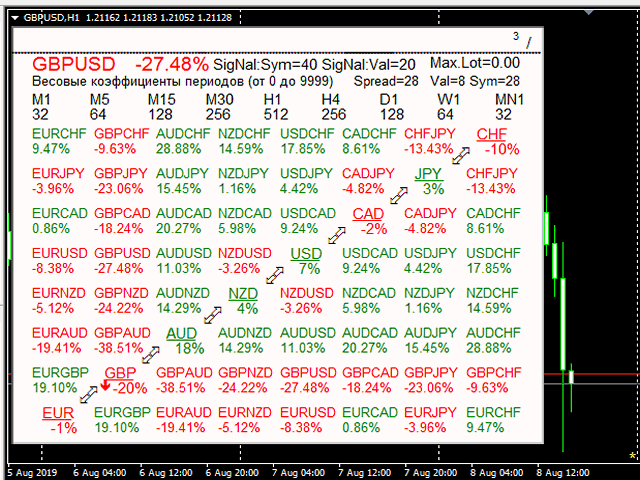
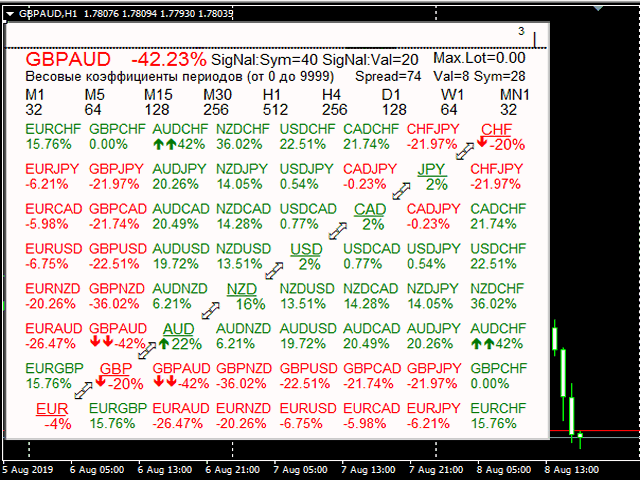
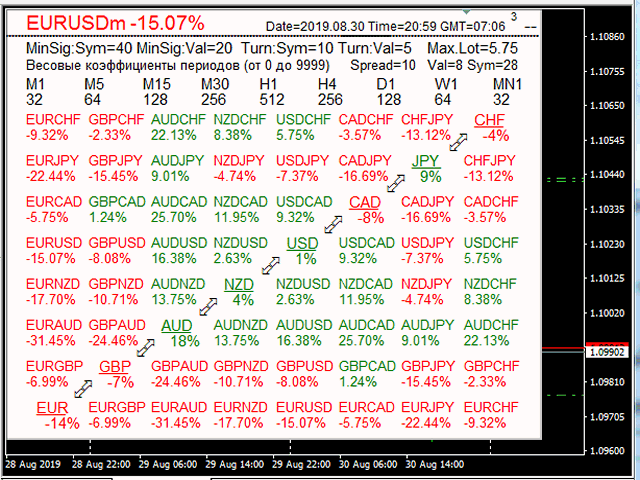
SimSim Tournament Currency Strength Table
This is a multi-currency indicator; it shows the relative strength of the currency and 28 major currency pairs.There are many similar indicators on the market, but let there be one more. In this indicator, unlike others, you can specify weighting factors for each timeframe.
Weighting factors.
Why are they? Each trader prefers to work with a specific time frame, which is the main one for him, and the signals from him are most important. Examples of setting weights.
M1 M5 M15 M30 H1 H4 D1 W1 MN1 - timeframe
1.100 100 100 100 100 100 100 100 100 100 - weighting factors. All timeframes are EQUAL.
2. 100 200 300 200 100 50 20 10 0 - - // - The timeframe for 15 minutes is highlighted.
3. 100 150 200 250 300 350 350 350 300 250 - - // - Timeframes H4 and D1 are highlighted.
4. 32 64 128 256 512 512 256 128 64 32 - - // - The H1 timeframe is highlighted. The default option.
There are many options for setting weighting factors for any tasks of the trader.
How to use
This indicator works with the main currencies: "EUR", "GBP", "AUD", "NZD", "USD", "CAD", "JPY", "CHF".The indicator is not tested in the strategy tester, 28 currency pairs, 9 timeframes, it is impossible to test in MT4.The indicator panel can be moved to any convenient place. The data update period in seconds can be increased to 5-10 seconds, this is enough for information.
Indicator Parameters:
- Minimum Signal Symbol for Alert - Minimum Signal Symbol for Alert (Signal Arrow + Sound Signal)
- Minimum Signal Currencies for alerts - Minimum signal level Currencies for alerts (signal arrow)
- Colors for purchases of currency or symbol. - Colors of purchase
- Colors for sales of currency or symbol. - Sale colors
- Colors text. - The color of text labels.
- Background color. - Panel background color.
- Alert sound file - Alert sound alert when the signal exceeds the minimum level.
- EventSetTimer. Schedule update in N seconds - Period of data update in seconds.
- Weights for the time frame M1 - Weight coefficient of the M1 timeframe
- Weights for the time frame M5 - Weight factor of the M5 timeframe
- Weights for the time frame M15 - Weight coefficient of the time frame M15
- Weights for the time frame M30 - Weight factor of the time frame M30
- Weights for the time frame H1 - H1 timeframe weight
- Weights for the time frame H4 - H4 timeframe weight
- Weights for the time frame D1 - D1 timeframe weight
- Weights for the time frame W1 - Weighting factor of the time frame W1
- Weights for the time frame MN1 - Weighting coefficient of the timeframe MN1