Three Channel 5
- 지표
- 버전: 3.1
- 업데이트됨: 23 5월 2020
- 활성화: 5
The Price Channel pattern trading strategy is one of the smartest ways to make money trading.
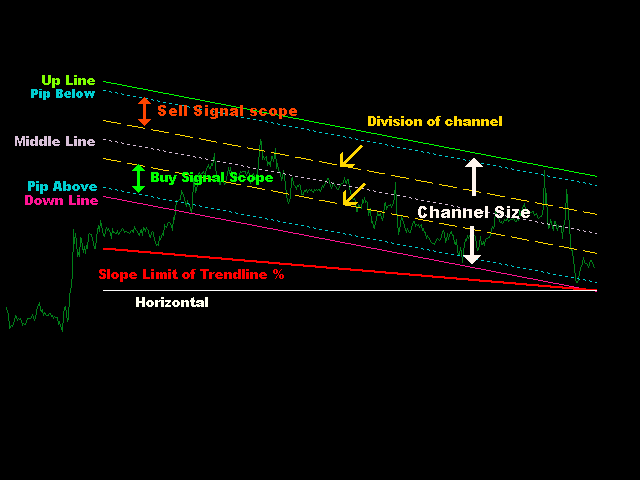
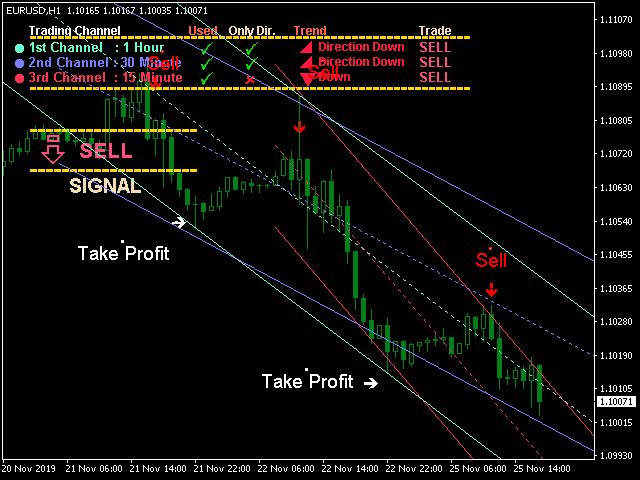
The Price Channel pattern represents two trend lines positioned above (channel resistance) and below (channel support) the price. The price action is contained between these two parallel trendlines.
The separation between the two trendlines needs to be wide enough if you want to trade inside the Price Channel Pattern. If this is the case, you can buy at the channel support level and sell at the channel resistance level.
We can distinguish two types of Price Channel Patterns:
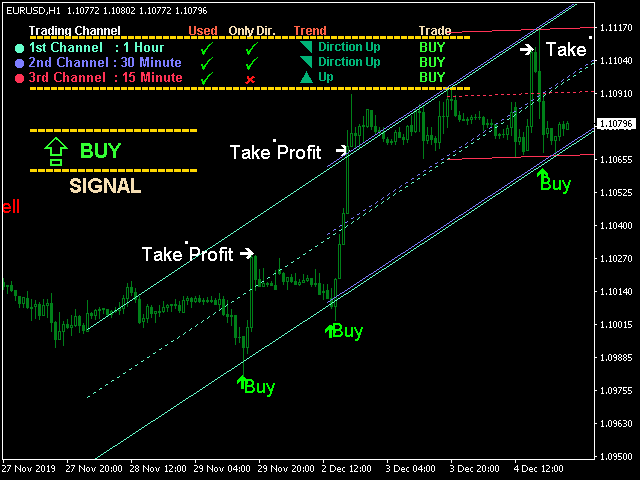
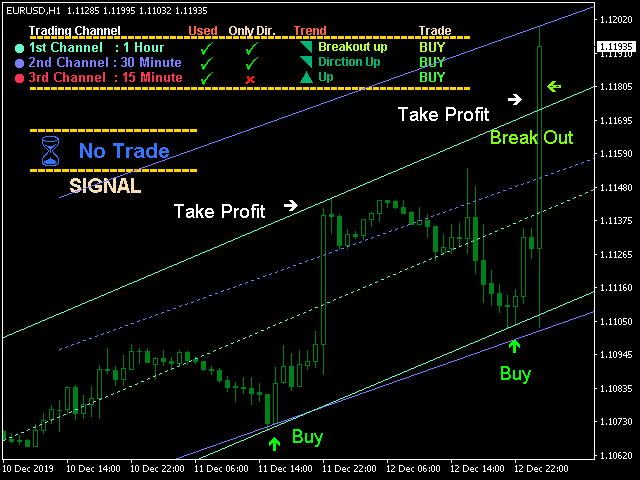
- Upward Price Channel
- Downward Price Channel
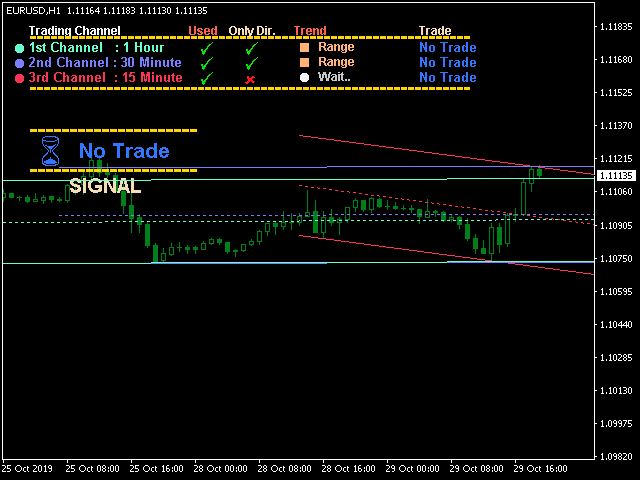
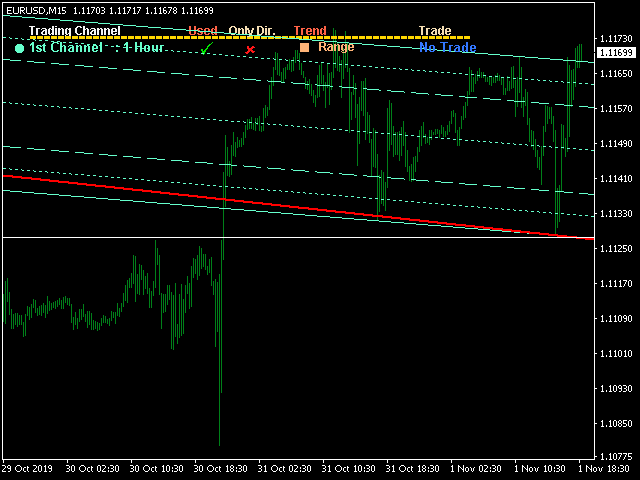
- Sideways Price Channel
An Upward Price channel pattern occurs when the price makes a series of higher highs followed by a series of higher lows. The price should be contained within the support and resistance lines.
An Downward Price channel pattern occurs when the price makes a series of lower lows followed by a series of lower highs. Typically the price should be contained inside the lines that connect these highs and lows.
The sideways Price Channel Pattern can be defined by two horizontal lines as opposed to using trendlines.


사용자가 평가에 대한 코멘트를 남기지 않았습니다