Scaner
- 지표
- 버전: 1.0
- 활성화: 5

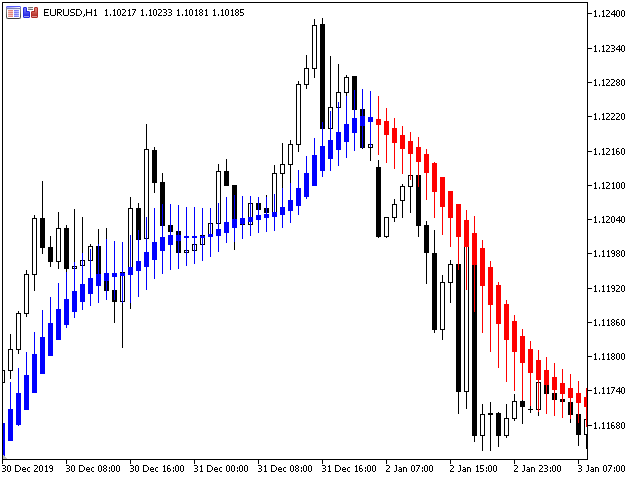
Scaner indicator.
Currency pairs never rise or fall in a straight line. Their rises and falls are alternated by pullbacks and turns. Each growth and each fall is
reflected in your emotional state: hope is replaced by fear, and when it passes, hope reappears. The market uses your fear to prevent you
from taking a strong position. At such times, you are most vulnerable.
Everything will change if you use the Scaner indicator.
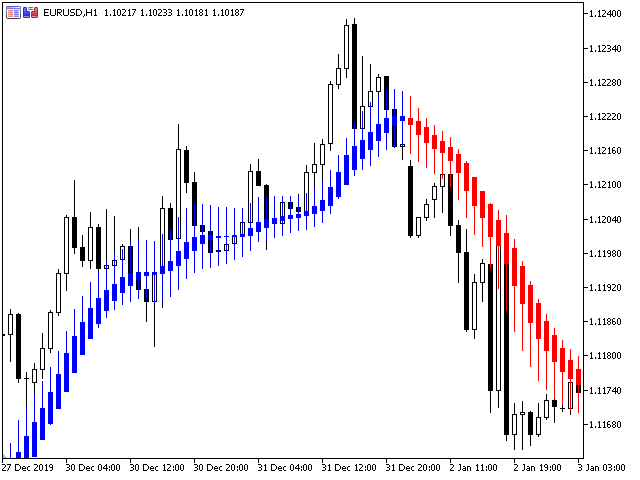
The Scaner indicator was created to neutralize temporary pauses and rollbacks. It analyzes the behavior of the price and, if there is a
temporary weakness of the trend, you can notice this from the indicator, as in the case of a pronounced change in the direction of the
trend.
When used simultaneously on multiple timeframes, this indicator will truly "make the trend your friend." With it, you can monitor trends on
multiple time frames in real time.
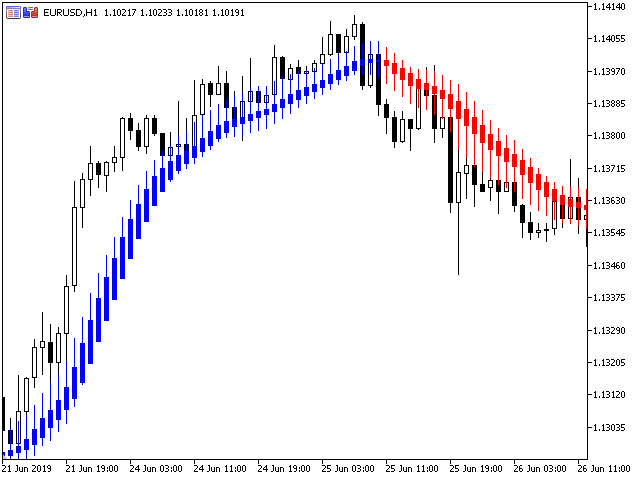
This indicator works on all timeframes.
Entering the market is not difficult, but staying in it is much more difficult. With the Scaner indicator and its unique yellow trend line, staying
in trend will be much easier!