Points Trend

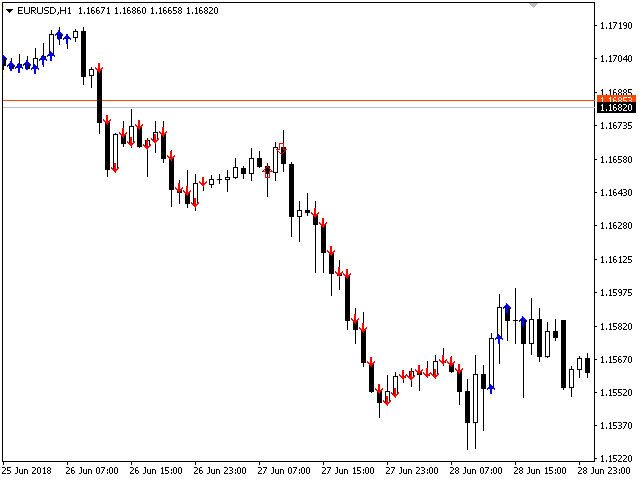
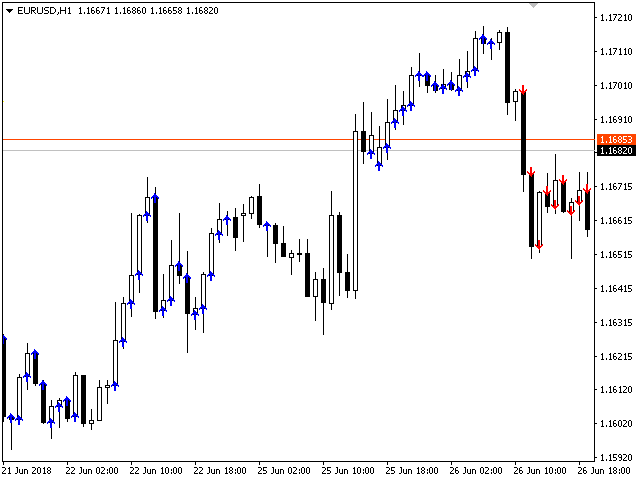
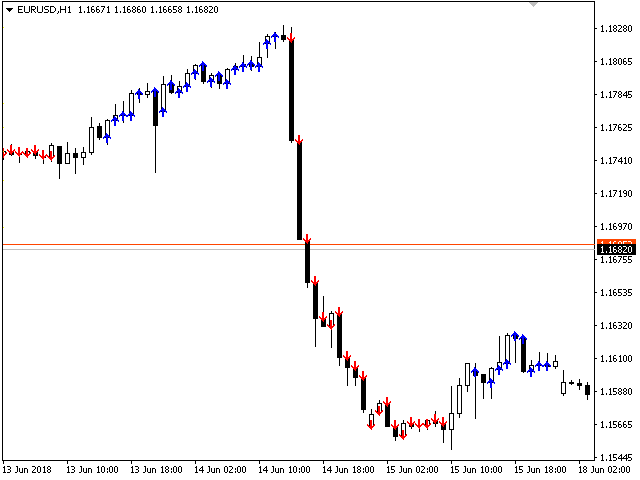
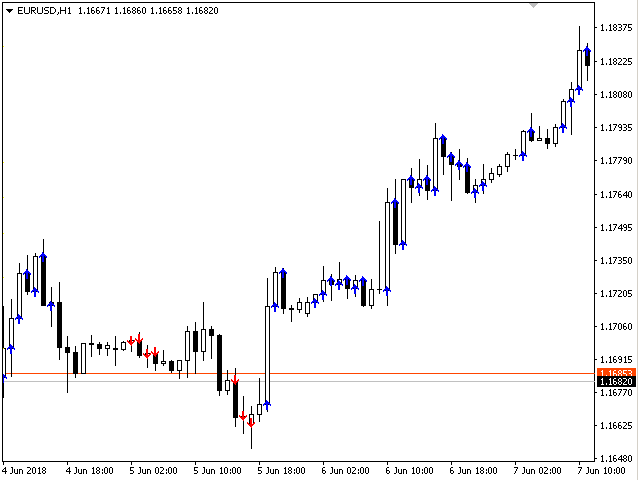
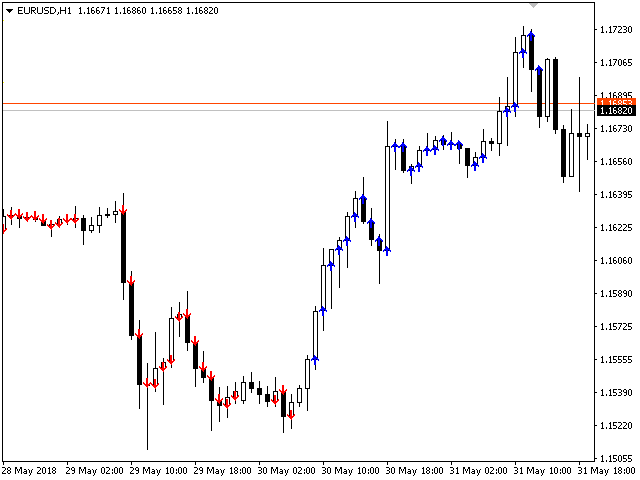
A very simple and convenient trend indicator based on price divergence. He showed himself well in scalping. Help in finding entry points for analysis. It can be used as a filter in trade. It has two parameters: Period and Level. The Level parameter helps to filter out excess signals. For example, for EURUSD, the Level parameter may be 0.0001. The indicator can work both for entry points and as a filter. The indicator reflects information in a visual form. We must not forget that the approach to trade must be comprehensive; additional information is required to enter the market.

Parameters
  • Period - Period of the indicator.
  • Level - The level of the indent from the zero balance.
추천 제품
Infinity Trend Pro
Yaroslav Varankin
1 (1)
This is a trend indicator without redrawing Developed instead of the binary options strategy (by the color of the Martingale candlestick) Also works well in forex trading When to open trades (binary options) A signal will appear in the place with a candle signaling the current candle It is recommended to open a deal for one candle of the current timeframe M1 and M5 When a blue dot appears, open a deal up When a red dot appears, open a trade down. How to open trades on Forex. When a signal is rec
The Th3Eng PipFinite indicator is based on a very excellent analysis of the right trend direction with perfect custom algorithms. It show the true direction and the best point to start trading. With StopLoss point and Three Take Profit points. Also it show the right pivot of the price and small points to order to replace the dynamic support and resistance channel, Which surrounds the price. And Finally it draws a very helpful Box on the left side on the chart includes (take profits and Stop loss
Alpha Trend sign has been a very popular trading tool in our company for a long time. It can verify our trading system and clearly indicate trading signals, and the signals will not drift. Main functions: Based on the market display of active areas, indicators can be used to intuitively determine whether the current market trend belongs to a trend market or a volatile market. And enter the market according to the indicator arrows, with green arrows indicating buy and red arrows indicating se
Trade with Gann on your side!! MASTER CIRCLE 360 CIRCLE CHART, originally created by Gann admitted that this is “The Mother of all charts”. It is one of the last studies that this great trader left for us. The numeric tab le is apparently quite simple like all the tables and is based on square numbers, the SQUARE OF 12 and is by evolution, one of the most important square numbers. Here we can find CYCLE, PRICE AND TIME thanks to angles and grades, to show past and future support and resistance.
Trendiness Index
Libertas LLC
5 (3)
"The trend is your friend" is one of the best known sayings in investing, because capturing large trendy price movements can be extremely profitable. However, trading with the trend is often easier said than done, because many indicators are based on price reversals not trends. These aren't very effective at identifying trendy periods, or predicting whether trends will continue. We developed the Trendiness Index to help address this problem by indicating the strength and direction of price trend
VR Cub
Vladimir Pastushak
VR Cub 은 고품질 진입점을 얻는 지표입니다. 이 지표는 수학적 계산을 용이하게 하고 포지션 진입점 검색을 단순화하기 위해 개발되었습니다. 지표가 작성된 거래 전략은 수년 동안 그 효율성을 입증해 왔습니다. 거래 전략의 단순성은 초보 거래자라도 성공적으로 거래할 수 있다는 큰 장점입니다. VR Cub은 포지션 개시 지점과 이익 실현 및 손절매 목표 수준을 계산하여 효율성과 사용 편의성을 크게 높입니다. 간단한 거래 규칙을 이해하려면 아래 전략을 사용한 거래 스크린샷을 살펴보세요. 설정, 세트 파일, 데모 버전, 지침, 문제 해결 등은 다음에서 얻을 수 있습니다. [블로그] 다음에서 리뷰를 읽거나 작성할 수 있습니다. [링크] 버전 [MetaTrader 5] 진입점 계산 규칙 포지션 개설 진입점을 계산하려면 VR Cub 도구를 마지막 최고점에서 마지막 최저점까지 늘려야 합니다. 첫 번째 지점이 두 번째 지점보다 빠른 경우, 거래자는 막대가 중간선 위에서 마감될 때까지 기다립니다
MT4용 Crypto_Forex 지표 "동적 과매수/과매수 구간을 포함하는 CCI" (재도색 불필요) - 상품 채널 지수(CCI)는 추세 방향으로의 모멘텀 트레이딩에 매우 유용합니다. - 동적인 과매수 구간에서 매도 진입을, 동적인 과매도 구간에서 매수 진입을 주요 추세 방향으로 유도하는 데 매우 유용합니다. - 이 지표는 가격 움직임 진입과도 결합하면 매우 유용합니다. - 동적인 과매수 구간 - 노란색 선 위. - 동적인 과매도 구간 - 파란색 선 아래. - CCI 오실레이터는 현재 가격과 과거 평균 가격의 차이를 측정합니다. - PC 및 모바일 알림 기능 제공. Click here to see high quality Trading Robots and Indicators! MQL5 웹사이트에서만 제공되는 오리지널 상품입니다.
"다이내믹 플로우 오실레이터"는 MT4를 위한 고급 맞춤형 암호화폐/외환 지표이자 효율적인 트레이딩 도구입니다! - 차세대 오실레이터 - 사용 방법은 그림을 참조하세요. - 다이내믹 플로우 오실레이터는 적응형 과매도/과매수 영역을 제공합니다. - 지표는 가격 및 거래량 데이터를 사용하여 과매도 및 과매수 영역을 식별합니다. - 오실레이터는 과매도/과매수 영역에서 정확한 진입 시점을 찾는 보조 도구입니다. - 과매도 값: 녹색선 아래, 과매수 값: 빨간색선 위. - 일반 오실레이터보다 훨씬 정확합니다. 적합한 시간대: M30, H1, H4, D1, W1. - PC 및 모바일 알림 기능 제공. 여기를 클릭하여 고품질 트레이딩 로봇과 지표를 확인하세요! MQL5 웹사이트에서만 제공되는 오리지널 제품입니다.
Laser Trend
Nicolas Zouein
The trend is your friend! This is what this indicator is all about. Follow this famous saying and be safe. Characteristics: Buy/Sell signals fixed on the close of a bar. Works on all symbols and all timeframes. Clear visual market trend laser line, Buy/Sell signal arrows, market strength meter, TP1 & TP2 boxes. Visual signals when to enter, when to exit the market. No repainting. Compatible with Flexible EA for trading automation. (Ask for a free set file optimized to perform 2010-2018) Parame
Distinctive
Tatiana Savkevych
Distinctive is a forex trending arrow indicator for identifying potential entry points. I like it, first of all, because it has a simple mechanism of work, adaptation to all time periods and trading tactics. Created on the basis of a regression channel with filters. Plotting the Lawrence indicator signals on a price function chart using a mathematical approach. How it works - when the price breaks out in the overbought / oversold zone (channel levels), a buy or sell signal is generated. Everyt
RSI Speed mp
DMITRII GRIDASOV
MT4용 Crypto_Forex 지표 "RSI SPEED" - 훌륭한 예측 도구, 재도색 불필요 - 이 지표는 물리학 방정식을 기반으로 계산됩니다. RSI SPEED는 RSI 자체의 1차 미분값입니다. - RSI SPEED는 주요 추세 방향으로 스캘핑 진입에 유용합니다. - HTF MA(그림 참조)와 같은 적절한 추세 지표와 함께 사용하세요. - RSI SPEED 지표는 RSI 자체의 방향이 얼마나 빨리 변하는지를 보여주며, 매우 민감합니다. - 모멘텀 거래 전략에는 RSI SPEED 지표 사용을 권장합니다. RSI SPEED 지표 값이 0보다 작으면 가격 모멘텀이 하락하고, 0보다 크면 가격 모멘텀이 상승합니다. - 모바일 및 PC 알림 기능이 내장되어 있습니다. 여기를 클릭하여 고품질 트레이딩 로봇과 지표를 확인하세요! 본 제품은 MQL5 웹사이트에서만 제공되는 정품입니다.
Point61 Indicator
Evgeniy Machok
5 (1)
The Point61 indicator is the result of many years of monitoring of price behavior of currency pairs and metals. It is not a secret, that in times of uncertainty, traders are looking for possible levels of support and resistance - the point, where price should stop its movement. There are 2 possible scenarios at these points: 1. Reverse (correction) to the opposite direction; 2. Breakthrough to continue movement. Very often these points are used to set stop orders - TakeProfit or StopLoss
PABT Pattern Indicator - it's classical system one of the signal patterns. Indicator logic - the Hi & Lo of the bar is fully within the range of the preceding bar, look to trade them as pullback in trend. In the way if indicator found PABT pattern it's drawing two lines and arrow what showing trend way.  - First line - it's entry point and drawing at: 1. On the high of signal bar or on middle of the signal bar (depending from indicator mode) for buy; 2. On the low of signal bar or on middle of t
Trend Oscillator mw
DMITRII GRIDASOV
Trend Oscillator - 고급 맞춤형 Crypto_Forex 지표, 효율적인 거래 도구입니다! - 고급 새로운 계산 방법 사용 - 매개변수 "계산 가격"에 대한 20가지 옵션. - 지금까지 개발된 가장 매끄러운 오실레이터. - 상승 추세는 녹색, 하락 추세는 빨간색. - 과매도 값: 5 미만, 과매도 값: 95 이상. - 이 지표로 표준 전략도 업그레이드할 수 있는 기회가 많습니다. - PC 및 모바일 알림. ................................................................................................................................................ 여기를 클릭하여 고품질 트레이딩 로봇과 지표를 확인하세요! 이 MQL5 웹사이트에서만 제공되는 오리지널 제품입니다.
Fibonacci retracement and extension line drawing tool Fibonacci retracement and extended line drawing tool for MT4 platform is suitable for traders who use  golden section trading Advantages: There is no extra line, no too long line, and it is easy to observe and find trading opportunities Trial version: https://www.mql5.com/zh/market/product/35884 Main functions: 1. Multiple groups of Fibonacci turns can be drawn directly, and the relationship between important turning points can be seen
Naturu MT4
Ivan Stefanov
“Naturu”는 자연의 대칭성을 알고리즘으로 활용하는 수동 인디케이터입니다. 간단한 전략과 숨겨진 지혜로 시장을 제패하세요! 인디케이터를 로드하면 위(Top)와 아래(Bottom) 두 개의 라인이 표시됩니다. 라인을 한 번 클릭해 활성화한 후, 이동하고 싶은 캔들 위를 클릭하면 그 위치로 이동합니다. 사용자가 고점과 저점을 지정하면, 인디케이터가 자동으로 계산합니다: 마젠타 색 영역: 상승(불) 세력과 하락(곰) 세력의 관심이 가장 가까워져서 지지/저항이 될 가능성이 큰 구간 회색 영역: 다음 관심 구간 아쿠아 색 실선: 상승 세력의 목표가 골드 색 실선: 하락 세력의 목표가 수동 인디케이터는 실시간 시장 상황과 개인의 직관에 따라 레벨을 자유롭게 조정할 수 있는 완전한 제어력과 유연성을 제공합니다. 직접 가격 움직임을 분석함으로써 지지·저항과 패턴 형성을 본질적으로 이해할 수 있습니다. 인간의 판단을 통해 자동 시스템이 놓치거나 오해하기 쉬운 ‘노이즈’를 걸러내어 잘못된 신호를
EZZ Zig Zag MT4
Paulo Rocha
5 (1)
EZZ Elite Zig Zag is an indicator for the MetaTrader 4 terminal. This indicator traces the peak of the trend based on the market reversal, thus showing various opportunities in the financial market. EZZ Elite Zig Zag is a visual tool, intuitive, and easy to understand and use.  Test it Yourself by Downloading it for Free. Author Paulo Rocha all rights reserved
PipFinite Trend PRO
Karlo Wilson Vendiola
4.88 (2251)
Breakthrough Solution For Trend Trading And Filtering With All Important Features Built Inside One Tool! Trend PRO's smart algorithm detects the trend, filters out market noise and gives entry signals with exit levels. The new features with enhanced rules for statistical calculation improved the overall performance of this indicator. Important Information Revealed Maximize the potential of Trend Pro, please visit www.mql5.com/en/blogs/post/713938 The Powerful Expert Advisor Version Automatin
Trend Monitor
Pavel Zamoshnikov
4 (4)
The indicator generates early signals basing on ADX reading data combined with elements of price patterns. Works on all symbols and timeframes. The indicator does not redraw its signals. You see the same things on history and in real time. For better visual perception signals are displayed as arrows (in order not to overload the chart). Features Easy to use. Filter configuration only requires selection of sensitivity in the " Sensitivity of the indicator " input. Signals can be filtered using
메타트레이더 4(MT4)의 "두 이동평균 크로스오버" 인디케이터는 두 이동평균을 표시하고 이동평균이 서로 교차할 때 알려주는 차트 분석 도구입니다. 이 인디케이터는 두 개의 이동평균을 계산하여 표시하는데, 하나는 더 빠르고 다른 하나는 느립니다. 더 빠른 이동 평균이 더 느린 이동 평균 위로 교차하면 강세 신호로 간주되어 잠재적 인 추세 반전 또는 새로운 상승 추세의 시작을 나타냅니다. 반대로 빠른 이동평균이 느린 이동평균 아래로 교차하면 하락 신호로, 추세 반전 또는 새로운 하락 추세의 시작을 나타냅니다. 이 인디케이터는 단순이동평균(SMA), 지수이동평균(EMA), 평활이동평균(SMMA) 또는 선형가중이동평균(LWMA) 등 다양한 유형의 이동평균을 사용하도록 사용자 지정할 수 있습니다. 트레이더는 자신의 트레이딩 스타일과 선호도에 맞게 각 이동평균의 주기를 조정할 수도 있습니다. 이동 평균을 표시하는 것 외에도 인디케이터는 크로스오버가 발생하면 알림을 생성합니다. 트레이더는 크
Kangaroo Tailz
Brenden Caleb Luebeck
Looking for an indicator that identifies high-probability price action patterns? Love counter-trend trading? The Kangaroo Tailz indicator might be just for you. This indicator is meant to be used as a reversal detector. I personally would rather enter a position at the beginning of a trend rather than catch the last couple of moves. This indicator does a good job of alerting when price may reverse by identifying price action patterns that occur frequently in markets. Even though this indicator i
Manual Zone Lines Pro는 MT4 차트에서 수동 가격 구간과 오른쪽으로 연장되는 라인을 만들 수 있는 차트 보조 도구입니다. 멀티 타임프레임 표시와 알림 기능도 함께 사용할 수 있습니다. MT4의 기본 수평선과 달리, 이 도구로 만든 라인은 왼쪽으로 무한히 연장되지 않습니다. 라인을 만든 지점에서 시작해 오른쪽의 최신 캔들 부근까지 연장되므로, 차트가 더 깔끔해지고 라인을 어디서부터 그었는지 쉽게 확인할 수 있습니다. 가격 구간도 버튼 한 번으로 만들 수 있습니다. 생성한 구간과 라인은 최신 캔들 부근까지 자동으로 연장되기 때문에, 오른쪽 끝을 반복해서 수동으로 조정할 필요가 없습니다. Pro 버전에서는 최대 2개의 구간과 2개의 라인을 만들 수 있습니다. 또한 멀티 타임프레임 표시를 지원하므로, 한 시간대에서 만든 구간과 라인을 다른 시간대에서도 볼 수 있습니다. 예를 들어 M1에서 만든 구간과 라인을 M5에서 표시할 수 있습니다. Manual Zone Lines P
Wave Wolf MT4
Andrei Salanevich
거래 단말기의 현재 창에 늑대 파도를 검색하여 표시하도록 설계되었습니다. 거래에 늑대 파도를 사용하는 상인을위한 훌륭한 지표. 거래 전략에서의 적용은 효율성과 수익성을 크게 증가시킬 것입니다. 표시기에 대한 정보 다른 늑대 웨이브 지표와는 달리,웨이브 고원지 외환 지표는 크게 그 효과를 증가 기능을 가지고 있습니다: 첫 번째는 열린 창 5 점 매개 변수(진정한 값)정보 지원을 제공합니다,즉 늑대 파도가 나타난 차트의 창을 확장합니다. 예를 들어,유로화 차트가 열려 있고 각각에 웨이브 월드 표시기가 설치되어있는 경우 유로화 모델이 감지되면 해당 차트가 자동으로 다른 차트의 맨 위에 포 그라운드로 가져 오므로 많은 상품을 거래 할 때 매우 편리합니다.  두 번째 기능은 맥 디에 내장 된 발산 분석,사용자가 자신을 선택할 수있는 매개 변수(기본 설정(12,26,9))입니다. 그런데 일반적인 오실레이터의 값은 작업 창에 표시되지 않으며 점을 형성 할 때 가격 라벨의 색상에만 반영됩니다
Noize Absorption Index MT4
Ekaterina Saltykova
5 (1)
Noize Absorption Index - is the manual trading system that measures the difference of pressure between bears forces and bulls forces. Green line - is a noize free index that showing curent situation. Zero value of index shows totally choppy/flat market.Values above zero level shows how powerfull bullish wave is and values below zero measures bearish forces.Up arrow appears on bearish market when it's ready to reverse, dn arrow appears on weak bullish market, as a result of reverse expectation. S
Rainbow Price Visualizer
Vincent Jose Proenca
Rainbow Price Visualizer v1.21 See where the market really breathes. Turns your MT4 chart into an ultra-precise heatmap that highlights price zones favored by big players. Why it matters 300 price levels at 0.2‑pip resolution — microscopic detail. 8 visual themes (Rainbow, Fire, Ocean…) for instant readibility. Smart opacity: low noise fades, real zones pop. Lightweight rendering with automatic cleanup. Fully customizable: saturation, opacity, resolution, history depth. Bands project into the f
Phase Analytics Pro: Advanced Cyclic Market Analyzer Phase Analytics Pro is a sophisticated technical tool designed for traders who prioritize mathematical precision over lag-heavy traditional indicators. Based on the principles of digital signal processing, this indicator decomposes price action into phase and quadrature components to identify the dominant market cycle. How it works: The algorithm calculates the instantaneous phase of the market, allowing it to distinguish between trending and
Stratos Pali
Michela Russo
4.43 (7)
Stratos Pali Indicator   is a revolutionary tool designed to enhance your trading strategy by accurately identifying market trends. This sophisticated indicator uses a unique algorithm to generate a complete histogram, which records when the trend is Long or Short. When a trend reversal occurs, an arrow appears, indicating the new direction of the trend. Important Information Revealed Leave a review and contact me via mql5 message to receive My Top 5 set files for Stratos Pali at no cost! Dow
Crazy Cloud MT4
Stefanus Nigel
I make this indicator to help you for setting effective stoploss and getting more signals from following trends. This indicator helps to tell the trends and sideway, when 2 lines stand above of blue cloud, it means uptrend. When 2 lines stand above red cloud, it means down trend, the other else, it means sideway market. For taking order, you have to wait the arrows. You also need to see the cloud position, if the cloud's res, you have to wait the yellow arrow for selling order. If the cloud's bl
DayTradeKing
Thomas Bradley Butler
This indicator is good for small time frames like 1 and 5 minutes and made for day trading. The indicator never repaints or recalculates. The indicator works is for trading swing points in day trading, following bulls or bears.  Its a simple to use, non cluttered indicator with a high success rate.  This indicator works well to capture ranges.  All indicators come with limitations and no indicator or system is always accurate. Use money management for long term trading success.   Place in backte
Support and Resistance is a very important reference for trading.  This indicator provides customized support and resistance levels, automatic draw line and play music functions.  In addition to the custom RS, the default RS includes Pivot Point, Fibonacci, integer Price, MA, Bollinger Bands. Pivot Point is a resistance and support system. It has been widely used at froex,stocks, futures, treasury bonds and indexes. It is an effective support resistance analysis system. Fibonacci also known as t
이 제품의 구매자들이 또한 구매함
Gann Made Easy
Oleg Rodin
4.83 (162)
Gann Made Easy 는 mr.의 이론을 사용하여 최고의 거래 원칙을 기반으로 하는 전문적이고 사용하기 쉬운 Forex 거래 시스템입니다. W.D. 간. 이 표시기는 Stop Loss 및 Take Profit Levels를 포함하여 정확한 BUY 및 SELL 신호를 제공합니다. PUSH 알림을 사용하여 이동 중에도 거래할 수 있습니다. 구매 후 거래 방법 안내 및 유용한 추가 지표를 무료로 받으시려면 저에게 연락주세요! 아마도 Gann 거래 방법에 대해 이미 여러 번 들었을 것입니다. 일반적으로 Gann의 이론은 초보자 거래자뿐만 아니라 이미 거래 경험이 있는 사람들에게도 매우 복잡한 것입니다. Gann의 거래 방식은 이론적으로 적용하기 쉽지 않기 때문입니다. 나는 그 지식을 연마하고 Forex 지표에 최고의 원칙을 적용하기 위해 몇 년을 보냈습니다. 표시기는 적용하기가 매우 쉽습니다. 차트에 첨부하고 간단한 거래 권장 사항을 따르기만 하면 됩니다. 지표는 지속적으로 시장 분석
Scalper Inside PRO
Alexey Minkov
4.74 (69)
Scalper Inside PRO – Since 2020. An exclusive indicator that utilizes an innovative algorithm to swiftly and accurately determine the market trend. The indicator automatically calculates opening, closing, and profit levels, providing detailed trading statistics. With these features, you can choose the most appropriate trading instrument for the current market conditions. Additionally, you can easily integrate your own arrow indicators into Scalper Inside Pro to quickly evaluate their statistics
KuKl
IGOR KIRIANEN
The indicator is built on a non-standard Zig Zag, it draws accumulations after which if the price leaves this zone and a test of this zone occurs, then a sound signal is given and an arrow appears - after the test candle closes.The indicator does not redraw its signals, it is very easy to use, there are only three settings 1- this is the zig zag parameter 2- this is the minimum price exit from the zone 3- this is the maximum price exit from the zone. The lower the parameter for Zig Zag, the more
PRO Renko System
Oleg Rodin
5 (30)
PRO Renko System 은 RENKO 차트 거래를 위해 특별히 고안된 매우 정확한 거래 시스템입니다. 이것은 다양한 거래 상품에 적용될 수있는 보편적 인 시스템입니다. 체계는 효과적으로 당신에게 정확한 반전 신호에 접근을 주는 소위 시장 소음을 중화합니다. 이 표시기는 사용하기가 매우 쉽고 신호 생성을 담당하는 매개 변수가 하나만 있습니다. 당신은 쉽게 당신의 선택의 어떤 무역 계기에 공구를 적응시킬 수 있고 renko 막대기의 크기. 나는 항상 당신이 내 소프트웨어로 수익성있게 거래 할 수 있도록 추가 지원을 제공 할 준비가되어 있습니다! 나는 당신에게 행복하고 수익성있는 거래를 기원합니다! 구매 후 저에게 연락하십시오! 내 렌코 차트 생성기를 보내드립니다. 또한 내 개인 권장 사항 및 시스템의 다른 모듈을 무료로 공유 할 것입니다!
Auto Optimized Parabolic RSI: 고급 3D 모멘텀 엔진 대부분의 개인 투자자용 보조지표는 시장의 변동성이 변하는 순간 무용지물이 되는 정적인 입력값에 의존하기 때문에 실패합니다. Auto Optimized Parabolic RSI는 자체적인 수학적 우위를 지속적으로 재계산하여 "보조지표 노후화" 문제를 해결하며, 기관급 퀀트 트레이딩의 적응력을 귀하의 MT5 터미널에 직접 제공합니다. 핵심 이점: 맞춤형 인메모리 3D 최적화   표준 자동 최적화 도구들은 일반적인 보조지표 호출로 터미널에 과부하를 일으켜 MT5 플랫폼을 멈추게 하는 경우가 많습니다. 이 도구는 이러한 병목 현상을 완전히 우회합니다. 맞춤형 네이티브 RAM 기반 계산기로 구축된 내부 엔진은 차트를 로드하거나 타임프레임을 변경할 때마다 빛처럼 빠른 3D 그리드 검색을 실행합니다. RSI 기간(주기), SAR 스텝(가속도) 및 SAR 최대치(속도 제한)를 동시에 스캔하여 플랫폼 지연 없이 수만 개의
Market Makers
Mohamed Hassan
5 (4)
After purchase, contact me privately to receive 1 month of free testing with EA Forex Proton! This advanced MT4 trading robot automatically executes signals from any MT4 indicator, including Market Makers. The latest version also includes AI integration, allowing each trade signal to be analyzed using Artificial Intelligence. Live Signal with EA Forex Proton: Click here Market Makers is a powerful price action trading system designed to identify high-probability Buy and Sell opportunities based
Quantum Breakout Indicator PRO
Bogdan Ion Puscasu
4.96 (26)
소개       Quantum Breakout PRO   , 브레이크아웃 존 거래 방식을 변화시키는 획기적인 MQL5 지표! 13년 이상의 거래 경험을 가진 숙련된 트레이더 팀이 개발한   Quantum Breakout PRO는   혁신적이고 역동적인 브레이크아웃 영역 전략으로 거래 여정을 새로운 차원으로 끌어올리도록 설계되었습니다. Quantum Breakout Indicator는 5개의 이익 목표 영역이 있는 브레이크아웃 영역의 신호 화살표와 브레이크아웃 상자를 기반으로 한 손절 제안을 제공합니다. 초보자 거래자와 전문 거래자 모두에게 적합합니다. Quantum EA 채널:       여기를 클릭하세요 MT5 버전 :   여기를 클릭하세요 중요한! 구매 후 설치 매뉴얼을 받으려면 개인 메시지를 보내주십시오. 추천: 기간: M15 통화쌍: GBPJPY, EURJPY, USDJPY,NZDUSD, XAUUSD 계정 유형: 스프레드가 매우 낮은 ECN, Raw 또는 Razo
Atomic Analyst
Issam Kassas
5 (5)
우선적으로 언급할 점은이 거래 지표가 다시 그리지 않고 지연되지 않으며 이를 통해 수동 및 로봇 거래 모두에 이상적이라는 점입니다. 사용자 매뉴얼: 설정, 입력 및 전략. Atomic Analyst는 가격의 강도와 모멘텀을 활용하여 시장에서 더 나은 이점을 찾는 PA Price Action Indicator입니다. 고급 필터를 장착하여 잡음과 거짓 신호를 제거하고 거래 잠재력을 높이는 데 도움이 됩니다. 복잡한 지표의 다중 레이어를 사용하여 Atomic Analyst는 차트를 스캔하고 복잡한 수학적 계산을 간단한 신호와 색상으로 변환하여 초보 트레이더가 이해하고 일관된 거래 결정을 내릴 수 있도록합니다. "Atomic Analyst"는 새로운 및 경험이 풍부한 트레이더를위한 종합적인 거래 솔루션입니다. 프리미엄 지표와 최고 수준의 기능을 하나의 거래 전략에 결합하여 모든 종류의 트레이더에 대한 다재다능한 선택지가되었습니다. 인트라데이 거래 및 스캘핑 전략 : 빠르고 정확한 일일
Advanced Supply Demand
Bernhard Schweigert
4.91 (300)
현재 40% 할인! 초보자나 전문 트레이더를 위한 최고의 솔루션! 이 보조지표는 우리가 다수의 독창적 기능과 새로운 공식을 통합한 독특하고 고품질이며 저렴한 거래 도구입니다. 이 업데이트를 통해 이중 시간대를 표시할 수 있습니다. 더 높은 TF를 표시할 수 있을 뿐만 아니라 차트 TF와 더 높은 TF 모두를 표시할 수 있습니다: 중첩 영역 표시. 모든 Supply Demand 트레이더들이 좋아할 것입니다. :) 중요한 정보 공개 Advanced Supply Demand의 잠재력을 극대화하려면 다음을 방문하십시오. https://www.mql5.com/ko/blogs/post/720245   진입 또는 목표의 명확한 트리거 포인트를 정확히 찾아냄으로 해서 거래가 어떻게 개선될지 상상해 보십시오. 새로운 알고리즘을 기반으로 매수자와 매도자 간의 잠재적인 불균형을 훨씬 더 쉽게 분간할 수 있습니다. 왜냐하면 가장 강한 공급영역과 가장 강한 수요 영역과 과거에 어떻게 진행 되었는지를(이전
GoldRush Trend Arrow Signal
Kirk Lee Holloway
5 (2)
GoldRush 트렌드 화살표 신호 GoldRush 트렌드 화살표 신호 지표는 XAU/USD 시장에서 고속 단기 스캘핑 트레이더를 위해 설계된 정밀한 실시간 트렌드 분석을 제공합니다. 1분 시간대에 특화되어 설계된 이 도구는 명확한 진입점을 표시하는 방향성 화살표를 제공하여 스캘퍼들이 변동성이 높은 시장 환경에서도 자신 있게 거래할 수 있도록 합니다. 이 지표는 PRIMARY 및 SECONDARY 경고 화살표로 구성됩니다. PRIMARY 신호는 추세 방향의 변화를 나타내는 흰색과 검은색 방향성 화살표이며, SECONDARY 신호는 PRIMARY 화살표가 지시하는 방향을 확인하고 잠재적인 거래 진입점을 표시하는 파란색과 빨간색 화살표입니다. 참고: 추세 방향이 변경된 후 PRIMARY 경고 화살표가 단 하나만 표시될 경우, 다수의 SECONDARY 파란색/빨간색 화살표가 표시될 수 있음을 유의해야 합니다. SECONDARY 신호는 신호 기준을 충족하는 어떤 캔들 이후에도 표시
Apex Edge No Repaint MT4용 전문가용 리페인팅 없는 트레이딩 지표 Apex Edge No Repaint는 화살표 리페인팅 현상 없이 명확한 신호를 원하는 진지한 외환 및 암호화폐 트레이더를 위해 설계된 프리미엄급의 깔끔하고 신뢰할 수 있는 트레이딩 도구입니다. 주요 기능: 100% 리페인트 없음 – 신호는 차트에 나타난 후 고정됩니다. 듀얼 신호 시스템: 초기 기회를 위한 RAW 신호와 높은 확률의 확정 진입을 위한 CONF 신호 간편한 원클릭 토글 버튼: RAW 켜기/끄기 및 CONF 켜기/끄기 추세, 강도 백분율 및 신호 상태를 표시하는 전문적인 실시간 대시보드 즉시 알림: 팝업, 소리 및 이메일 알림 모든 CONF 신호에 TP1, TP2 및 손절매 레벨 자동 표시 즉시 시각적 명확성을 위한 깔끔한 색상 코드 화살표: 연두색 → CONF 매수 빨간색 → CONF 매도 청록색 → RAW 매수 자홍색 → RAW 매도 모든 시간대 및 모든 종목에서 작동 장점:
RFI levels PRO
Roman Podpora
5 (1)
이 지표는 추세 반전 지점과 가격 반등 영역을 정확하게 보여줍니다.       주요 투자자들   . 새로운 트렌드가 형성되는 곳을 파악하고 최대한 정확하게 의사결정을 내리며 모든 거래를 완벽하게 통제합니다. TREND LINES PRO   지표와 함께 사용할 때 최대의 잠재력을 발휘합니다.  VERSION MT5 지표가 보여주는 내용: 새로운 추세의 시작 시 활성화되는 반전 구조 및 반전 수준. 최소한의 위험 대비 수익률을 갖는 이익 실현   (TAKE PROFIT)   및   손절매(STOP LOSS)   레벨 표시       RR 1:2   . 지능형 손실 감소 로직이 적용된 손절매 기능. 지정된 지표에서 두 가지 추세 유형에 대한 반전 패턴을 표시합니다. 지표: 트렌드를 따라   트렌드 라인 프로   (글로벌 트렌드 변화) 트렌드 프로   (빠른 트렌드 변화) 간단하고 효과적입니다       스캐너       실시간 추세 (신규). 다중 시간 프레임 도구 필터링. 표시하다  
이 인디케이터는 엘리어트 파동 이론과 두 가지 방식으로 작동합니다: 자동 작동: 이 모드에서는 인디케이터가 엘리어트 파동 이론에 따라 차트 상의 모든 5개의 모티브 웨이브를 자동으로 감지하고 예측 및 잠재적인 반전 지역을 제공합니다. 또한 중요한 개발 사항을 트레이더에게 알릴 수 있는 경보 및 푸시 메시지를 생성할 수 있는 능력을 갖추고 있습니다. 이 자동 기능은 엘리어트 파동 패턴의 식별과 분석 프로세스를 간소화합니다. 수동 작동: 이 옵션은 엘리어트 파동 이론을 수동으로 다루고 싶은 트레이더를 위해 설계되었습니다. 이를 통해 사용자는 아홉 가지 다른 등급을 사용하여 웨이브를 그릴 수 있습니다. 각 등급은 나타난 후에 차트에 그려진 라인을 조정하여 개별적으로 정의할 수 있습니다. 이 기능은 웨이브를 수동으로 그리는 프로세스를 간소화하며 더 효율적으로 만들어 줍니다. 중요한 점으로 모든 그림 데이터가 미래 참조를 위해 플랫폼 데이터 폴더에 저장된다는 것을 기억해야 합니다. 파라미터:
Please send me Direct message on MQL5 CHAT after purchasing the Indicator for Training and Installation Support There are some additional files that is important to use with the Indicator . So be sure to contact me after purchasing the Indicator So that I can add you for training and support . If you find any difficulty with installation then send me Direct message here So that I can connect with you via Anydesk or Teamview for the product installation. " Smart Order Block Indicator " to find m
이 지표를 구매하면 제 프로페셔널 트레이드 매니저를 무료로 드립니다. 우선 이 거래 시스템이 리페인팅, 리드로잉 및 레이그 인디케이터가 아니라는 점을 강조하는 것이 중요합니다. 이는 수동 및 로봇 거래 모두에 이상적인 것으로 만듭니다. 온라인 강좌, 설명서 및 프리셋 다운로드. "스마트 트렌드 트레이딩 시스템 MT5"은 새로운 및 경험이 풍부한 트레이더를 위해 맞춤형으로 제작된 종합적인 거래 솔루션입니다. 10개 이상의 프리미엄 인디케이터를 결합하고 7개 이상의 견고한 거래 전략을 특징으로 하여 다양한 시장 조건에 대한 다목적 선택이 가능합니다. 트렌드 추종 전략: 효과적인 트렌드 추이를 타기 위한 정확한 진입 및 손절 관리를 제공합니다. 반전 전략: 잠재적인 트렌드 반전을 식별하여 트레이더가 범위 시장을 활용할 수 있게 합니다. 스캘핑 전략: 빠르고 정확한 데이 트레이딩 및 단기 거래를 위해 설계되었습니다. 안정성: 모든 인디케이터가 리페인팅, 리드로잉 및 레이그가 아니므로 신뢰
Advanced Currency IMPULSE with ALERT
Bernhard Schweigert
4.9 (490)
현재 40% 할인!! 초보자 또는 전문가 트레이더를 위한 최고의 솔루션! 이 지표는 우리가 독점 기능과 비밀 공식을 통합했기 때문에 독특하고 고품질이며 저렴한 거래 도구입니다. 단 하나의 차트로 28개 통화 쌍 모두에 대한 경고를 제공합니다. 새로운 추세 또는 스캘핑 기회의 정확한 트리거 포인트를 정확히 찾아낼 수 있기 때문에 거래가 어떻게 개선될지 상상해 보십시오! 새로운 기본 알고리즘을 기반으로 구축되어 잠재적인 거래를 훨씬 더 쉽게 식별하고 확인할 수 있습니다. 이는 통화의 강세 또는 약세가 가속되는지 여부를 그래픽으로 표시하고 가속 속도를 측정하기 때문입니다. 자동차의 속도계처럼 생각하면 됩니다. 가속화할 때 Forex 시장에서 동일한 일이 분명히 더 빠르게 발생합니다. 즉, 반대 방향으로 가속화되는 통화를 페어링하면 잠재적으로 수익성 있는 거래를 식별한 것입니다. 통화 모멘텀의 수직선과 화살표가 거래를 안내합니다! 역동적인 Market Fibonacci 23 레벨은
Dynamic Scalper System
Vitalyi Belyh
5 (1)
" Dynamic Scalper System " 지표는 추세 파동 내에서 스캘핑 방식으로 거래하도록 설계되었습니다. 주요 통화쌍 및 금에서 테스트되었으며, 다른 거래 상품과의 호환성이 가능합니다. 추가적인 가격 변동 지원을 통해 추세에 따라 단기 포지션 진입 신호를 제공합니다. 지표의 원리 큰 화살표는 추세 방향을 결정합니다. 작은 화살표 형태의 스캘핑 신호를 생성하는 알고리즘은 추세 파동 내에서 작동합니다. 빨간색 화살표는 상승 방향을, 파란색 화살표는 하락 방향을 나타냅니다. 민감한 가격 변동선은 추세 방향으로 그려지며, 작은 화살표의 신호와 함께 작용합니다. 신호는 다음과 같이 작동합니다. 적절한 시점에 선이 나타나면 진입 신호가 형성되고, 선이 있는 동안 미결제 포지션을 유지하며, 완료되면 거래를 종료합니다. 권장되는 작업 시간대는 M1~H4입니다. 화살표는 현재 캔들에 형성되며, 다음 캔들이 이미 시작되었더라도 이전 캔들의 화살표는 다시 그려지지 않습니다. 입력 매개
PZ Trend Trading
PZ TRADING SLU
4.8 (5)
Capture every opportunity: your go-to indicator for profitable trend trading Trend Trading is an indicator designed to profit as much as possible from trends taking place in the market, by timing pullbacks and breakouts. It finds trading opportunities by analyzing what the price is doing during established trends. [ Installation Guide | Update Guide | Troubleshooting | FAQ | All Products ] Trade financial markets with confidence and efficiency Profit from established trends without getting whips
GOLD Impulse with Alert
Bernhard Schweigert
4.67 (12)
이 지표는 Advanced Currency IMPULSE with ALERT  +   Currency Strength Exotics  의 2가지 제품의 슈퍼 조합입니다. 그것은 모든 시간 프레임에 대해 작동하며 8개의 주요 통화와 하나의 기호에 대한 강약의 충동을 그래픽으로 보여줍니다! 이 표시기는 금, 이국적인 쌍, 상품, 지수 또는 선물과 같은 기호에 대한 통화 강도 가속을 표시하는 데 특화되어 있습니다. 금, 은, 오일, DAX, US30, MXN, TRY, CNH 등의 진정한 통화 강도 가속(충동 또는 속도)을 표시하기 위해 9번째 줄에 모든 기호를 추가할 수 있습니다. 새로운 기본 알고리즘을 기반으로 구축되어 잠재적인 거래를 훨씬 더 쉽게 식별하고 확인할 수 있습니다. 이는 통화의 강세 또는 약세가 가속되는지 여부를 그래픽으로 표시하고 가속 속도를 측정하기 때문입니다. 자동차의 속도계처럼 생각하면 됩니다. 가속화할 때 Forex 시장에서 동일한 일이 분명히 더 빠르
PZ Support Resistance
PZ TRADING SLU
3.33 (3)
Unlock key market insights with automated support and resistance lines Tired of plotting support and resistance lines? This is a multi-timeframe indicator that detects and plots supports and resistance lines in the chart with the same precision as a human eye would. As price levels are tested over time and its importance increases, the lines become thicker and darker, making price leves easy to glance and evaluate. [ Installation Guide | Update Guide | Troubleshooting | FAQ | All Products ] Boos
Trend Screener
STE S.S.COMPANY
4.79 (95)
트렌드 표시기, 트렌드 트레이딩 및 필터링을 위한 획기적인 고유 솔루션, 하나의 도구 안에 내장된 모든 중요한 트렌드 기능! Forex, 상품, 암호 화폐, 지수 및 주식과 같은 모든 기호/도구에 사용할 수 있는 100% 다시 칠하지 않는 다중 시간 프레임 및 다중 통화 표시기입니다. 기간 한정 특가: 지원 및 저항 스크리너 지표는 단 250 달러에 평생 제공됩니다. (원래 가격 65 달러) (제안 연장) Trend Screener는 차트에 점이 있는 화살표 추세 신호를 제공하는 효율적인 지표 추세 추종 지표입니다. 추세 분석기 표시기에서 사용할 수 있는 기능: 1. 트렌드 스캐너. 2. 최대 이익 분석이 있는 추세선. 3. 추세 통화 강도 측정기. 4. 경고가 있는 추세 반전 점. 5. 경고가 있는 강력한 추세 점. 6. 추세 화살표 Trend Screener Indicator가 있는 일일 분석 예, 일일 신호 성능...등은 여기에서 찾을 수 있습니다.   여기를 클릭하십시오.
Super Signal – Skyblade Edition 전문가용 노리페인트 / 노래그 트렌드 신호 시스템, 뛰어난 승률 제공 | MT4 / MT5용 1분, 5분, 15분과 같은 낮은 타임프레임에서 가장 좋은 성능을 보입니다. 핵심 기능: Super Signal – Skyblade Edition은 추세 매매를 위해 설계된 스마트 신호 시스템입니다. 이 시스템은 다중 필터 로직을 활용하여, 명확한 방향성과 실질적인 모멘텀이 수반된 고품질 추세만을 감지합니다. 이 시스템은 고점 또는 저점을 예측하지 않으며 , 다음 세 가지 조건이 모두 충족될 때만 신호를 발생시킵니다: 명확한 추세 방향 강화되는 모멘텀 건전한 변동성 구조 또한, 시장 세션 기반의 유동성 분석을 통해 신호의 신뢰성과 타이밍을 더욱 향상시킵니다. 신호 특성: 모든 화살표 신호는 100% 리페인트 없음 / 지연 없음 신호가 한 번 발생하면 고정되며, 깜빡이거나 사라지지 않음 차트 상의 시각적 화살표, 정보 패널, 팝업 알
Advanced Currency Strength28 Indicator
Bernhard Schweigert
4.91 (657)
현재 40% 할인 초보자 또는 전문가 트레이더를 위한 최고의 솔루션! 이 지표는 우리가 독점 기능과 새로운 공식을 통합했기 때문에 독특하고 고품질이며 저렴한 거래 도구입니다. 단 하나의 차트로 28 Forex 쌍의 통화 강도를 읽을 수 있습니다! 새로운 추세 또는 스캘핑 기회의 정확한 트리거 포인트를 정확히 찾아낼 수 있기 때문에 거래가 어떻게 개선될지 상상해 보십시오. 사용 설명서: 여기를 클릭  https://www.mql5.com/en/blogs/post/697384 그것이 첫 번째, 원본입니다! 쓸모없는 지망생 클론을 사지 마십시오. 더 스페셜  강력한 통화 모멘텀을 보여주는 하위 창의 화살표 GAP가 거래를 안내합니다! 기본 또는 호가 통화가 과매도/과매도 영역(외부 시장 피보나치 수준)에 있을 때 개별 차트의 기본 창에 경고 표시가 나타납니다. 통화 강도가 외부 범위에서 떨어질 때 풀백/반전 경고. 교차 패턴의 특별 경고 추세를 빠르게 볼 수 있는 다중 시간
They say history repeats itself. What if you could prove it in real-time? The Propfolio Ghost Pattern is an advanced algorithmic pattern-matching engine. It empowers you to select any current price action structure on your chart and instantly scan thousands of historical candles to find the exact moment in the past where the market did the exact same thing. Once it finds the highest probability match, it projects the historical outcome into the future as "Ghost Candles"—giving you a highly calcu
NextCandlePredictor No Repaint
Martin Alejandro Bamonte
NextCandlePredictor 지표 NextCandlePredictor는 다시 그리지 않으며, 색상이 변경되지 않고, 이동하지 않으며, 사라지지 않으며, 지연이 없는 알림이 있는 신호 지표입니다. 모든 타임프레임에서 다음 또는 다가오는 캔들의 방향을 식별하는 데 도움이 됩니다. 뉴욕, 런던 또는 둘 다 겹치는 고변동성 시장에 매우 권장됩니다. 주요 기능: 타임프레임의 유연성: M1에서 H1 이상까지 모든 타임프레임에서 빠르고 정확한 신호를 제공합니다. 명확한 매수/매도 신호: ADX의 DI+ 및 DI- 라인을 사용하여 명확한 매수 및 매도 신호를 생성하여 최고의 거래 결정을 내릴 수 있도록 합니다. 직관적인 시각화: 신호는 차트에 직접 녹색(매수) 및 빨간색(매도) 화살표로 표시되어 빠르고 쉽게 읽을 수 있습니다. 사용자 정의 가능한 설정: 분석할 막대 수와 경고 옵션을 선호도 및 거래 전략에 따라 조정합니다. 사용하려는 TF에 따른 제안표를 아래에서 확인하세요. 캔들 종료 시
구매 후 저에게 연락하여 이 지표를 기반으로 한 보너스 EA를 받으십시오. Self Optimizing Double MA Strategy는 파라미터 추측을 없애기 위해 설계된 전문가 수준의 트레이딩 도구입니다. 내장된 자동 최적화 엔진으로 구동되며, 통계적 우위를 유지하기 위해 백그라운드에서 수천 개의 파라미터 조합을 시뮬레이션하여 변화하는 시장 조건에 지속적으로 적응합니다. 정적이고 구식인 설정에 의존하는 대신, 이 인디케이터는 자체 로직을 동적으로 업데이트하여 현재 시간대와 종목에 가장 수익성 있는 구성을 찾습니다. 주요 기능 내장된 자동 최적화: 시스템은 단기 MA, 장기 MA 및 RSI 기간을 주기적으로 다시 계산하여, 선택한 업데이트 빈도에 따라 설정이 항상 현재 시장 리듬과 일치하도록 보장합니다. MA 다이버전스 필터: 이동평균선이 활발하게 발산(확장)할 때만 시그널을 검증하는 핵심 추세 강도 지표입니다. 이는 평균선이 수렴하거나 평탄한 횡보장에서는 잘못된 진입을 방지합
Bull versus Bear
Mohamed Hassan
4.5 (18)
Send us a message after your purchase to receive more information on how to get your  BONUS  for FREE  that works in great combination with Bull vs Bear ! Bull versus Bear is an easy-to-use Forex indicator that gives traders clear and accurate signals based on clear trend retests . Forget about lagging indicators or staring at charts for hours because  Bull vs Bear provides real-time entries with no lag and no repaint, so you can trade with confidence. Bull vs Bear  helps you enter trades during
Cyclic Impulse
Vitalyi Belyh
차트를 구조화하고 주기적인 가격 변동을 식별하는 기술 지표입니다. 모든 차트에서 작업할 수 있습니다. 다양한 유형의 알림. 그래프 자체에도 추가 화살표가 있습니다. 역사를 재구성하지 않고, 촛불을 닫는 작업에 임한다. M5 이상에서 권장되는 TF입니다. 사용 및 구성이 쉬운 매개변수입니다. 매개변수가 다른 2개의 지표를 사용하는 경우, 다른 지표 없이 해당 지표만 사용할 수 있습니다. 2개의 입력 매개변수가 있습니다 주기성과 신호 지속 시간 이 2개의 매개변수는 차트 구조의 처리와 관련이 있습니다. Cyclicity - 역전 주기가 얼마나 자주 바뀌는지 조절하고 주기를 매끄럽게 합니다. Signal duration - 최소 숫자에서는 가격 움직임의 충격을 감지하고, 최대 숫자에서는 장기적 추세 움직임을 감지합니다.. --------------------------------
MENA Trend Indicator
Issam Kassas
4 (1)
Trend Scanner PRO First of all, it’s worth emphasizing that this trading system is 100% Non-Repainting, Non-Redrawing, and Non-Lagging , which makes it ideal for both   manual   and   algorithmic   trading setups. Online course, user manual, and downloadable presets included. The Trend Scanner Dashboard is a professional   multi pair scanner   that analyzes multiple symbols and timeframes at once, giving you an instant   market scanner   view of the real trend direction. Instead of switching ch
KURAMA GOLD SIGNAL PRO (MT4) — 7층 필터, 자동 TP/SL, 품질 점수를 탑재한 XAUUSD 완벽 트레이딩 시스템 리페인트 없음. 리드로우 없음. 지연 없음. 모든 신호는 영구적입니다. 보이는 것이 그대로입니다. 보너스: 영구 라이선스 구매자에게 AI Zone Radar ($59 상당) + 전체 PDF 매뉴얼을 무료 제공. 구매 후 메시지를 보내주세요. AI Zone Radar: https://www.mql5.com/en/market/product/175834 트레이더의 신뢰: 활발한 골드 트레이더 커뮤니티에서 이미 사용 중. 정확도와 사용 편의성으로 호평을 받고 있습니다. 당신의 문제 — 그리고 해결책 골드가 하루 $30-50 움직인다는 걸 알고 있죠. 여기서 돈을 벌 수 있다는 것도. 하지만: - 너무 일찍 진입해서 가격이 당신 방향으로 가기 전에 $10 손절당함 - MA 터치마다 진입하지만 절반은 실패 - TP/SL 시스템이 없어서 너무
제작자의 제품 더 보기
Trend Condor
Vitalii Zakharuk
The indicator calculates the saturation levels of the price chart. A signal to exit the resale area is a buy signal. A signal to exit the overbought area is a sell signal. Usually, you need to set relative values ​​for the overbought and oversold levels of Bottom and Top - for this indicator. Most often, a good trend is visible on the price chart visually. But an experienced trader must clearly understand the current balance of power in the market before entering. And the indicator will help t
Compromise Trend
Vitalii Zakharuk
This indicator can track the steady price movement in a certain direction. In this case, the movement itself can be downward, upward or lateral, when the market movement does not have a pronounced focus. The indicator works on the basis of two moving average as well as an oscillator. Using the signal search algorithm, the indicator generates signals in the form of arrows. Benefits. Allows you to determine the current trend. You can quickly enough understand which particular trend is currently
Dolphin Bands
Vitalii Zakharuk
Dolphin Bands indicator works equally well on any timeframes. For medium-duration trends, it is recommended to use the standard setting. To study long-term trends, it is recommended to use an indicator value greater than the standard. To analyze short-term trends, it is better to use a lower indicator value. Most often, an exponential method is used to calculate the indicator, but other varieties can also be used. Dolphin Bands is a collection of lines. The two center lines of the indicator ar
Martingals
Vitalii Zakharuk
Martingals indicator works on all currency pairs and on all timeframes. The arrows indicate the optimal entry points for future Martingale averaging, even with a zero exponent. The indicator shows a signal to close the series only if all previous signals can be closed in profit. After closing a series in profit, you need to immediately open an order in the direction of the signal. Thus, the close signal is at the same time the reverse opening point to the other side of the new order. The probabi
Levels Market
Vitalii Zakharuk
Levels Market is one of the simplest, but no less effective tools from this. Pivot points can be built from these levels, levels are constructed as statistical significance at a given point in time. Trading by levels is a classic in the work of a trader. You can use them as a ready-made trading strategy or as an additional filter in your trading system. In the settings you can specify the offset for building levels. Interpretation of levels: Lines 8/8 and 0/8 (Final Resistance). These lines ar
Trend New
Vitalii Zakharuk
Trend New Trend Indicator, shows the signals for entry. Displays both entry points and the trend itself. Shows statistically calculated moments for entering the market with arrows. When using the indicator, it is possible to optimally distribute the risk factor. Settings: Uses all one parameter for settings. Selecting a parameter, it is necessary to visually resemble it so that the appropriate graph has a projection of extremes. Options: Length - the number of bars for calculating the indica
Condors TMA
Vitalii Zakharuk
Condors TMA  ( Triangular Moving Average ) is a channel indicator without redrawing, built on the basis of moving averages. The key difference between the Condor TMA indicator and other channel indicators (for example, from the same Bollinger indicator) is that Condor TMA takes into account not simple moving averages, but twice smoothed ones, which allows one to more clearly determine the market movement, and on the other hand makes the indicator less sensitive.
Cancer
Vitalii Zakharuk
Cancer indicator is great for trend trading! An intelligent indicator algorithm with high probability shows the points of potential market reversal. If you are trading in a trend, then a trading strategy built on the basis of this indicator is perfect for you. The indicator filters out market noise, almost everything and all the necessary functions for working with a thread are built into one tool. It works on all currency pairs and on all timeframes, indicator setting - according to your desire
Calculated
Vitalii Zakharuk
Calculated trend indicator, can be used with an optimal risk to profit ratio, shows successful signals. Uses two options for settings. Shows favorable moments for entering the market with arrows. The probability of a successful trend is not very bad! The indicator can be used both for pipsing on small periods, and for long-term trading. The indicator does not redraw and does not lag. It works on all currency pairs and on all timeframes.
XStrain
Vitalii Zakharuk
The XStrain expert system works on all types of accounts. It works both in 4 and 5-digit quotes. Spread and requotes are not critical, any broker is suitable. To optimize the expert system, one year is recommended for the period H1 or H4. Optimization can be carried out at opening prices, the results differ little from testing on real ticks, since the bot works at opening prices. It is enough to optimize once a month! To get better results, it is recommended to work on several different pairs.
Formulas
Vitalii Zakharuk
An expert of a new type Formulas has been created - it works using sharp tick movements. The uniqueness of the expert is that it can be launched on any hour period, any currency pair, and on the server of any broker. What makes the expert attractive enough to use for trading. It is recommended to work on liquid forex pairs with a low spread. The lower the commission and spread, the greater the profit. You can start using it with $ 100 and a lot of 0.01. A small initial deposit also contributes
Trend Distinctive
Vitalii Zakharuk
The Trend Distinctive indicator smoothes price fluctuations during signal formation by averaging the data. This gives the trader the opportunity to visually determine what trend will be present at a particular time interval. This is an auxiliary tool for technical analysis, which helps to determine the exact direction of the trend: either an upward or downward movement of the price of a trading instrument. Although the indicator is a little late, it still generates the most reliable signals th
Red Bot
Vitalii Zakharuk
The mechanism of work of the Red Bot Expert Advisor is designed so that before opening a transaction, they undergo instant implicit filtering, which, if there are competent and practical settings, allows the buyer to level the number of unprofitable and unproductive transactions. The adviser has a large number of internal regulators, software installations and special codes that help to safely and efficiently trade. This is a fully automated Expert Advisor, built on the scalping strategy, work
Stable Ex
Vitalii Zakharuk
Introduced expert system   Stable Ex works with the EURUSD currency pair and only with it. This system implemented the principle of five orders - that is, a maximum of five orders can be placed in one direction, after which the total position of the series must be closed by stops, either real or virtual. The trading system is designed to work separately with a series of buy orders and separately with a series of sell orders. which makes the trading system versatile enough. The expert passes all
Capital System
Vitalii Zakharuk
The presented expert system works with the GBPUSD currency pair and only with it. This system implemented the principle of seven orders - that is, a maximum of seven orders can be made in one direction, after which the total position of the series should be closed by stops, either real or virtual. The trading system is designed to work separately with a series of buy orders and separately with a series of sell orders. which makes the trading system versatile enough. The expert passes all types
Transition
Vitalii Zakharuk
Transition indicator can track a steady price movement in a certain direction. In this case, the movement itself can be downward, upward or sideways, when the market movement does not have a pronounced focus. The indicator works on the basis of two moving average as well as an oscillator. Using the signal search algorithm, the indicator generates signals in the form of arrows. Trading based on trend indicators is the simplest and often the most effective. If you correctly determine the beginni
Global Trend
Vitalii Zakharuk
Global Trend Indicator, shows the signals for entry. Displays both entry points and the trend itself. Shows statistically calculated moments for entering the market with arrows. When using the indicator, the risk factor can be optimally distributed. Settings: Uses all one parameter for settings. Choosing a parameter, it is necessary to visually resemble it so that the appropriate graph has a projection of extremes. Parameters: Length - the number of bars for calculating the indicator. Use
Trend DI
Vitalii Zakharuk
Trend DI is an auxiliary tool for technical analysis that helps determine the exact direction of a trend: either an upward or downward movement of the price of a trading instrument. Although the Trend DI indicator is a bit late, it still generates the most reliable signals that a trader can safely navigate. The Trend DI indicator smooths price fluctuations during signal formation by averaging data. This gives the trader the opportunity to visually determine which trend will be present in a par
Trend ZVD
Vitalii Zakharuk
The Trend ZVD Trend Indicator is important for identifying trends in financial markets. However, this indicator works equally well during consolidation periods. The Trend ZVD trend indicator indicates the direction in which the asset of your choice can move. The Trend ZVD trend indicator copes with the main task of trading: to find the entry point to the market at the time the trend is created and the exit point at the time it is completed. A trend in trade is the steady movement of quotes in
LevelZZ
Vitalii Zakharuk
An indicator from the zigzag family with levels. First of all, I will point out arguments in favor of the advisability of using a level indicator. They give the trader the following benefits: Alternative points of view - the level indicator helps to look at the levels from the side, compare them with several automatic systems, identify errors; Saving time - reducing the cost of effort for self-building lines; Exact mathematical calculation - quick calculation of levels, ratios of indicators
Progress Scalp
Vitalii Zakharuk
The Progress Scalp strategy is based on tick trading principles. At its core, this strategy is fenders, that is, the trader receives signals for opening positions during pullbacks from the main movement. A distinctive feature of this strategy is that transactions are concluded only during periods of strong tick movements in the forex market. The Progress Scalp strategy was developed for trading with different currency pairs. You need to choose a currency pair with the lowest spreads and virtual
Long
Vitalii Zakharuk
The Long expert system works with the EURUSD currency pair and only with it. The trading system is designed to work separately with a series of buy orders and separately with a series of sell orders. which makes the trading system versatile enough. The expert passes all types of testing throughout the history for the specified currency pair. Also, the expert system is tested with various delay values, it works in fully automatic mode! No settings are needed, use only the default settings. Thi
Trend Admin
Vitalii Zakharuk
The indicator is simple and clear, making the work of the trader as easy as possible and giving clear signals to enter the market. This indicator has two settings for the period. Which makes it more flexible. And at the same time, many false signals do not appear. The larger the period, the smoother the indicator itself will be. It can be used both independently and together with other indicators of technical analysis (including with oscillators), as well as with another same indicator (with
Special levels
Vitalii Zakharuk
Индикатор отображает регнессионный канал с сопровождением каналов фактически создавая уровни поддержки и сопротивления. Уровни поддержки и сопротивления являются одним из важнейших элементов технического анализа. С этим утверждением согласится любой трейдер. Уровни в трейдинге используются непосредственно, открывая и закрывая ордера у границ диапазона, очерченного ими. Также уровни применяют баланс спроса и предложения в своих торговых стратегиях на различных временных интервалах. Визуальное
Anniversary
Vitalii Zakharuk
An expert of a new type Anniversary - works using sharp tick movements, the algorithm that was created earlier is significantly improved. The uniqueness of the expert is that it can be launched on any hour period, any currency pair, and on the server of any broker. What makes the expert attractive enough to use for trading. It is recommended to work on liquid forex pairs with a low spread. The lower the commission and spread, the greater the profit. You can start using it with $ 100 and a lot o
Trends Signal
Vitalii Zakharuk
The Trends Signal indicator displays the direction of the trend with arrows, works in a simple and clear way. It uses a combination of reliable and simple indicators to analyze prices. The signals of the Trends Signal indicator can be interpreted as follows: buy when the bars are colored blue, and sell when they are red. An effective indicator with a wide range of three parameters for trading. Parameters: Length - The number of bars to calculate. LevelUP, LevelDN - Levels for determining overb
Open Trend
Vitalii Zakharuk
The Open Trend indicator calculates the saturation levels of the price chart. Most often, a good trend is visible on a price chart visually. But an experienced trader should clearly understand the current balance of power in the market before entering. A signal to exit the oversold area is a buy signal. A signal to exit the overbought area is a sell signal. Usually, you need to set the relative values ​​for the overbought and oversold levels Bottom and Top for this indicator. The Open Trend i
Sharp
Vitalii Zakharuk
Sharp expert system works with a deposit of $ 100! The classic method of scalping. It is also worth noting that with the allowable level of the spread, the bot goes through any historical period on any currency pair. The key for the Sharp bot is the spread, it works with default settings, it is possible to work with a spread of up to 10. If the spread is more than 10, then you need to select other settings. Testing should be performed with a spread of up to 10 on all ticks. There is no point i
Business Trend
Vitalii Zakharuk
Are you tired of the constant ups and downs? It is not worth becoming a victim of unstable market movements, it is time to somehow get rid of it! Already now, you can use Business Trend solutions to balance the analysis of price movements and get a clearer picture of price behavior. Business Trend is a trend indicator for the MetaTrader 4 trading platform. This indicator allows you to find the most likely trend reversal points. You will no longer find a copyright indicator like this. A simple
Henry
Vitalii Zakharuk
Henry - An indicator by which you can determine the levels and trend. The indicator calculates the saturation levels of the price chart. A signal to exit the resale area is a buy signal. A signal to exit the overbought area is a sell signal. Usually, you need to set relative values ​​for the overbought and oversold levels of Bottom and Top - for this indicator. Most often, a good trend is visible on the price chart visually. But an experienced trader must clearly understand the current balance
필터:
리뷰 없음
리뷰 답변