Raff Channel MT4
- 지표
-
Andrey Kaunov
 Привет, меня зовут Андрей Каунов. Я специализируюсь на создании экспертов, индикаторов и скриптов для платформы Meta Trader 4/5. Мой опыт программирования составляет более 18 лет. Считаю, что любую идею можно воплотить в коде. Я имею опыт реальной торговли, поэтому выполняю техническое задание
 - 버전: 1.1
- 업데이트됨: 3 3월 2020
- 활성화: 10
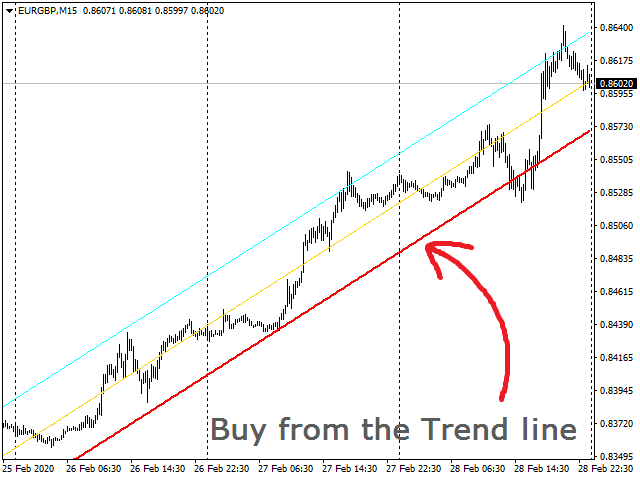
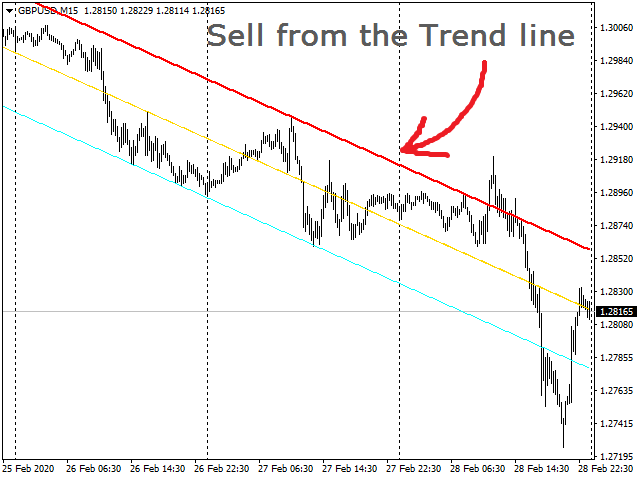
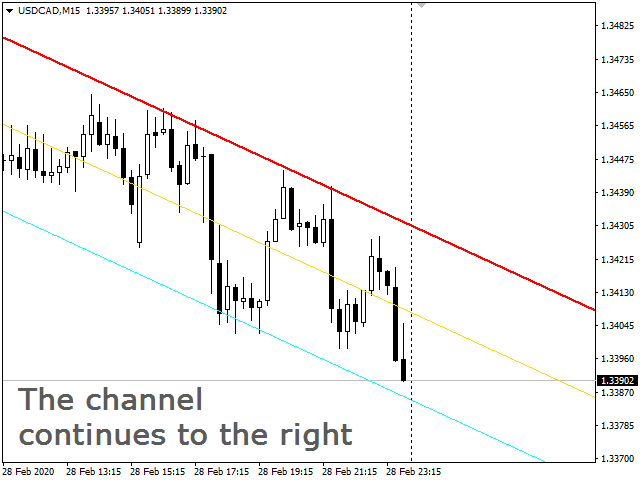
Индикатор строит канал Раффа на основе линейной регрессии. Красная линия тренда может использоваться для принятия решения о покупке или продаже внутрь канала при подходе цены к ней. Настройками можно задать ширину канала по коэффициенту отклонения от базовой линии или по максимальному и минимальному экстремуму. Так же можно включить продолжение канала вправо от текущих цен.
Индикатор канала регрессии Раффа – удобный инструмент, значительно облегчающий работу современного трейдера. Он может быть задействован практически на любом графике, возможно в связке с другими индикаторами.
Входные параметры:
Number of bars to calculate - Количество баров в историю, начиная с текущего для отрисовки каналаTrend line Deviation - Коэффициент отклонения линии трендаResistance line Deviation - Коэффициент отклонения линии сопротивленияUse Trend line Deviation - true: линия тренда строится по коэффициенту, false: линия тренда строится по экстремумуUse Resistance line Deviation - true: линия сопротивления строится по коэффициенту, false: линия сопротивления строится по экстремумуExtend channel to the right - Продолжать канал вправо (луч вправо)Base line width - Ширина базовой линии регрессииBase line color - Цвет базовой линии регрессииTrend line width - Ширина линии трендаTrend line color - Цвет линии трендаResistance line width - Ширина линии сопротивленияResistance line color - Цвет линии сопротивления
Буферы индикатора (для программистов):
   SetIndexBuffer(0,Base_line);
   SetIndexEmptyValue(0,0.0);
   SetIndexLabel(0,"Base Line");

   SetIndexBuffer(1,Trend_line);
   SetIndexEmptyValue(1,0.0);
   SetIndexLabel(1,"Trend Line");

   SetIndexBuffer(2,Res_line);
   SetIndexEmptyValue(2,0.0);
   SetIndexLabel(2,"Resist Line");


사용자가 평가에 대한 코멘트를 남기지 않았습니다