Cyberdev Peak ZigZag
- 지표
- 버전: 1.0
- 활성화: 5

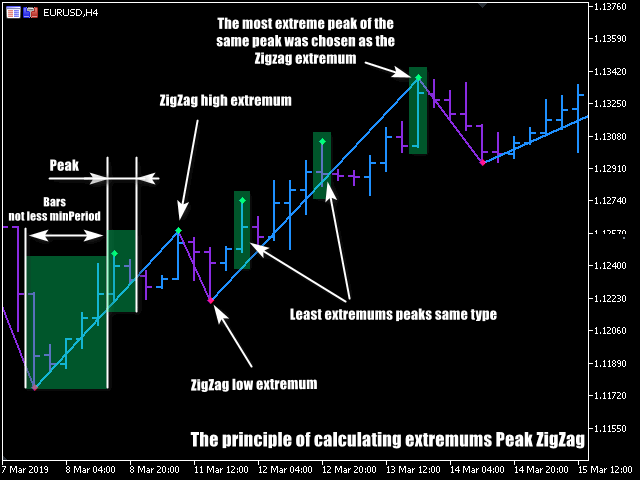
ZigZag with backlight Fibonacci levels. The indicator has the ability to set any number of levels, the signals of the intersection of which can be sent to your mobile device email, as well as viewed via alerts. The indicator is designed to perform wave analysis, search for harmonic petterns, as well as search for other technical analysis figures. This Zigzag uses the principle of constructing extrema in which any trader will understand very easily. First, the indicator finds the upper and lower peaks. The minPeriod parameter sets the minimum distance between them within which there are no more extreme peaks (see illustrations). The presence of peaks is all that is needed to build the extremes of the Zigzag. If the same extremes go in a row, the indicator selects the most extreme of them (see illustrations). The use of modern programming methods made it possible to make a thoughtful process of calculating extrema and to achieve optimal performance of the indicator. Also, the indicator is devoid of typical errors that other Zigzags usually make.
Fibonacci levels and harmonic patterns
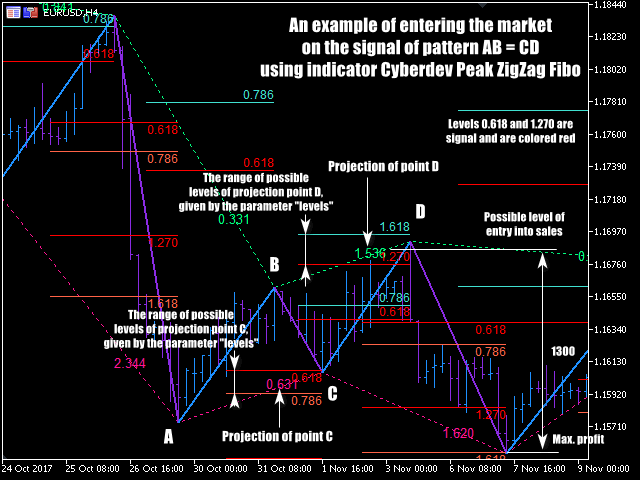
Through the use of Fibonacci levels, the indicator can significantly facilitate the search for harmonic patterns and other figures, where the Fibonacci levels are used. The levels parameter allows you to specify as many levels as you like with any values, as well as the attributes of sending a signal at the intersection for each level separately. The rules for entering the levels parameter are as follows. If the level is conceived as a signal, then before its value you need to put the character "s". All levels should be separated by commas. Various options for entering the levels input parameter are allowed. The correct example is "s0.618,0.786, s1.270,1.618". Example of freelance input: "s 0.618, S0.786, S 1.270, s1.618". If you run the indicator with this line, on a chart or in a tester, it will correctly handle all levels as in the case of the first example. Thus, the indicator is protected from incorrect input. The main thing is to observe the correctness of the character "s", the numerical values of the projection, as well as the presence of the separator ",".
Input parameters
- minPeriod - the minimum number of bars between extremums
- peakBacklight - highlight peaks
- fibo - highlight Fibonacci levels
- nBacklight - the number of extremums for highlighting Fib projections.
- levelsEnabled - enable Fib projection levels
- levels - a string for specifying Fibo projection levels
- testNotif - test of sending notifications to a mobile device and e-mail at start
- mailSend - sending signals to e-mail
- notifSend - sending signals to a mobile device
- alert - to signal using alerts