Adamant Levels Logic A

5

This Indicator Paints levels which are very 'Adamant' and strong in nature.

These levels act as strong Price rejection levels for a life time and never repaint.


Disclaimer: If you are looking for a Fancy, colorful and eye catchy indicator please stay away.


No trader can become a good trader without considering levels where the price can hold, bounce or break.

These levels help traders to enter markets at a cheaper price. They can be Support resistance, demand supply, pivot point, Fibonacci levels etc.

After years of research and analysis on price charts, I discovered few complex Algorithms and Logics to find out probable price behavior in future.

Applying these Logics and Algorithms on certain price points I achieved those levels where price can bounce or break.

I named them as "Adamant Levels".

Yes they are really adamant and static in nature.

Price is attracted and repulsed by these levels.

These are the future price actions levels where traders can enter the market with more Risk to Reward Ratio.

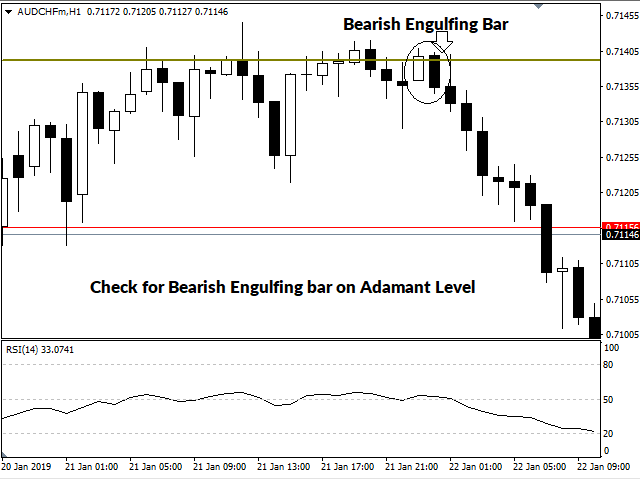
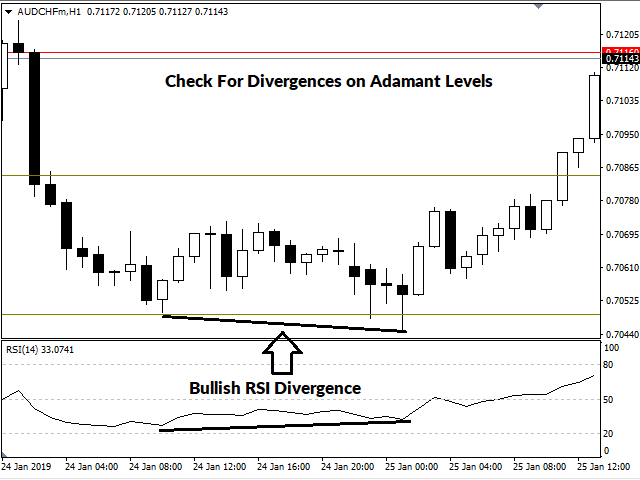
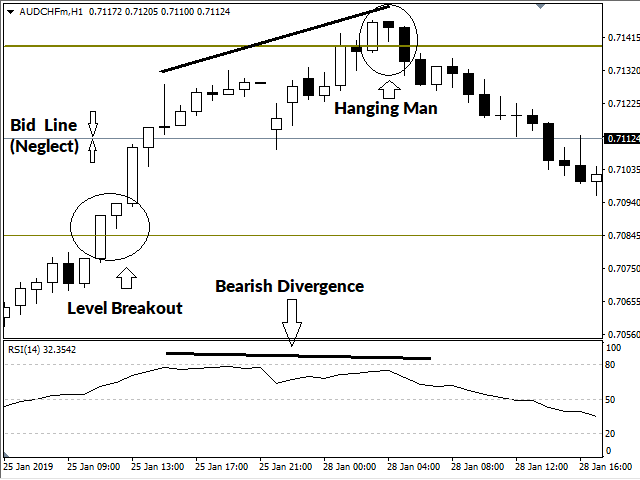
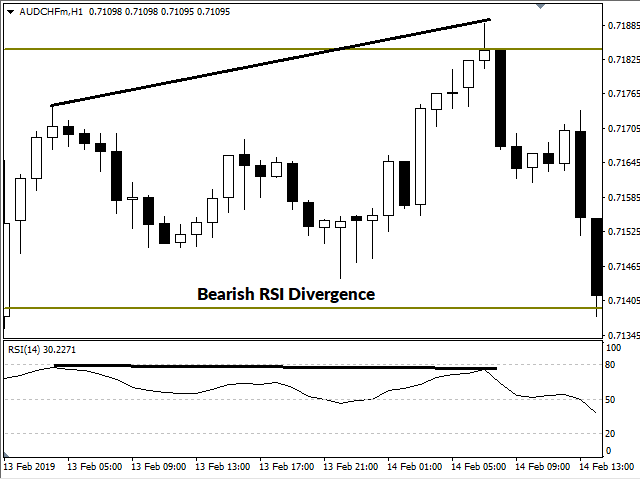
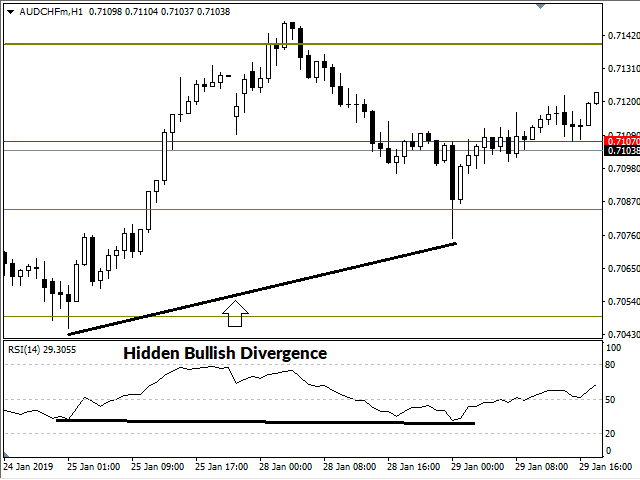
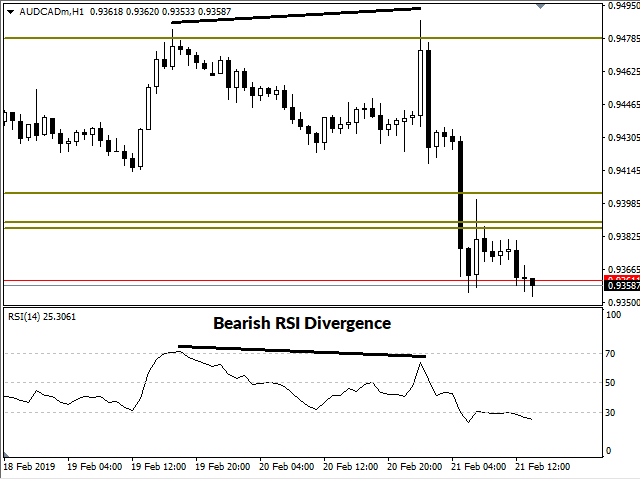
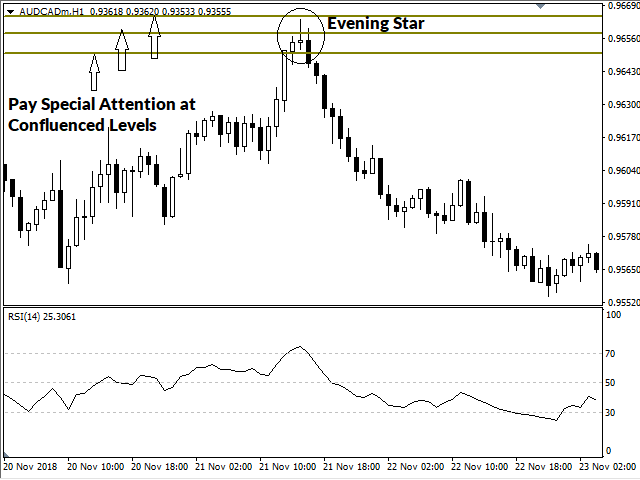
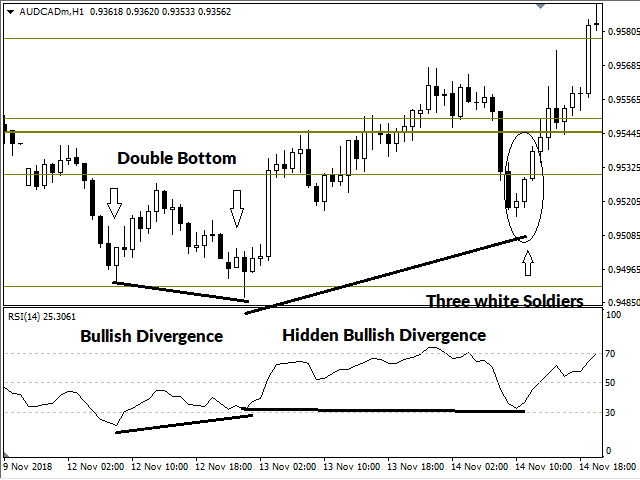
Most of the trigger points like Price Patterns, Chart Patterns, Convergence and Divergence, Trend line Breakdowns etc occur on these "Adamant levels".

So wait for a trigger to occur on these levels and enter.

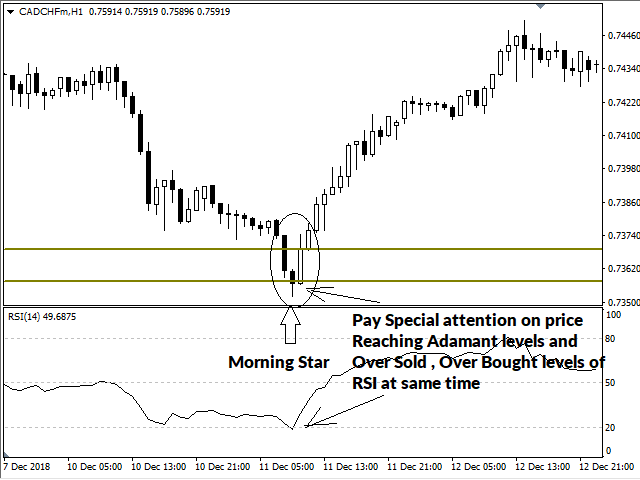
Pay special attention on confluence of different Adamant Levels

Pay special attention on price reaching Adamant Levels and Over Sold, Over Bought regions of RSI at same time, followed by Price Patterns.

These are the must have levels on every chart you trade.

This indicator is designed on basis of my first logic i.e "Logic A".

Personally I tested this indicator on AUDCHF pair for more than a month on real time trading and the results are outstanding.

Indicators based on other Logics are under testing.


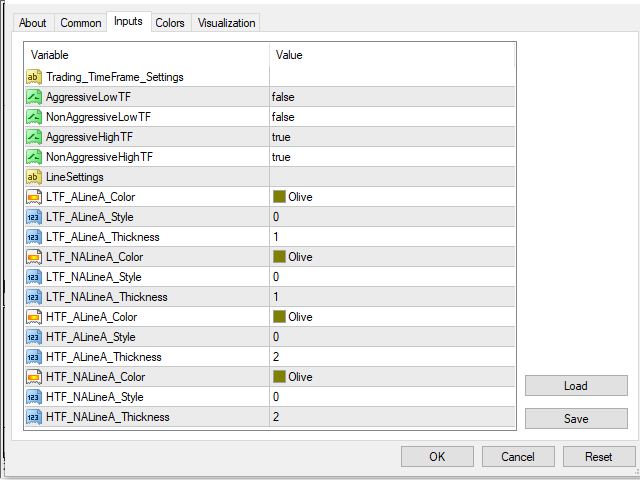
Coming to Input Parameters,

Parameters are easy to setup.

keeping in mind of different traders and their trading style, there are four categories in input parameters.

Always it is recommended to use advanced filter levels (Default settings).

If trader want little bit more aggressive use secondary levels.

If trader wants further aggressiveness can use normal levels.


However traders are free to use any settings they desire. if levels are not proper on certain currency pairs (symbols), trader can achieve exact levels by changing appropriate settings.

It is highly recommend to use higher Time Frames i.e at least 1Hour.

On most of the pairs default parameters works fine.

If you feel too many levels are painted on a particular Symbol, choose Previous Lower Time Frame.


Salient features

* Easy to set up.

* Easy to understand.

* Applicable to any trading system.

* 100% Non Repaint able.

* Can be traded on any currency pairs, Stocks and Commodities.

* Levels are independent of time frames.

* Works in all markets. That is all about this brand new indicator "Adamant Levels Logic A".


So fellow traders, warm up your strategy tester and start testing.


Hope your investment on this indicator may help you in achieving your bright trading goals.


리뷰 4
Aravind Kolanupaka
9874
Aravind Kolanupaka 2020.11.20 11:12 
 

Good, very much useful with my trading strategy

추천 제품
First time on MetaTrader, introducing IQ Star Lines - an original Vedic Astrology based indicator. "Millionaires don't use astrology, billionaires do" . - J.P. Morgan, Legendary American financier and banker. IQ Star Lines, an unique astrological indicator purely based on   Vedic astrology   calculations, published for the   first time on Metatrader.  This unique tool plots dynamic planetary grid lines based on real-time stars, constellations, and celestial movements, which allows you to plot t
LordAutoFibonnaci
Igor Pereira Calil
5 (2)
Lord Auto Fibonnaci is a free indicator for Meta Trader, in order to show the most famous chart in the financial market known as "Fibonnaci". As we can see in the images below, the fibonnaci table will automatically analyze the graph for you, with trend factors through percentage, almost infallible use, you can always work when the percentage is low or high, start shopping and sales on time, great for analyzing entries! In the images below we can see an example in gold in H4, where we are at
FREE
Divergence Osw Metatrader 4
William Oswaldo Mayorga Urduy
DIVERGENCE OSW  (For Metatrader 4) This indicator works on divergences and has the following functions: Generate an alert when a divergence occurs. Create lines by calculating the Stoploss and Takeprofit according to projection waves of inverse waves. Create an arrow indicating the possible direction of the market. The signals sent by the indicator are given when the candle ends. The Trader must evaluate each divergence to take entries. Settings: Activation and deactivation of alerts. Alert inte
Alpha Trend sign has been a very popular trading tool in our company for a long time. It can verify our trading system and clearly indicate trading signals, and the signals will not drift. Main functions: Based on the market display of active areas, indicators can be used to intuitively determine whether the current market trend belongs to a trend market or a volatile market. And enter the market according to the indicator arrows, with green arrows indicating buy and red arrows indicating se
Trend PA
Mikhail Nazarenko
5 (3)
The Trend PA indicator uses   Price Action   and its own filtering algorithm to determine the trend. This approach helps to accurately determine entry points and the current trend on any timeframe. The indicator uses its own algorithm for analyzing price changes and Price Action. Which gives you the advantage of recognizing, without delay, a new nascent trend with fewer false positives. Trend filtering conditions can be selected in the settings individually for your trading style. The indicator
Wolfe Wave Scanner
Jalitha K Johny
4.5 (2)
Wolfe Waves scanner - It scans all the Symbols and identify the movement of price and it gives confidence in trade. It automatically plots  fifth wave breaks out of the channel. According to the theory behind the pattern, a line drawn from the point at the beginning of the first wave and passing through the beginning of the fourth wave predicts a target price for the end of the fifth wave. If a trader properly identifies a Wolfe Wave as it forms, the beginning of the fifth wave represents an op
GTAS FibTdi
Riviera Systems
GTAS FidTdi is a trend indicator using combination of volatility and potential retracement levels. This indicator was created by Bernard Prats Desclaux, proprietary trader and ex-hedge fund manager, founder of E-Winvest. Description The indicator is represented as a red or green envelope above or under prices. How to use Trend detecting When the envelope is green, the trend is bullish. When it is red, the trend is bearish. Trading Once a trade is opened, GTAS FibTdi shows retracement zones wh
FREE
Range Filtered AlgoAlpha는 시장 변동성을 분석하여 잠재적인 거래 기회를 식별하도록 설계된 기술 분석 도구입니다. AlgoAlpha의 원래 TradingView 지표를 MetaTrader에 적용한 이 버전은 여러 분석 방법을 결합하여 시각적인 시장 평가를 제공합니다. 기술적 특징 가격 평활화를 위한 칼만 필터링(Kalman Filtering) 적용 변동성 측정을 위한 ATR 기반 밴드(ATR-based Bands) 통합 추세 분석을 위한 슈퍼트렌드(Supertrend) 요소 포함 색상 캔들(Candles) 및 마커(Markers)를 통한 시각적 신호 제공 구성 가능한 알림 옵션(Configurable Alerts) 제공 기능 이 지표는 시장 데이터를 처리하여 다음을 수행합니다: ATR(평균 실제 범위)을 사용한 변동성 범위 계산 시장 노이즈 감소를 위한 필터링 기술(Filtering Techniques) 적용 시각적 요소(Visual Elements)를 통한 잠재적
Owl smart levels
Sergey Ermolov
4.24 (37)
MT5 버전  |   FAQ Owl Smart Levels Indicator 는   Bill Williams 의 고급 프랙탈, 시장의 올바른 파동 구조를 구축하는 Valable ZigZag, 정확한 진입 수준을 표시하는 피보나치 수준과 같은 인기 있는 시장 분석 도구를 포함하는 하나의 지표 내에서 완전한 거래 시스템입니다. 시장과 이익을 취하는 장소로. 전략에 대한 자세한 설명 표시기 작업에 대한 지침 고문-거래 올빼미 도우미의 조수 개인 사용자 채팅 ->구입 후 나에게 쓰기,나는 개인 채팅에 당신을 추가하고 거기에 모든 보너스를 다운로드 할 수 있습니다 힘은 단순함에 있습니다! Owl Smart Levels   거래 시스템은 사용하기 매우 쉽기 때문에 전문가와 이제 막 시장을 연구하고 스스로 거래 전략을 선택하기 시작한 사람들 모두에게 적합합니다. 전략 및 지표에는 눈에 보이지 않는 비밀 공식 및 계산 방법이 없으며 모든 전략 지표는 공개되어 있습니다. Owl Smart Leve
This indicator works on MT4 and is very easy to use. When you receive a signal from it, you wait for that candle with the signal to close and you enter your trade at the beginning of the next new candle . A red arrow means sell and a green arrow means buy. All arrows comes with Alert  like for easy identification of trade signal. Are you okay with that? 1 minute candle 1 minute expire
TrendMaster MT4
Giacomo Donati
How TrendMaster Works TrendMaster is a trading indicator designed to streamline and enhance your chart analysis. Using algorithmic logic, it reviews historical price data to generate a dynamic reference line. When price action crosses this line, a "BUY" or "SELL" signal is displayed on your chart. The goal is to assist in identifying potential shifts in price behavior with a clear and user-friendly visual approach. Why Use TrendMaster? The TrendMaster MT4 Indicator helps highlight potential tre
Supply Demand
Hafis Mohamed Yacine
While most traders use various technical indicators, the price action is basically determined by the buying and selling activity. This is how support and resistance levels, which are commonly used terms in technical analysis is formed. Traders know that when price reaches a support level, price can bounce off this support. This is also known as a level where this is high demand. A high demand area forms when there are more buyers than sellers. In trading, investors tend to buy at the support
FiboZag
Andriy Sydoruk
Indicator FiboZag - transfer the indicator to the chart and the Fibonacci levels will be built automatically on the last ZigZag turn. The main advantage lies in the correct construction of Fibonacci levels and markup of price levels. Simple, visual and effective use. The indicator is not redrawn and does not lag. Works on all currency pairs and on all timeframes.
The King of Forex Trend Cloud Indicator is a trend following indicator based on moving averages. The Indicator is meant to Capture both the beginning and the end of a trend. This indicator can be used to predict both short and long terms market trends.  The king of Forex Trend Cloud if paired together with the King of Forex Trend Indicator can give a broad picture in market analysis and forecasts. I have attached images for both the  The king of Forex Trend Cloud on its own and  The king of Fore
Chart Patterns Detect 15 patterns (Ascending Triangle, Descending Triangle, Rising Wedge, Falling Wedge, Bullish Flag, Bearish Flag, Bullish Rectangle, Bearish Rectangle Symmetrical triangle, Head and Shoulders, Inverted Head and Shoulders, Triple top, Triple Bottom, Double Top, Double Bottom) Use historical data to calculate the probability of each pattern to succeed (possibility to filter notification according to the chance of success) gives graphic indication about the invalidation level and
"Adjustable Fractals Pro"는 프랙탈 지표의 고급 버전으로, 매우 유용한 거래 도구입니다! - 알다시피 표준 프랙탈 mt4 지표에는 설정이 전혀 없습니다. 이는 거래자에게 매우 불편합니다. - Adjustable Fractals Pro는 이 문제를 해결했습니다. 필요한 모든 설정이 있습니다. - 지표의 조정 가능한 기간(권장 값 - 7 이상). - 가격의 고점/저점으로부터의 조정 가능한 거리. - 프랙탈 화살표의 조정 가능한 디자인. - Info Spread Swap Display가 있습니다. 현재 스프레드와 외환 페어의 스왑을 첨부된 위치에 표시합니다. - 디스플레이에는 계정 잔액, 자본 및 마진도 표시됩니다. - 차트의 어느 모서리에서나 Info Spread Swap Display를 찾을 수 있습니다. 0 - 왼쪽 상단 모서리, 1 - 오른쪽 상단, 2 - 왼쪽 하단, 3 - 오른쪽 하단. - 표시기에는 모바일 및 PC 알림 기능이 내장되어 있습니다. 여기를
PZ Divergence Trading
PZ TRADING SLU
5 (2)
Unlock hidden profits: accurate divergence trading for all markets Tricky to find and scarce in frequency, divergences are one of the most reliable trading scenarios. This indicator finds and scans for regular and hidden divergences automatically using your favourite oscillator. [ Installation Guide | Update Guide | Troubleshooting | FAQ | All Products ] Easy to trade Finds regular and hidden divergences Supports many well known oscillators Implements trading signals based on breakouts Display
PRO Fibonacci Tool MT4
Samil Bozuyuk
5 (1)
The indicator is the advanced form of the MetaTrader 4 standard Fibonacci tool. It is unique and very reasonable for serious Fibonacci traders. Key Features Drawing of Fibonacci retracement and expansion levels in a few seconds by using hotkeys. Auto adjusting of retracement levels once the market makes new highs/lows. Ability to edit/remove any retracement & expansion levels on chart. Auto snap to exact high and low of bars while plotting on chart. Getting very clear charts even though many ret
This is a Pinbar Arrows which will check for reversal pin bars.  They are best when an ongoing trend ends and they signal a reversal. Free Scanner and Detailed Post with Extra Downloads: https://www.mql5.com/en/blogs/post/758569 Features: PinBar Body, Nose and Tail, Left Eye Options Engulfing Bar After Pin Bar Overbought/Oversold with CCI or Stochastic or RSI Distance of Pin bar body from nearest Quarter Point (Option to use Majors, halfpoints, quarters) Volatility Check
MA Cross Signal Alerts
Hafis Mohamed Yacine
MA Cross Signal Alerts_v1.0 The Moving Average Cross displays a fast and a slow moving average (MA). A signal arrow is shown when the two MAs cross. An up arrow is displayed if the fast MA crosses above the slow MA and a down arrow is given if the fast MA crosses below the slow MA. The user may change the inputs (close), methods (EMA) and period lengths.  When two Moving Averages cross the indicator will alert once per cross between crosses and mark the cross point with down or up arrow. Ale
Contact us for any custom order,   CodeYourTrade.com . Keltner Channels are volatility-based envelopes. Moving average dictates direction and the ATR sets the channel width. It’s a trend following indicator used to identify reversals. Channels can also be used to identify overbought and oversold levels when the trend is flat. Trading Strategy We have created 2 zones SELL ZONE and BUY ZONE using the Keltner channels. In SELL ZONE (upper) we take only sell orders and in BUY ZONE (lower) we take
PZ 123 Pattern
PZ TRADING SLU
1 (1)
Unlock powerful breakout opportunities The 123 Pattern is one of the most popular, powerful and flexible chart patterns. The pattern is made up of three price points: a bottom, a peak or valley, and a Fibonacci retracement between 38.2% and 71.8%. A pattern is considered valid when the price breaks beyond the last peak or valley, moment at which the indicator plots an arrow, rises an alert, and the trade can be placed. [ Installation Guide | Update Guide | Troubleshooting | FAQ | All Products ]
Smart Gread Ultimate Edition (SGUL) indicator - based on smart order grid strategy. Maximum customization and flexibility of strategies are the main features of this indicator. In the right corner there is a table with the number and volume of orders. List of adjustable parameters: K: 2.0 - Factor of the next order increase (if the price moves in the other direction). TP: 50 - The number of points at which the order is closed with a profit (minimum profit per 1 lot). Step: 80 - The numb
Voenix
Lorentzos Roussos
4.58 (12)
고조파 패턴 스캐너 및 상인. 일부 차트 패턴도 포함된 패턴: 패턴 패턴 가틀리 패턴 박쥐무늬 사이퍼 패턴 3드라이브 패턴 블랙 스완 패턴 화이트 스완 패턴 콰지모도 패턴 또는 오버 언더 패턴 Alt 박쥐 패턴 나비 패턴 깊은 게 패턴 게 패턴 상어 패턴 파이브오 패턴 헤드앤숄더 패턴 오름차순 삼각형 패턴 하나 둘 셋 패턴 그리고 8개의 커스텀 패턴 Voenix는 25개의 차트 및 피보나치 패턴을 지원하는 다중 시간 프레임 및 다중 쌍 고조파 패턴 스캐너입니다. 사용자 정의 블록 광학 알고리즘을 사용하여 재도장하지 않고 확인 단계에 의존하지 않고 가능한 패턴을 신속하게 발견할 수 있습니다(지그재그 계산과 달리 ). 선택한 패턴을 자동으로 거래하거나 알림을 보내거나 쉽게 액세스하고 평가할 수 있도록 테이블에 수집할 수 있습니다. 거래는 최대 3개의 이익 목표를 가질 수 있으며, 각 목표에서 마감된 주문 비율의 차이입니다. 간단한 단계 후행 기능도 사용할 수 있습니다. 각 패턴은 고
SilentLevels
Barakah Muslih B Alharbi
One of the key elements in trading is identifying zones or levels that allow traders to make buy or sell decisions during trading. أحد العناصر الأساسية في التداول هو تحديد المناطق أو المستويات التي تسمح للمتداولين باتخاذ قرارات الشراء أو البيع أثناء التداول. The indicator displays Fibonacci levels يعرض المؤشر مستويات فيبوناتشي  drawing levels based on historical daily or weekly data. مستويات الرسم بناءً على البيانات التاريخية اليومية أو الأسبوعية. Daily levels update with each new day’s opening
Goal Time
Mourad Ezzaki
GOAL TIME is an expert advisor based on the notion of time, it studies the change of price according to time, and it finally detects the best time to execute a good order. The EA is based on an indicator that draws a price curve in relation to time, this curve is deduced by an algorithm that analyzes old data. Then, the EA exploits the generated curve and executes the correct order. In case of incorrect choice, the EA has the mission to limit the losses. After a thorough study of this strategy o
Trend Scanner
Vladimir Kalendzhyan
4.33 (6)
By purchasing this indicator, you have the right to receive a free copy of one of   my other indicator's or advisor’s!  (All future updates are included. No limits) . To get it , please contact me by  mql5 message ! The Trend Scanner trend line indicator displays the trend direction and its changes. The indicator works on all currency pairs and  timeframes. The indicator simultaneously displays multiple readings on the price chart: the support and resistance lines of the currency pair, the exist
Double HMA MTF for MT4
Pavel Zamoshnikov
4.2 (5)
This is an advanced multi-timeframe version of the popular Hull Moving Average (HMA). Features Graphical panel with HMA indicator data from all timeframes at the same time . If the HMA has switched its direction on any timeframe, a question mark or exclamation mark is displayed on the panel, accompanied by a text and audio message. The messages can be configured separately for each timeframe using the corresponding checkboxes. The indicator is located in a separate window, so as not to overload
Stochastic BR
Antony Augustine
Stochastic BR allows you to recognize reversals professionally. The "Stochastic BR" is designed to recognize profitable counter trend patterns from your chart. Stochastic Indicator: This technical indicator was developed by George Lane more than 50 years ago. The reason why this indicator survived for so many years is because it continues to show consistent signals even in these current times. The Stochastic indicator is a momentum indicator that shows you how strong or weak the current trend i
Trendlines Chart Patterns Indicator (MT4) Automated Chart Patterns & Breakout Signals for MT4: Trade with Precision! The "Trendlines Chart Patterns Indicator" is an advanced trading tool for MetaTrader 4 (MT4) , meticulously designed to identify high-probability buy and sell signals based on dynamically forming, robust trend lines and popular chart patterns . This powerful forex indicator automates the complex process of identifying patterns like triangles, flags, ranges, ascending/descending tr
이 제품의 구매자들이 또한 구매함
Pulse Scalping Line - an indicator for identifying potential pivot points. Based on this indicator, you can build an effective Martingale system. According to our statistics, the indicator gives a maximum of 4 erroneous pivot points in a series. On average, these are 2 pivot points. That is, the indicator shows a reversal, it is erroneous. This means that the second signal of the indicator will be highly accurate. Based on this information, you can build a trading system based on the Martingale
Volatility Trend System - a trading system that gives signals for entries. The volatility system gives linear and point signals in the direction of the trend, as well as signals to exit it, without redrawing and delays. The trend indicator monitors the direction of the medium-term trend, shows the direction and its change. The signal indicator is based on changes in volatility and shows market entries. The indicator is equipped with several types of alerts. Can be applied to various trading ins
Gold Signal Pro
Mohamed Hassan
First 25 copies at $80, after that price becomes $149 (3 copies left) Gold Signal Pro is a powerful MT4 indicator designed to help traders spot strong price reactions in the market. It focuses on clear wick rejections , showing when price strongly rejects a level and often continues in the same direction. Gold Signal Pro is mainly built for scalping gold (XAUUSD) and works best on lower timeframes like M5 and M15 , where timing matters most. That said, it can also be used on any forex pair, a
현재 20% 할인 ! 초보자 또는 전문가 트레이더를 위한 최고의 솔루션! 이 대시보드 소프트웨어는 28개의 통화 쌍에서 작동합니다. 2가지 주요 지표(Advanced Currency Strength 28 및 Advanced Currency Impulse)를 기반으로 합니다. 전체 Forex 시장에 대한 훌륭한 개요를 제공합니다. 고급 통화 강도 값, 통화 이동 속도 및 모든(9) 시간대의 28 Forex 쌍에 대한 신호를 보여줍니다. 추세 및/또는 스캘핑 기회를 정확히 파악하기 위해 차트의 단일 지표를 사용하여 전체 시장을 볼 수 있을 때 거래가 어떻게 개선될지 상상해 보십시오! 잠재적인 거래를 식별하고 확인하면서 강력한 통화와 약한 통화를 더욱 쉽게 식별할 수 있도록 이 지표에 기능을 내장했습니다. 이 표시기는 통화의 강세 또는 약세가 증가 또는 감소하는지 여부와 모든 시간대에서 수행되는 방식을 그래픽으로 보여줍니다. 추가된 새로운 기능은 현재 시장 조건 변화에 적응하는
Scalper Inside PRO
Alexey Minkov
4.74 (69)
An exclusive indicator that utilizes an innovative algorithm to swiftly and accurately determine the market trend. The indicator automatically calculates opening, closing, and profit levels, providing detailed trading statistics. With these features, you can choose the most appropriate trading instrument for the current market conditions. Additionally, you can easily integrate your own arrow indicators into Scalper Inside Pro to quickly evaluate their statistics and profitability. Scalper Inside
Atomic Analyst
Issam Kassas
5 (3)
우선적으로 언급할 점은이 거래 지표가 다시 그리지 않고 지연되지 않으며 이를 통해 수동 및 로봇 거래 모두에 이상적이라는 점입니다. 사용자 매뉴얼: 설정, 입력 및 전략. Atomic Analyst는 가격의 강도와 모멘텀을 활용하여 시장에서 더 나은 이점을 찾는 PA Price Action Indicator입니다. 고급 필터를 장착하여 잡음과 거짓 신호를 제거하고 거래 잠재력을 높이는 데 도움이 됩니다. 복잡한 지표의 다중 레이어를 사용하여 Atomic Analyst는 차트를 스캔하고 복잡한 수학적 계산을 간단한 신호와 색상으로 변환하여 초보 트레이더가 이해하고 일관된 거래 결정을 내릴 수 있도록합니다. "Atomic Analyst"는 새로운 및 경험이 풍부한 트레이더를위한 종합적인 거래 솔루션입니다. 프리미엄 지표와 최고 수준의 기능을 하나의 거래 전략에 결합하여 모든 종류의 트레이더에 대한 다재다능한 선택지가되었습니다. 인트라데이 거래 및 스캘핑 전략 : 빠르고 정확한 일일
이 지표를 구매하면 제 프로페셔널 트레이드 매니저를 무료로 드립니다. 우선 이 거래 시스템이 리페인팅, 리드로잉 및 레이그 인디케이터가 아니라는 점을 강조하는 것이 중요합니다. 이는 수동 및 로봇 거래 모두에 이상적인 것으로 만듭니다. 온라인 강좌, 설명서 및 프리셋 다운로드. "스마트 트렌드 트레이딩 시스템 MT5"은 새로운 및 경험이 풍부한 트레이더를 위해 맞춤형으로 제작된 종합적인 거래 솔루션입니다. 10개 이상의 프리미엄 인디케이터를 결합하고 7개 이상의 견고한 거래 전략을 특징으로 하여 다양한 시장 조건에 대한 다목적 선택이 가능합니다. 트렌드 추종 전략: 효과적인 트렌드 추이를 타기 위한 정확한 진입 및 손절 관리를 제공합니다. 반전 전략: 잠재적인 트렌드 반전을 식별하여 트레이더가 범위 시장을 활용할 수 있게 합니다. 스캘핑 전략: 빠르고 정확한 데이 트레이딩 및 단기 거래를 위해 설계되었습니다. 안정성: 모든 인디케이터가 리페인팅, 리드로잉 및 레이그가 아니므로 신뢰
GOLD Impulse with Alert
Bernhard Schweigert
4.64 (11)
이 지표는 Advanced Currency IMPULSE with ALERT  +   Currency Strength Exotics  의 2가지 제품의 슈퍼 조합입니다. 그것은 모든 시간 프레임에 대해 작동하며 8개의 주요 통화와 하나의 기호에 대한 강약의 충동을 그래픽으로 보여줍니다! 이 표시기는 금, 이국적인 쌍, 상품, 지수 또는 선물과 같은 기호에 대한 통화 강도 가속을 표시하는 데 특화되어 있습니다. 금, 은, 오일, DAX, US30, MXN, TRY, CNH 등의 진정한 통화 강도 가속(충동 또는 속도)을 표시하기 위해 9번째 줄에 모든 기호를 추가할 수 있습니다. 새로운 기본 알고리즘을 기반으로 구축되어 잠재적인 거래를 훨씬 더 쉽게 식별하고 확인할 수 있습니다. 이는 통화의 강세 또는 약세가 가속되는지 여부를 그래픽으로 표시하고 가속 속도를 측정하기 때문입니다. 자동차의 속도계처럼 생각하면 됩니다. 가속화할 때 Forex 시장에서 동일한 일이 분명히 더 빠르
Trend Screener
STE S.S.COMPANY
4.79 (95)
트렌드 표시기, 트렌드 트레이딩 및 필터링을 위한 획기적인 고유 솔루션, 하나의 도구 안에 내장된 모든 중요한 트렌드 기능! Forex, 상품, 암호 화폐, 지수 및 주식과 같은 모든 기호/도구에 사용할 수 있는 100% 다시 칠하지 않는 다중 시간 프레임 및 다중 통화 표시기입니다. 기간 한정 특가: 지원 및 저항 스크리너 지표는 단 100달러에 평생 제공됩니다. (원래 가격 50 달러) (제안 연장) Trend Screener는 차트에 점이 있는 화살표 추세 신호를 제공하는 효율적인 지표 추세 추종 지표입니다. 추세 분석기 표시기에서 사용할 수 있는 기능: 1. 트렌드 스캐너. 2. 최대 이익 분석이 있는 추세선. 3. 추세 통화 강도 측정기. 4. 경고가 있는 추세 반전 점. 5. 경고가 있는 강력한 추세 점. 6. 추세 화살표 Trend Screener Indicator가 있는 일일 분석 예, 일일 신호 성능...등은 여기에서 찾을 수 있습니다.   여기를 클릭하십시오. L
Quantum Regime Indicator
Gideon Asiamah Yeboah
Product Name:   Quantum Regime Indicator Short Description:   A multi-engine structural regime and volatility filter. Description: Quantum Regime Indicator (QRI) is a sophisticated technical analysis algorithm designed to identify market structure shifts and volatility regimes. Unlike standard indicators that rely on immediate price action, QRI utilizes a hierarchical logic architecture to filter market noise and identify statistical extremes. The indicator is built on the philosophy of "Market
Smart Price Action Concepts
Issam Kassas
4.75 (12)
우선적으로, 이 거래 도구는 전문적인 거래에 이상적인 비-다시 그리기 및 지연되지 않는 지표입니다.  온라인 강좌, 사용자 매뉴얼 및 데모. 스마트 가격 액션 컨셉트 인디케이터는 신규 및 경험 많은 트레이더 모두에게 매우 강력한 도구입니다. Inner Circle Trader Analysis 및 Smart Money Concepts Trading Strategies와 같은 고급 거래 아이디어를 결합하여 20가지 이상의 유용한 지표를 하나로 결합합니다. 이 인디케이터는 스마트 머니 컨셉트에 중점을 두어 대형 기관의 거래 방식을 제공하고 이동을 예측하는 데 도움을 줍니다.  특히 유동성 분석에 뛰어나 기관이 어떻게 거래하는지 이해하는 데 도움을 줍니다. 시장 트렌드를 예측하고 가격 변동을 신중하게 분석하는 데 탁월합니다. 귀하의 거래를 기관 전략에 맞추어 시장의 동향에 대해 더 정확한 예측을 할 수 있습니다. 이 인디케이터는 시장 구조를 분석하고 중요한 주문 블록을 식별하고 다양한
Miraculous Indicator – Gann Square of Nine 기반 100% 비리페인트 Forex 및 바이너리 도구 이 영상은 Miraculous Indicator 를 소개합니다. 이 지표는 Forex 및 바이너리 옵션 트레이더를 위해 특별히 개발된 매우 정확하고 강력한 트레이딩 도구입니다. 이 지표가 독특한 이유는 전설적인 **Gann Square of Nine(Gann 9의 사각형)**과 **Gann's Law of Vibration(Gann 진동의 법칙)**에 기반을 두고 있기 때문입니다. 이는 현대 트레이딩에서 가장 정밀한 예측 도구 중 하나로 손꼽힙니다. Miraculous Indicator는 완전히 비리페인트(non-repaint) 됩니다. 즉, 캔들이 마감된 후에도 신호가 변경되거나 사라지지 않습니다. 보이는 것이 곧 결과입니다. 이는 트레이더가 자신감을 가지고 거래에 진입하고 청산할 수 있는 신뢰할 수 있고 일관된 기반을 제공합니다. 주요 특징: Gann
Currency Strength Exotics
Bernhard Schweigert
4.88 (33)
현재 20% 할인! 초보자 또는 전문가 트레이더를 위한 최고의 솔루션! 이 표시기는 Exotic Pairs Commodities, Indexes 또는 Futures와 같은 기호에 대한 통화 강도를 표시하는 데 특화되어 있습니다. 금, 은, 석유, DAX, US30, MXN, TRY, CNH 등의 진정한 통화 강도를 보여주기 위해 9번째 줄에 모든 기호를 추가할 수 있습니다. 이것은 독특하고 고품질이며 저렴한 거래 도구입니다. 우리는 많은 독점 기능과 새로운 공식을 통합했습니다. 새로운 추세 또는 스캘핑 기회의 정확한 트리거 포인트를 정확히 찾아낼 수 있기 때문에 거래가 어떻게 개선될지 상상해 보십시오. 사용 설명서: 여기를 클릭 https://www.mql5.com/en/blogs/post/708876 모든 시간대에 작동합니다. TREND를 빠르게 확인할 수 있습니다! 새로운 기본 알고리즘을 기반으로 설계되어 잠재적인 거래를 더욱 쉽게 식별하고 확인할 수 있습니다. 8개의
RFI levels PRO
Roman Podpora
사전 지표       시장 반전 수준과 영역을 파악하여   가격이 해당 수준으로 되돌아올 때까지 기다렸다가 새로운 추세의 시작점에서 진입할 수 있도록 해줍니다. 즉, 추세의 끝에서 진입하는 것이 아닙니다. 그는 보여준다       반전 수준       시장이 방향 전환을 확인하고 추가적인 움직임을 형성하는 지점입니다. 이 지표는 차트를 다시 그릴 필요 없이 작동하며, 모든 금융 상품에 최적화되어 있고, 특정 금융 상품과 함께 사용할 때 최대의 잠재력을 발휘합니다.       트렌드 라인즈 프로       지시자. 모든 계측기에 적용 가능한 가역 구조 스캐너 모든 거래 상품을 자동으로 추적하고 모든 R-반전 패턴을 즉시 식별하여 LOGIC AI 신호가 이미 존재하는 위치와 기타 유용한 정보를 표시합니다. 로직 AI – 진입점을 표시해주는 도우미 시장 진입에 가장 적합한 시점을 판단하는 지능형 신호입니다. TPSproSYSTEM 알고리즘을 사용하여 가격 변동, 추세 및 주요 시장 참
Basic Harmonic Patterns Dashboard
Mehran Sepah Mansoor
5 (3)
이 대시보드는 선택한 심볼에 대해 사용 가능한 최신 고조파 패턴을 표시하므로 시간을 절약하고 더 효율적으로 사용할 수 있습니다 / MT5 버전 . 무료 인디케이터: Basic Harmonic Pattern 인디케이터 열 Symbol : 선택한 심볼이 나타납니다 Trend : 강세 또는 약세 Pattern : 패턴 유형(가틀리, 나비, 박쥐, 게, 상어, 사이퍼 또는 ABCD) Entry : 진입 가격 SL: 스톱로스 가격 TP1: 1차 테이크프로핏 가격 TP2: 2차 테이크프로핏 가격 TP3: 3차 테이크프로핏 가격 Current price: 현재 가격 Age (in bars): 마지막으로 그려진 패턴의 나이 주요 입력 Symbols : "28개 주요 통화쌍" 또는 "선택한 심볼" 중에서 선택합니다. Selected Symbols : 쉼표로 구분하여 모니터링하려는 원하는 심볼("EURUSD,GBPUSD,XAUUSD")을 선택합니다. 브로커에 쌍에 접미사 또는 접두사가 있는
Supreme Commander
Ramon Sobrevals Arce
4.13 (8)
The indicator of the indicators. The Most Powerful Technique to Determine Forex Trend Strength in 2023. We have perfected Supreme Commander that it calculates an average of the selected indicators (up to 16) and the selected timeframe (all) with the result of a single trend that indicates the potential of buying and selling.  It includes the following indicators: Accelerator/Decelerator oscillator Average Directional Movement Index Awesome oscillator; Bulls and Bears  Commodity Channel Index; De
F-16 비행기 지표를 소개합니다. 이것은 귀하의 거래 경험을 혁신하도록 설계된 최첨단 MT4 도구입니다. F-16 전투기의 비할 데 없는 속도와 정밀성에 영감을 받아이 지표는 고급 알고리즘과 최첨단 기술을 결합하여 금융 시장에서 압도적인 성능을 제공합니다. F-16 비행기 지표를 사용하면 실시간 분석을 제공하고 매우 정확한 거래 신호를 생성하여 경쟁을 앞서갈 수 있습니다. 다양한 자산 클래스에서 수익 기회를 식별하는 데 필요한 동적 기능을 갖추고 있어 확신을 가지고 정보에 근거한 결정을 내릴 수 있습니다. 사용자 친화적인 인터페이스로 구성된 F-16 비행기 지표는 인기있는 MetaTrader 4 플랫폼과 완벽하게 통합되어 원활하고 효율적인 거래 과정을 보장합니다. 초보자 트레이더든 경험 많은 전문가든 이 지표를 쉽게 사용자 정의하여 고유한 거래 스타일과 선호도에 맞출 수 있습니다. F-16 비행기 지표의 강력함을 경험해 보세요. 이 지표는 시장 트렌드를 정확하고 민첩하게 탐색하며
Volatility Master
INTRAQUOTES
5 (5)
Volatility Master for MetaTrader is a real-time dashboard tool that scans up to 56 symbols using up to 2 flexible dashboards on different charts to identify high-volatility, trending markets instantly. With clear bullish/bearish signals, customizable alerts, and a user-friendly interface, it helps you avoid range-bound conditions and focus on high-probability trades. Clarity leads to confidence. Trade confidently and protect your capital effectively with this powerful dashboard. Setup & Guide: 
TPSpro RFI Levels
Roman Podpora
4.85 (27)
러시아어 설명서  /  영어   설명서  /  MT5 버전 주요 기능: 판매자와 구매자의 활동 영역을 표시합니다! 이 지표는 매수 및 매도에 대한 모든 올바른 첫 번째 임펄스 레벨/존을 표시합니다. 진입점 검색이 시작되는 이러한 레벨/존이 활성화되면 레벨의 색상이 바뀌고 특정 색상으로 채워집니다. 상황을 더욱 직관적으로 파악할 수 있도록 화살표도 표시됩니다. LOGIC AI - 템플릿 활성화 시 진입점 검색을 위한 영역(원) 표시 시각적 명확성을 개선하기 위해 인공지능을 사용하여 진입점을 검색한 영역을 표시하는 기능이 추가되었습니다. 더 높은 시간대의 레벨/존 표시(MTF 모드) 더 높은 시간 간격을 사용하여 레벨/존을 표시하는 기능이 추가되었습니다. 또한, 이 지표는 자동 추세 감지 기능(   TPSproTREND PRO   )을 구현했습니다. 거래를 위한 별도의 전문적인 단계별 알고리즘 이 알고리즘은 추세 방향과 반대 방향으로의 당일 거래 모두에 적합하도록 설계되었습니다. 각
FX Volume
Daniel Stein
4.63 (38)
FX Volume: 브로커 시각에서 바라보는 진짜 시장 심리 간단 요약 트레이딩 접근 방식을 한층 더 향상시키고 싶으신가요? FX Volume 는 소매 트레이더와 브로커의 포지션을 실시간으로 파악할 수 있게 해 줍니다. 이는 COT 같은 지연된 보고서보다 훨씬 빠릅니다. 꾸준한 수익을 추구하는 분이든, 시장에서 더 깊은 우위를 원하시는 분이든, FX Volume 을 통해 대규모 불균형을 찾아내고, 돌파 여부를 확인하며 리스크 관리를 정교화할 수 있습니다. 지금 시작해 보세요! 실제 거래량 데이터가 의사결정을 어떻게 혁신할 수 있는지 직접 경험해 보시기 바랍니다. 1. 트레이더에게 FX Volume이 매우 유익한 이유 탁월한 정확도를 지닌 조기 경보 신호 • 다른 사람들보다 훨씬 앞서, 각 통화쌍을 매수·매도하는 트레이더 수를 거의 실시간으로 파악할 수 있습니다. • FX Volume 은 여러 리테일 브로커에서 추출한 실제 거래량 데이터를 종합해 명확하고 편리한 형태로 제공하는
FX Power MT4 NG
Daniel Stein
4.95 (21)
FX Power: 통화 강세 분석으로 더 스마트한 거래 결정을 개요 FX Power 는 어떤 시장 상황에서도 주요 통화와 금의 실제 강세를 이해하기 위한 필수 도구입니다. 강한 통화를 매수하고 약한 통화를 매도함으로써 FX Power 는 거래 결정을 단순화하고 높은 확률의 기회를 발견합니다. 트렌드를 따르거나 극단적인 델타 값을 사용해 반전을 예측하고자 한다면, 이 도구는 귀하의 거래 스타일에 완벽히 적응합니다. 단순히 거래하지 말고, FX Power 로 더 스마트하게 거래하세요. 1. FX Power가 거래자에게 매우 유용한 이유 통화와 금의 실시간 강세 분석 • FX Power 는 주요 통화와 금의 상대적 강세를 계산하고 표시하여 시장 역학에 대한 명확한 통찰력을 제공합니다. • 어떤 자산이 앞서고 있고 어떤 자산이 뒤처지는지 모니터링하여 보다 현명한 거래 결정을 내릴 수 있습니다. 포괄적인 멀티 타임프레임 뷰 • 단기, 중기 및 장기 타임프레임에서 통화와 금의 강세를
지진계 Marketquake Detector. Description in English : https://www.mql5.com/en/market/product/113869?source=Site+Market+Product+Page#description How to use the Seismograph : https://www.mql5.com/en/market/product/113869#!tab=comments&page=2&comment=52806941 Create an EA : https://www.mql5.com/en/market/product/113869#!tab=comments&page=3&comment=52816509 어떤 방식으로 거래하든 유동성이 낮은 시장에 진입하는 것을 피하고 싶을 것입니다.- 지진계는 시장 랠리 전에 시장에 진입할 수 있는 적절한 시기를 도와줄 것입니다. 그러나 바쁠 시장 시간에 진입을 확인했음에도 불구하고 많은 사람들이 유동성이 부족한 시
Dynamic Forex28 Navigator
Bernhard Schweigert
4.43 (7)
Dynamic Forex28 Navigator - 차세대 외환 거래 도구. 현재 49% 할인. Dynamic Forex28 Navigator는 오랫동안 인기 있는 지표의 진화형으로, 세 가지의 힘을 하나로 결합했습니다. 고급 통화 Strength28 지표(695개 리뷰) + 고급 통화 IMPULSE with ALERT(520개 리뷰) + CS28 콤보 신호(보너스). 지표에 대한 자세한 정보 https://www.mql5.com/en/blogs/post/758844 차세대 Strength 지표는 무엇을 제공합니까?  원래 지표에서 좋아했던 모든 것이 새로운 기능과 더 높은 정확도로 강화되었습니다. 주요 기능: 독점적인 통화 Strength 공식.  모든 시간대에 걸쳐 부드럽고 정확한 강도선. 추세와 정확한 진입을 식별하는 데 이상적입니다. 역동적인 시장 피보나치 수준(시장 피보나치).  이 지표에만 있는 고유한 기능. 가격 차트가 아닌 통화 강도에 피보나치가 적용됩니다.
Advanced Currency IMPULSE with ALERT
Bernhard Schweigert
4.91 (489)
현재 31% 할인!! 초보자 또는 전문가 트레이더를 위한 최고의 솔루션! 이 지표는 우리가 독점 기능과 비밀 공식을 통합했기 때문에 독특하고 고품질이며 저렴한 거래 도구입니다. 단 하나의 차트로 28개 통화 쌍 모두에 대한 경고를 제공합니다. 새로운 추세 또는 스캘핑 기회의 정확한 트리거 포인트를 정확히 찾아낼 수 있기 때문에 거래가 어떻게 개선될지 상상해 보십시오! 새로운 기본 알고리즘을 기반으로 구축되어 잠재적인 거래를 훨씬 더 쉽게 식별하고 확인할 수 있습니다. 이는 통화의 강세 또는 약세가 가속되는지 여부를 그래픽으로 표시하고 가속 속도를 측정하기 때문입니다. 자동차의 속도계처럼 생각하면 됩니다. 가속화할 때 Forex 시장에서 동일한 일이 분명히 더 빠르게 발생합니다. 즉, 반대 방향으로 가속화되는 통화를 페어링하면 잠재적으로 수익성 있는 거래를 식별한 것입니다. 통화 모멘텀의 수직선과 화살표가 거래를 안내합니다! 역동적인 Market Fibonacci 23 레벨은
Break and Retest
Mohamed Hassan
4.24 (21)
This Indicator only places quality trades when the market is really in your favor with a clear break and retest. Patience is key with this price action strategy! If you want more alert signals per day, you increase the number next to the parameter called: Support & Resistance Sensitivity.  After many months of hard work and dedication, we are extremely proud to present you our  Break and Retest price action indicator created from scratch. One of the most complex indicators that we made with over
A top and bottom indicator that can intuitively identify the trend of the band. It is the best choice for manual trading, without redrawing or drifting. How to get this indicator for free: Learn more Price increase of $20 every 3 days, price increase process: 79--> 99 --> 119...... Up to a target price of $1000. For any novice and programming trading friend, you can write the signal into the EA to play freely. Array 3 and array 4, for example, 3>4 turns green, 3<4 turns red. If you don't underst
Easy Breakout
Mohamed Hassan
4.71 (14)
After your purchase, feel free to contact me for more details on how to receive a bonus indicator called VFI, which pairs perfectly with Easy Breakout for enhanced confluence!    Easy Breakout is a powerful price action trading system built on one of the most popular and widely trusted strategies among traders: the Breakout strategy ! This indicator delivers crystal-clear Buy and Sell signals based on breakouts from key support and resistance zones. Unlike typical breakout indicators, it levera
TPSproTREND PrO
Roman Podpora
4.67 (27)
TPSproTrend PRO       - 이는 시장을 자동으로 분석하여 추세 및 추세 변화에 대한 정보를 제공하고 거래 진입 시점을 표시하는 추세 지표입니다.       다시 그릴 필요 없이! ИНСТРУКЦИЯ RUS   -   지침   영어   -   버전 MT5 주요 기능: 정확한 진입 신호       재도색 없이! 한 번 신호가 나타나면 그 신호는 계속 유효합니다! 이는 신호를 제공한 후 변경되어 잠재적으로 예치금 손실로 이어질 수 있는 리페인팅 지표와는 확연히 다른 점입니다. 이제 더 높은 확률과 정확도로 시장에 진입할 수 있습니다. 또한 화살표가 나타난 후 목표가(익절)에 도달하거나 반전 신호가 나타날 때까지 캔들에 색상을 입히는 기능도 있습니다   . 손절매/이익실현 영역 표시 진입점을 찾을 때 시각적 명확성을 높이기 위해, 최적의 진입점을 찾을 수 있는 매수/매도 영역을 초기에 표시하는 모듈을 개발했습니다. 또한, 손절매 수준을 시간에 따라 관리하는 지능형 로직을
Gold Venamax MT4
Sergei Linskii
5 (1)
Gold Venamax   - 이것은 최고의 주식 기술 지표입니다. 지표 알고리즘은 자산의 가격 변동을 분석하고 변동성과 잠재적 진입 영역을 반영합니다.   표시기 기능: 이것은 편안하고 수익성 있는 거래를 위한 매직과 두 개의 추세 화살표 블록을 갖춘 슈퍼 지표입니다. 블록 전환을 위한 빨간색 버튼이 차트에 표시됩니다. 매직은 표시기 설정에서 설정되므로 서로 다른 블록을 표시하는 두 개의 차트에 표시기를 설치할 수 있습니다. Gold Venamax는 서로 다른 화살표 버퍼(GV 및 SD)를 사용하여 두 개의 차트에 배치할 수 있습니다. 이렇게 하려면 설정에서 다른 Magic을 선택해야 합니다. 예를 들어 하나는 Magic = 999이고 다른 하나는 Magic = 666입니다. 다음으로 차트의 빨간색 버튼으로 화살표 버퍼를 선택할 수 있습니다. 지표 설정의 각 화살표 버퍼(GV 및 SD)에는 편안하고 수익성 있는 거래를 위한 별도의 화살표 필터가 있습니다(UseFiltrGV = t
Advanced Supply Demand
Bernhard Schweigert
4.91 (296)
현재 33% 할인! 초보자나 전문 트레이더를 위한 최고의 솔루션! 이 보조지표는 우리가 다수의 독창적 기능과 새로운 공식을 통합한 독특하고 고품질이며 저렴한 거래 도구입니다. 이 업데이트를 통해 이중 시간대를 표시할 수 있습니다. 더 높은 TF를 표시할 수 있을 뿐만 아니라 차트 TF와 더 높은 TF 모두를 표시할 수 있습니다: 중첩 영역 표시. 모든 Supply Demand 트레이더들이 좋아할 것입니다. :) 중요한 정보 공개 Advanced Supply Demand의 잠재력을 극대화하려면 다음을 방문하십시오. https://www.mql5.com/ko/blogs/post/720245   진입 또는 목표의 명확한 트리거 포인트를 정확히 찾아냄으로 해서 거래가 어떻게 개선될지 상상해 보십시오. 새로운 알고리즘을 기반으로 매수자와 매도자 간의 잠재적인 불균형을 훨씬 더 쉽게 분간할 수 있습니다. 왜냐하면 가장 강한 공급영역과 가장 강한 수요 영역과 과거에 어떻게 진행 되었는지를(이전
제작자의 제품 더 보기
Monthly OHLC MA
Sattiraju Kottapalli
This indicator Plots Open, High, Low and Close levels of previous month, on current month's lower time frames. These levels act as good support and resistance levels. Most of the time price oscillates within the levels. wait for price to reach these levels and act accordingly. Pay special attention to confluence of levels. According to my observation if Close (White) level is in confluence with any other levels, High probability of break out or bounce back. Scroll back to previous months and ob
FREE
Adament Levels Logic B
Sattiraju Kottapalli
5 (1)
First of all i would like to thank you all for the huge success of "Adamant Levels Logic A" for more details of logic A please refer to the below link: https://www.mql5.com/en/market/product/36082 After its success, i am confident enough that this indicator "Adamant Levels Logic B"  also will play an important role in your successful trading carrier. Introduction to Adamant Levels: Disclaimer : If you are looking for a Fancy, colorful and eye catchy indicator please stay away. No trader can
필터:
Zelioner
37
Zelioner 2020.12.18 04:55 
 

very bad, i mistakently bought this thing while trying to rent it, am not even happy but it

Aravind Kolanupaka
9874
Aravind Kolanupaka 2020.11.20 11:12 
 

Good, very much useful with my trading strategy

jvp999
309
jvp999 2019.03.12 22:24 
 

사용자가 평가에 대한 코멘트를 남기지 않았습니다

Krishna Karanam
78
Krishna Karanam 2019.03.04 18:56 
 

사용자가 평가에 대한 코멘트를 남기지 않았습니다

리뷰 답변